Banco Frances Del Rio SA BBAR Stock

Banco Frances Del Rio SA stock trades under the ticker BBAR & has shown recent bullishness that traders & investors should take a closer look into.

BBAR stock closed at $3.24/share on 1/28/2022.

Banco Frances Del Rio SA BBAR Stock’s Technicals Broken Down

Banco Frances Del Rio SA BBAR Stock's Technical Performance Over The Last Year

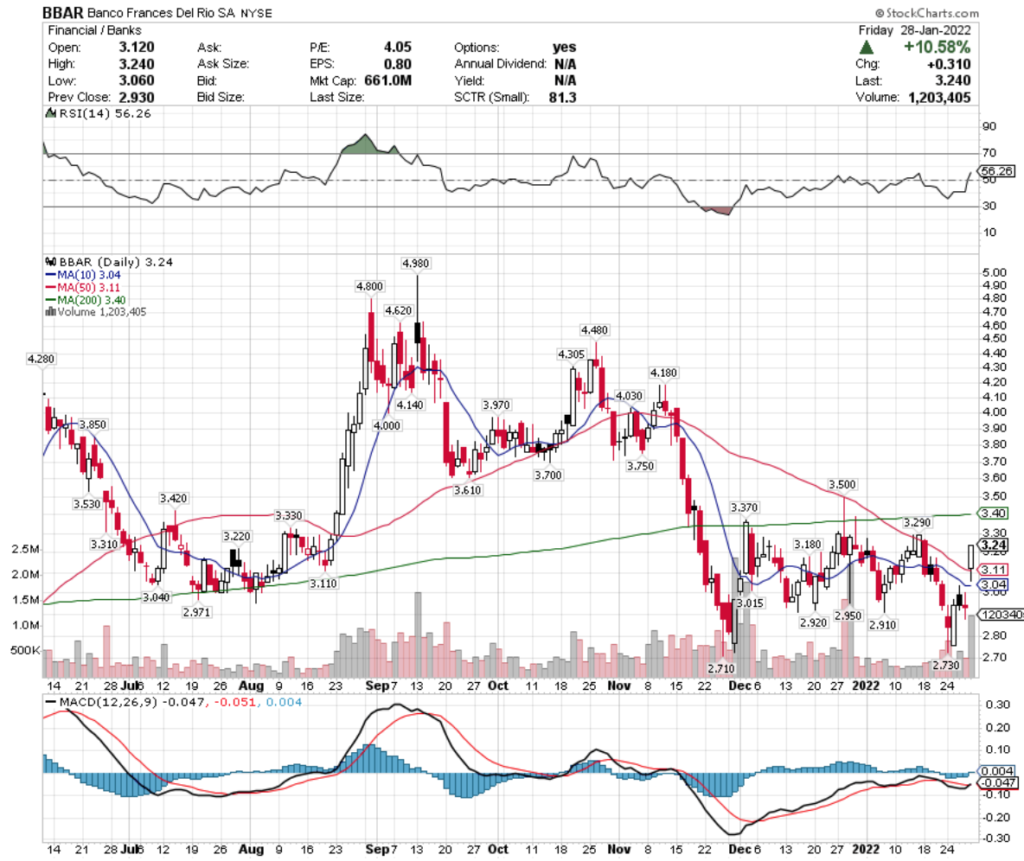
BBAR Stock Price: $3.24

10 Day Moving Average: $3.04

50 Day Moving Average: $3.11

200 Day Moving Average: $3.40

RSI: 56

MACD: -0.047

On Friday, BBAR stock completed a bullish MACD crossover; gapping up 10.58% to break out above its 10 & 50 Day Moving Averages.

BBAR has been trading on above average volume in the last month, compared to the year prior.

With a neutral RSI, they look to have solid momentum to test the $3.29 & $3.50 price levels.

Banco Frances Del Rio SA BBAR Stock As A Long-Term Investment

Investors may find BBAR stock’s valuation metrics appealing, with a P/E(ttm) of 6.04 & a P/B (mrq) of 0.43.

BBAR recently had Quarterly Earnings Growth Y-o-Y of 9.6%.

Their balance sheet also looks appealing, with $183.65B in Total Cash (mrq) & $54.66B in Total Cash (mrq).

Unfortunately, they do not offer a dividend.

2.6% of BBAR stock’s share float is held by institutional investors.

Banco Frances Del Rio SA BBAR Stock As A Long-Term Investment

BBAR stock also has options that traders can use to profit from their price movements in either direction.

I am looking at the contracts with the 2/18 expiration date.

The $3 & $4 calls look appealing, but are very limited in open interest.

The $3 puts are the only strike price that have open interest, which may be able to be used as a hedge in the event their stock price falls.

Tying It All Together

Overall, BBAR stock has many interesting attributes that may appeal to traders & investors alike.

Their balance sheet & valuation metrics all look strong from an investing standpoint, but they sadly do not offer a dividend.

Their current momentum looks strong & set to continue, however there is limited open interest in their options.

BBAR stock is worth taking a closer look at to see if it fits into your trading & investing strategy.

*** I DO NOT OWN SHARES OF BBAR STOCK ***

Regeneron Pharmaceuticals, Inc. REGN Stock

Regeneron Pharmaceuticals, Inc. stock trades under the ticker REGN & has recently shown some bullish signals that traders & investors should take a closer look into.

REGN stock closed at $624.92/share on 1/28/2022, trading on slightly above average volume.

Regeneron Pharmaceuticals, Inc. REGN Stock’s Technicals Broken Down

Regeneron Pharmaceuticals, Inc. REGN Stock's Technical Performance Over The Last Year

REGN Stock Price: $624.92

10 Day Moving Average: $614.39

50 Day Moving Average: $630.70

200 Day Moving Average: $589.41

RSI: 52.44

MACD: -3.941

REGN stock completed a bullish MACD crossover yesterday, while also breaking out above its 10 Day Moving Average.

Despite the broader market indexes falling in January 2022, their price has remained relatively flat in the $592.86-$632.75 price range.

They will need to break out above the $633-price level to go on to test the $651.28-level.

Regeneron Pharmaceuticals, Inc. REGN Stock As A Long-Term Investment

Investors may find REGN stock’s P/E (ttm) appealing at 9.7, however their P/B (mrq) is a bit rich at 3.77.

REGN experienced 50.5% Quarterly Revenue Growth Y-o-Y, with 93.8% Quarterly Earnings Growth Y-o-Y.

REGN stock’s balance sheet looks appealing, with Total Cash (mrq) of $5.79B & Total Debt (mrq) of $2.7B.

Their Beta is very low at 0.17, signaling that they move in a much less volatile manner than the broader market indexes.

Despite not offering a dividend yield, 87.6% of REGN stock’s total share float is held by institutional investors.

Regeneron Pharmaceuticals, Inc. REGN Stock As A Short-Term Trade Using Options

Traders can use REGN options in order to capitalize on their momentum, as well as ward off broader market volatility.

I am looking at the contracts with the 2/18 expiration date.

The $620 & $625 call options both look interesting, although lacking in liquidity.

The $630 & $640 puts also look appealing, but have the same low levels of open interest.

Tying It All Together

REGN stock has many interesting characteristics for both long-term focused investors & short-term oriented traders.

Investors will like their balance sheet & valuation, although may be disappointed that they do not pay a dividend.

Traders will like their near-term bullish momentum, however the lack of liquidity in their options may be a cause of concern to some.

REGN stock is worth taking a closer look at, regardless of your trading style.

*** I DO NOT OWN SHARES OF REGN STOCK ***

Lexington Corp. Properties Trust LXP Stock

Lexington Corp. Properties Trust stock trades under the ticker LXP & has shown recent bullishness that traders & investors should take a closer look at.

LXP stock closed at $14.41/share on 1/28/2022.

Lexington Corp. Properties Trust LXP Stock’s Technicals Broken Down

Lexington Corp. Properties Trust LXP Stock's Technical Performance Over The Last Year

LXP Stock Price: $14.41

10 Day Moving Average: $14.11

50 Day Moving Average: $14.84

200 Day Moving Average: $13.38

RSI: 48.5

MACD: -0.214

LXP stock completed a bullish MACD crossover yesterday, while also breaking above its 10 Day Moving Average.

They have traded at above average volumes recently compared with the rest of the previous year & have a neutral RSI after their recent drop in January 2022.

Their next level of resistance is in the $14.58-14.71/share range.

Lexington Corp. Properties Trust LXP Stock As A Long-Term Investment

Investors will find LXP stock’s P/E(ttm) of 17.78 to be fair, as well as their P/B (mrq) of 2.03.

LXP’s Quarterly Revenue Growth Y-o-Y was down -1.3%, with -84.2% Quarterly Earnings Growth Y-o-Y.

Their balance sheet will need a closer examination, as currently it says they have Total Cash (mrq) of $150.08M & Total Debt (mrq) of $1.57B.

LXP’s beta is 0.69, meaning that they tend to move less aggressively than the broader market indexes.

LXP’s dividend yield is 3.06%, which looks relatively safe & stable as their payout ratio is 54.5%.

98% of LXP stock’s total share float is owned by institutional investors.

Lexington Corp. Properties Trust LXP Stock As A Short-Term Trade Using Options

Traders can use options to take advantage of LXP stock’s current momentum, while also hedging against more market volatility in the near-term.

I am looking at the contracts with the 2/18 expiration dates.

The $12.50 & $15 calls look appealing, with the latter having much more open interest.

The $15 puts also caught my eye, but overall there is not a lot of liquidity in their puts, with no open interest at the $17 or $20 strike prices.

Tying It All Together

All-in-all, there look to be many interesting attributes to LXP stock.

Investors will like their dividend yield, as well as their valuation metrics, but may be concerned about their balance sheet.

Traders will like their current volatility & momentum, as it presents many opportunities for profits using options.

LXP stock is worth taking a closer look at, regardless of your trading style & strategy.

*** I DO NOT OWN SHARES OF LXP STOCK ***

Visa Inc. V Stock Analysis

Visa Inc. stock trades under the ticker V & has shown recent bullishness that traders & investors should take a closer look at.

V closed at $228/share at the end of trading on 1/28/2022.

Visa Inc. V Stock’s Technicals Broken Down

Visa Inc. V Stock's Technical Performance Over The Last Year

V Stock Price: $228.00

10 Day Moving Average: $210.92

50 Day Moving Average: $209.93

200 Day Moving Average: $224.58

RSI: 66.05

MACD: -0.527

Visa Inc. stock completed a bullish MACD crossover yesterday, while gapping up above all of its moving averages.

Yesterday’s gains came on higher than average trading volume, and it looks to show signs of continued strength in the near-term.

The next test of resistance is the $236-237 price level.

Visa Inc. V Stock As A Long-Term Investment

Investors may find V stock’s P/E(ttm) appealing at 36.57, although their P/B (mrq) is a bit rich at 12.97.

V stock saw 24.1% Quarterly Revenue Growth Y-o-Y, with 26.6% Quarterly Earnings Growth Y-o-Y.

Their balance sheet requires a closer examination, with Total Cash (mrq) of $15.92B & Total Debt (mrq) of $20.92B.

Visa Inc. stock offers a 0.49% dividend yield, which appears to be very safe at a 22% Payout Ratio.

96.96% of Visa stock’s share float is held by institutional investors.

Visa Inc. V Stock As A Short-Term Trade Using Options

Visa Inc.’s stock has options that traders can trade to take advantage of their price movement in either direction, while also hedging against volatility.

I am looking at the contracts with the 2/18 expiration date.

The $227.50 & $230 calls look interesting, although the in-the-money calls are a lot less liquid than the latter.

The $235 puts look appealing, and as V has weekly expirations, I expect to see more contracts written in the near-future to provide more open interest.

Tying It All Together

Overall, traders & investors should take a closer look at Visa Inc. stock.

Investors will find their valuation & balance sheet to be interesting, although they will need to examine a few things I outlined above more thoroughly before investing.

Traders will like their current momentum path, as well as their options’ liquidity as more contracts are written after weekly expirations.

V stock is worth taking a closer look at, regardless of your trading style.

*** I DO NOT OWN SHARES OF V STOCK ***

Macy’s Inc. M Stock Analysis

Macy’s Inc. stock trades under the ticker M & has shown recent bullishness that traders & investors should take a closer look at.

M stock closed at $26.85/share on 1/25/2022, with additional bullish momentum behind it, despite broader market volatility.

Macy’s Inc. M Stock’s Technicals Broken Down

Macy's Inc. M Stock's Technical Performance Over The Last Year

M Stock Price: $26.85

10 Day Moving Average: $25.74

50 Day Moving Average: $27.43

200 Day Moving Average: $22.06

RSI: 52.98

MACD: -0.329

Yesterday, M stock completed a bullish MACD crossover, while temporarily breaking out above its 50 Day MA.

With a neutral RSI, there looks to be more momentum in the near-term to try to re-test the $27.80 level of resistance, which would then lead them to the $28.52-level for their next test.

Their volumes the last few days have been creeping up above average for the year, which will also be something to keep an eye on.

Macy’s Inc. M Stock As A Long-Term Investment

Investors may find Macy’s Inc. stock’s valuation metrics appealing, with a P/E(ttm) of 9.94 & a P/B (mrq) of 2.66.

M stock had Quarterly Revenue Growth Y-o-Y of 35.1%.

Macy’s balance sheet will require some deeper digging though, as at first glance it has Total Cash (mrq) of $316M & Total Debt (mrq) of $6.53B.

Macy’s stock does offer a dividend yield of 0.55%, which appears to be very safe & could perhaps even rise down the line, as their Payout Ratio is a safe 5%.

98% of M stock’s share float is held by institutional investors.

Macy’s Inc. M Stock As A Short-Term Trade Using Options

Traders can use options in order to fend off from broader market volatility, while still capturing M stock’s upwards price momentum.

I am looking at the contracts with the 2/18 expiration date.

The $27 calls & $27.50 both look appealing, with the former having more liquidity & being in-the-money, making them more favorable.

The $29 puts have more open interest than the contracts that are closer to being at-the-money, as do the $30’s.

Look for Open Interest levels to increase week-over-week, as M stock does have weekly expirations.

Tying It All Together

All-in-all, there looks to be many interesting characteristics for M stock that traders & investors should be interested in.

Their valuation metrics should appeal to long-term oriented investors, while their current momentum & technicals set up should appeal to short-term traders.

M stock is worth taking a closer look at, regardless of your trading style.

*** I DO NOT OWN SHARES OF M STOCK ***

SAIA Inc. SAIA Stock Analysis

SAIA Inc. stock trades under the ticker SAIA & has shown recent bullishness amid widespread market volatility that traders & investors should take a closer look at.

SAIA stock closed at $295.83/share on 1/24/2022.

SAIA Inc. SAIA Stock’s Technicals Broken Down

SAIA Inc. SAIA Stock's Technical Performance Over The Last Year

SAIA Stock Price: $284.23 (at time I writing this on 1/25/22)

10 Day Moving Average: $281.07

50 Day Moving Average: $317.45

200 Day Moving Average: $259.41

RSI: 44.03

MACD: -10.338

SAIA stock completed a bullish MACD crossover yesterday, although on very limited trading volume.

This is somewhat to be expected though, given the broader market volatility that we are currently experiencing, as folks don’t know what move to make next just yet.

Their RSI is still in the over-sold range at 44, showing that there should be more upwards momentum for their price in the near-term.

Their next resistance test will be at the $310-311-price level, followed by the $315 level.

This looks to be able to add even more positive momentum, as breaking through these ranges will also break them out over their 50 Day MA.

SAIA Inc. SAIA Stock As A Long-Term Investment

Long-term oriented investors may find that SAIA stock fits their investing strategy.

SAIA stock’s P/E (ttm) is reasonable at 39.94, although their P/B is 7.56, which some investors may find a bit too rich.

Their Beta is 1.32, showing that they tend to move a bit more aggressively than the wider markets.

SAIA stock’s Quarterly Revenue Growth Y-o-Y is 28%, with 91.9% Quarterly Earnings Growth Y-o-Y.

Their balance sheet may require a bit closer examination, with Total Cash (mrq) of $121.7M & Total Debt (mrq) of $162.25M.

Despite not offering a dividend yield, SAIA stock enjoys a high degree of ownership from Institutional Investors.

SAIA Inc. SAIA Stock As A Short-Term Trade Opportunity Using Options

SAIA stock can be traded using options in order to take advantage of current momentum, while warding off broader market volatility.

I am looking at the contracts with the 2/18 expiration date.

The $280 & $290 calls look appealing, although there is much more favorable liquidity in the latter, despite them being out of the money.

The $290 & $300 puts are extremely illiquid, although more contracts could be written in the near future, as we did just have an expiration date pass by for the last batch of contracts.

Tying It All Together

All-in-all, there appear to be many interesting opportunities in SAIA stock.

Investors may like their valuation, as well as their balance sheet, although be discouraged by their lack of a dividend.

Traders will like their current momentum, although they may be discouraged by SAIA’s lack of liquidity in puts & in-the-money calls.

SAIA stock is worth taking a closer look at – regardless of your trading strategy.

*** I DO NOT OWN SHARES OF SAIA STOCK ***

Ultrapar Participacoes SA UGP Stock Analysis

Ultrapar Participacoes SA stock trades under the ticker UGP & has shown recent bullishness, despite broader market volatility, making it worth taking a closer look at.

UGP stock closed at $2.50/share on 1/20/2022.

Ultrapar Participacoes SA UGP Stock’s Technicals Broken Down

Ultrapar Participacoes SA UGP Stock's Technical Performance Over The Last Year

UGP Stock Price: $2.50

10 Day Moving Average: $2.39

50 Day Moving Average: $2.51

200 Day Moving Average: $3.10

RSI: 51.8

MACD: -0.036

UGP stock completed a bullish MACD crossover yesterday, on a 2% gap up to close just under their 50 Day Moving Average.

Yesterday’s price jump came as a result of above average trading volume.

Their RSI is neutral, signaling that once they make the bullish MA cross there will be additional momentum to push their price higher.

UGP’s next resistance test is at the $2.60-level.

Ultrapar Participacoes SA UGP Stock As A Long-Term Investment

Long-term oriented investors may find UGP’s valuation metrics appealing, with a P/E(ttm) of 18.58 & a P/B (mrq) of 1.69.

UGP has a 1.09 Beta, showing that it tends to move about in line with major market indexes.

They experienced 53.7% Quarterly Revenue Growth Y-o-Y.

UGP’s balance sheet is worth taking a finer comb through, as they have $5.74B in Total Cash (mrq) & $18.23B in Total Debt (mrq), which investors should want to know more about before buying.

UGP stock’s dividend yield is 4.76%, with a 77% Payout Ratio, which is something else for investors to be alert of, as their ratio is high.

Only 2% of all outstanding shares of UGP stock are held by institutional investors.

Ultrapar Participacoes SA UGP Stock As A Short-Term Trade Using Options

Short-term oriented traders can take advantage of UGP stock’s current momentum while hedging against volatility by using options.

I am looking at the contracts with the 2/18 expiration date.

The $2.50 & $5 call options look interesting, with low open interest on the former, but a decent amount of liquidity for the latter.

There is no open interest for their puts at the moment, which will likely change on Monday as today is an expiration date & investors will want them to hold as hedges against their investment during this volatile period.

Tying It All Together

All-in-all, UGP stock looks to have many appealing characteristics.

Their valuation metrics look appealing, as well as their ~5% dividend yield, although their balance sheet may be worth taking a closer peek into.

UGP’s current momentum looks set to continue in the near-term, creating profit opportunities for traders.

UGP stock is worth taking a closer look at for traders & investors alike!

*** I DO NOT OWN SHARES OF UGP STOCK ***

Harmony Gold Mining Co. HMY Stock Analysis

Harmony Gold Mining Co. stock trades under the ticker HMY & has recently shown bullish signals that traders & investors should take a closer look at.

HMY stock closed at $4.20/share on 1/19/2022, on a higher than average trading volume day.

Harmony Gold Mining Co. HYM Stock’s Technicals Broken Down

Harmony Gold Mining Co. HMY Stock's Technical Performance Over The Last Year

HMY Stock Price: $4.20

10 Day Moving Average: $3.73

50 Day Moving Average: $3.90

200 Day Moving Average: $4.03

RSI: 60.9

MACD: -0.013

HMY stock completed a bullish MACD crossover yesterday, while breaking out above all of its moving averages on above average trading volume.

With 4% between their 10 & 50 Day Moving Averages, there looks to be solid momentum in the near-term for HMY.

Their next test of resistance is the $4.27-4.33-price level.

Harmony Gold Mining Co. HMY Stock As A Long-Term Investment

Investors will like HMY stock’s valuation metrics, with a P/E (ttm) of 6.97 & a P/B (mrq) of 1.13.

HMY stock’s beta is 0.6, implying that it moves less aggressively than the broader market indexes.

They experienced 46.3% Quarterly Revenue Growth Y-o-Y.

HMY’s balance sheet will need some further looking into though, with $2.82B in Total Cash (mrq) & $3.62B in Total Debt (mrq).

HMY stock offers a 2.62% dividend yield, which looks to be safe with a 13.4% Payout Ratio.

32% of all HMY stock’s share float is held by institutional investors.

Harmony Gold Mining Co. HMY Stock As A Short-Term Trade Using Options

HMY stock has options that traders can use to hedge against market volatility, while still capturing their upward price momentum in the near-term.

I am looking at the contracts with the 2/18 expiration date.

The $4 & $5 calls both look appealing & very liquid, with solid levels of open interest & daily volume.

Although far less liquid, the $6 & $5 puts also look appealing.

With the limited open interest on puts vs. calls, the market is implying that HMY stock will continue to climb in the coming month.

Tying It All Together

Overall, there are many advantages to HMY stock over its competitors.

Investors will like their valuation metrics, although will want to take a closer look at their balance sheet.

Traders will like their liquid options market, as well as their current momentum.

HMY stock is worth taking a closer look at, regardless of your trading style.

*** I DO NOT OWN SHARES OF HMY STOCK ***

Arcosa, Inc. ACA Stock Analysis

Arcosa, Inc. stock trades under the ticker ACA & has recently shown signs of bullish momentum that traders & investors should take a closer look at.

ACA stock closed at $52.64/share on 1/18/2022.

Arcosa, Inc. ACA Stock’s Technicals Broken Down

Arcosa, Inc. ACA Stock's Technical Performance Over The Last Year

ACA Stock Price: $52.64

10 Day Moving Average: $52.05

50 Day Moving Average: $53.75

200 Day Moving Average: $55.28

RSI: 50.7

MACD: -0.423

Yesterday, ACA stock completed a bullish MACD crossover, with a neutral RSI & breaking above the 10 Day Moving Average.

Their 50 Day MA is ~2% above the current price level, which upon crossing would provide additional bullish momentum in the near-term.

ACA stock’s next resistance test will be at the $53.25-53.62-range.

Arcosa, Inc. ACA Stock As A Long-Term Investment

Investors will find ACA stock’s valuation metrics modest, with a P/E (ttm) of 38.2 & a P/B (mrq) of 1.37.

Their Quarterly Revenue Growth Y-o-Y is 14.1%.

ACA stock’s balance sheet does need a closer examination though, with Total Cash (mrq) of $66.1M & Total Debt (mrq) of $782.6M.

ACA stock offers a dividend that is 0.38%, that appears very safe with a Payout Ratio of 13.89%.

93.7% of ACA stock’s total share float is held by institutional investors.

Arcosa, Inc. ACA Stock As A Short-Term Trade Using Options

Arcosa, Inc. stock has options that traders can use in the short-term to profit off of their moves in either direction.

I am looking at the contracts with the 2/18 expiration date.

The $50 & $55 calls look interesting, although both are very illiquid with low levels of open interest.

The $55 puts look interesting as well, with there being no open interest on $60 put contracts yet.

As we just had an expiration day on Friday, I expect to see more contracts written for this date in the near-future.

Tying It All Together

All-in-all, there look to be many interesting advantages for ACA stock in the eyes of both traders & investors.

Investors will like their valuation & their small, but safe dividend yield.

Traders will like their near-term momentum, as ACA looks primed to continue climbing in the near-term, despite broader market volatility.

Overall, ACA stock is worth taking a closer look at, regardless of your trading style.

*** I DO NOT OWN SHARES OF ACA STOCK ***

Avis Budget Group, Inc CAR Stock Analysis

Avis Budget Group, Inc. stock trades under the ticker CAR & has shown recent bullishness that traders & investors should take a closer look at.

CAR closed at $195.31/share on 1/14/2022.

Avis Budget Group, Inc. CAR Stock’s Technicals Broken Down

Avis Budget Group, Inc. CAR Stock's Technical Performance Over The Last Year

CAR Stock Price: $195.31

10 Day Moving Average: $197.44

50 Day Moving Average: $243.08

200 Day Moving Average: $134.75

RSI: 37.9

MACD: -11.645

On Friday, CAR stock completed a bullish MACD crossover, on below average volume compared to the last year.

Their price is ~2% from their 10 Day Moving Average & ~25% below their 50 Day MA.

CAR stock’s RSI is still in oversold territory, which should help them establish a new price range & begin climbing again.

The $208-level will be an interesting test of resistance, as the broader market indexes are volatile.

Avis Budget Group, Inc. CAR Stock As A Long-Term Investment

CAR stock’s valuation metrics are interesting, with a modest P/E (ttm) of 20.59, however their P/B(mrq) is a bit rich, at 7.14.

They saw 95.6% Quarterly Revenue Growth Y-o-Y after suffering losses from COVID-19 measures the year prior.

CAR stock’s balance sheet is going to require a close look before deciding if it is an appropriate investment for you, as their Total Cash (mrq) is $886M, while they have $17.16B in Total Debt (mrq).

Avis Budget Group, Inc. does not pay a dividend & has a beta of 2.07, meaning that it tends to trade in more aggressive swings than the broader market.

Avis Budget Group, Inc. CAR Stock As A Short-Term Trade Using Options

Traders can use options to harness CAR stock’s momentum, while fighting off broader market volatility.

I am looking at the contracts with the 2/18 expiration date.

The $195 & $200 calls look interesting, although very illiquid with low open interest.

Given that there are multiple weeks of expirations in between though, I expect this to shift as other expiration dates pass.

The $210 & $220 puts also look interesting, with the same open interest issue I mentioned as the calls in the near-term.

Tying It All Together

All-in-all, traders & investors may find CAR stock an interesting addition to their portfolios.

I would be very mindful of their debt structures, especially going into a rising rates environment, but there looks to possibly still be some opportunity here.

It is worth taking a closer look at CAR stock.

*** I DO NOT OWN SHARES OF CAR STOCK ***