BRP Group Inc. BRP Stock Analysis

BRP Group Inc. stock trades under the ticker BRP & has shown recent bullishness that may interest traders & investors.

BRP stock is a member of the Insurance Brokers industry & closed at $35.61/share on 10/6/2021.

Breaking Down BRP Group Inc. BRP Stock’s Technicals

BRP Group Inc. BRP Stock Technical Performance For The Last Year

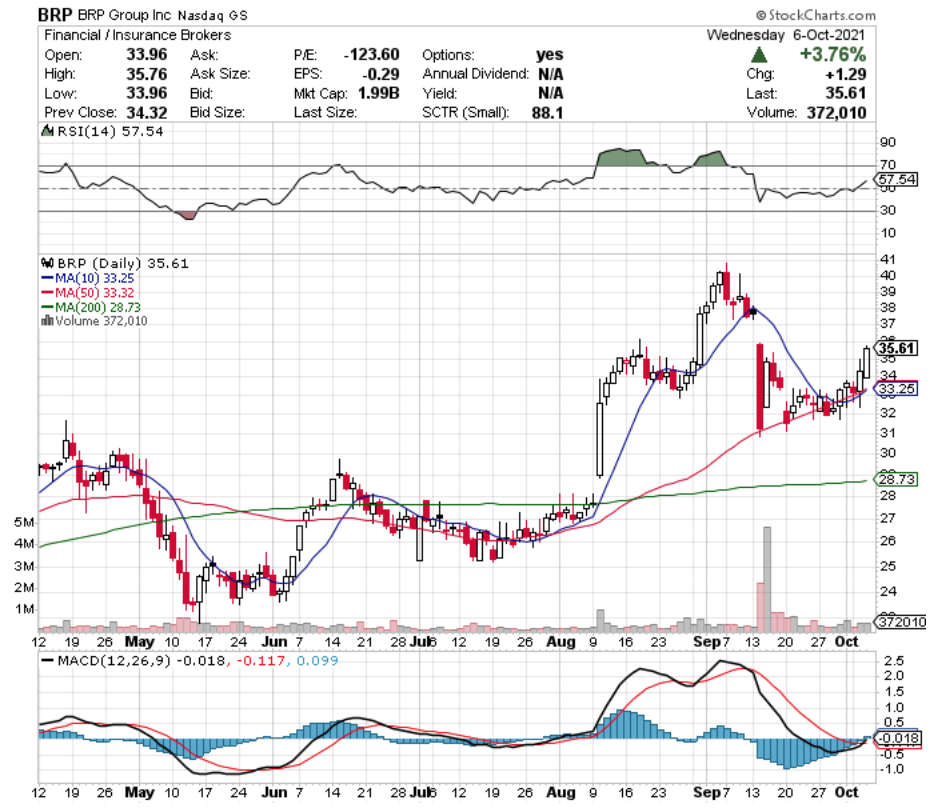
BRP Stock Price: $35.61

10 Day Moving-Average: $33.25

50 Day Moving-Average: $33.32

200 Day Moving-Average: $28.73

RSI: 57.5

MACD: -0.018

Yesterday, BRP stock completed a bullish MACD crossover, after crossing its 10 & 50 Day Moving-Averages bullishly in the prior days.

They look to have positive momentum that will continue driving the share price higher, with the next test being at $35.89.

BRP’s volume has been slightly above average recently, but in-line with the rest of the years trading.

The next level of tests will come at $37.32, which will likely not come until a new, higher range is established, as BRP’s RSI is approaching 60.

BRP Group Inc. BRP Stock As A Long-Term Investment

Long-term investors may be interested in BRP Group Inc.’s Quarterly Revenue Growth Y-o-Y of 133.5%.

BRP’s P/B is a bit rich at 9.71, and they do not offer a dividend.

Their balance sheet does not look as good as some of the other names we have published about recently, with Total Cash (mrq) of $224.48M & Total Debt (mrq) of $502.98M.

BRP Group Inc. BRP Stock As A Short-Term Trade Using Options

Short-term oriented traders can use options to take advantage of BRP’s strong momentum, while hedging against the current volatile broader market environment.

Due to low Open Interest, I am looking at the $30 & $35 call options with the 10/15 expiration date.

I am also looking at the $40 & $35 puts as a hedge for protection, in the event that market turbulence continues.

Tying It All Together

All-in-all, BRP stock has many advantages that traders & investors may want to further research.

Investors may like their Quarterly Growth Y-o-Y if it can sustain in the long run, and if they manage to pay down more debt faster than anticipated their balance sheet.

Short-term traders should be interested in their recent growth, particularly while the rest of the broader markets have floundered around in volatility.

BRP Group Inc.’s stock is worth taking a closer look at, regardless of your trading style & time frame.

*** I DO NOT OWN SHARES OF BRP STOCK ***

American Financial Group, Inc. AFG Stock

American Financial Group Inc. stock trades under the ticker AFG & is a member of the property-casualty insurance industry.

AFG stock closed at $131.48/share on 10/5/2021, after showing bullishness during a volatile past couple of weeks.

Breaking Down American Financial Group Inc. AFG Stock’s Technicals

American Financial Group Inc. AFG Stock Past Year's Technical Performance

AFG Stock Price: $131.48

10 Day Moving-Average: $128.20

50 Day Moving-Average: $129.03

200 Day Moving-Average: $107.23

RSI: 57.3

MACD: -0.229

Yesterday, AFG completed a bullish MACD crossover, while also breaking out above its 50 Day Moving-Average.

With an RSI of 57, there is still more room for AFG to continue climbing in the near-term, with added support coming from the 10 Day MA about to cross the 50 Day MA bullishly.

The next level AFG will test is $133.20.

American Financial Group Inc. AFG Stock As A Long-Term Investment

Long-term investors may like AFG stock for its valuation, with a P/E (ttm) of 9.16 & a P/B of 2.

With a Beta of 0.97, AFG should not move as aggressively as broader markets in times of volatility.

With Total Cash (mrq) of $3.39B & Total Debt (mrq) of $2.11B, AFG’s balance sheet also looks appealing.

American Financial Group Inc.’s stock pays a 1.53% Dividend Yield, which looks very safe as their Payout Ratio is 13.5%.

American Financial Group Inc. AFG Stock As A Short-Term Trade Using Options

AFG stock has options that traders can use to hedge off the market’s recent volatility, while still taking advantage of AFG’s positive momentum.

I am looking at the 10/15 expiration dated contracts, looking at the $130 & $131 calls.

These are not very liquid, with low Open Interest, but they are already in-the-money.

From a puts perspective, the $135 strike price looks safe, with the $131 being at-the-money & possibly breaking into the money if market volatility continues on the next few weeks, making them worth holding for a hedge.

Tying It All Together

Overall, American Financial Group Inc. stock has many opportunities for short-term traders & long-term investors.

In the near-term, they are enjoying bullish momentum that looks to continue, despite the broader market’s performance.

In the long-term, AFG’s valuation, debt levels & dividend yield all look appealing for investors.

Regardless of your trading style, AFG stock is worth taking a closer look at.

*** I DO NOT OWN SHARES OF AFG STOCK ***

Green Plains Inc. GPRE Stock Analysis

Green Plains Inc. stock trades under the ticker GPRE & is showing signs of technical strength that traders & investors may be interested in.

GPRE is a member of the specialty chemicals industry, and closed at $34.09/share on 10/4/2021.

Breaking Down Green Plains Inc. GPRE Stock’s Technicals

Green Plains Inc. GPRE Stock Technical Performance For The Last Year

GPRE Stock Price: $34.09

10 Day Moving-Average: $32.83

50 Day Moving-Average: $34.77

200 Day Moving-Average: $28.37

RSI: 50.6

MACD: -0.45

Despite a ~3% drop in price on a volatile trading day yesterday, GPRE still has many bullish characteristics in the near-term.

GPRE’s share price has broken the 50 Day Moving-Average bullishly & still has momentum to do so again, with a ~6% difference between the 50 & 10 Day MA.

With a near even RSI there is still more room to run as the share price is neither overbought nor oversold, and yesterday they completed a bullish MACD crossover.

Green Plains Inc. GPRE Stock As A Long-Term Investment

Investors may find Green Plains Inc.’s stock to be a good fit, especially with 86.7% Quarterly Revenue Growth (Y-o-Y).

GRPE does not have a trailing P/E, which may deter some investors, alongside their rich P/B of 2.07.

GPRE has Total Cash (mrq) of $496.9M & Total Debt (mrq) of $783.5M, and a Market Cap of $1.79B.

Green Plains Inc.’s stock does not offer a dividend to investors.

Green Plains Inc. GPRE Stock As A Short-Term Trade Using Options

Traders can take advantage of GPRE’s recent momentum by using options.

I am looking at the 10/15 expiration calls, with the $33 & $34 strike prices in the event that more volatility hits the market in the coming weeks.

I am also looking at the $35 & $36 puts with the same expiration date.

Tying It All Together

Overall, GPRE stock has many advantages that traders & investors may be interested in.

Their recent technical performance is something that short-term oriented traders should find appealing.

Long-term oriented investors may like their most recent quarterly revenue growth, as well as the exposure to specialty chemical stocks.

Regardless of your timeframe & trading style, Green Plains Inc. stock is worth taking a closer look at.

*** I DO NOT OWN SHARES OF GPRE STOCK ***

Alnylam Pharmaceuticals Inc. ALNY Stock

Alnylam Pharmaceuticals Inc. stock trades under the ticker ALNY & closed for trading at $192.68/share on 10/1/2021.

ALNY is in the biotechnology industry, and has shown recent strength making it worth taking a closer look at for traders & investors.

Alnylam Pharmaceuticals Inc. ALNY Stock Technical Performance

Alnylam Pharmaceuticals Inc ALNY Stock Technical Performance For The Last Year

ALNY Stock Price: $192.68

10 Day Moving-Average: $185.40

50 Day Moving-Average: $191.35

200 Day Moving-Average: $160.52

RSI: 53.7

MACD: -1.648

On Friday, ALNY completed a bullish MACD crossover, while also bullishly crossing their 10 & 50 Day Moving Averages.

They look to have more momentum to climb higher as the 10 Day is also about to cross the 50 Day MA as well.

With a neutral RSI, there looks to be more positive growth in store for ALNY stock in the near-term.

Alnylam Pharmaceuticals Inc. ALNY Stock As A Long-Term Investment

Long-term oriented investors may find ALNY appealing as an investment.

ALNY has $1.9B in Total Cash (mrq), with only $761M in Total Debt (mrq), which is good.

They also have 96% Institutional Investors, which some investors like.

ALNY does not offer a dividend.

Alnylam Pharmaceuticals Inc ALNY Stock As A Short-Term Trade Using Options

Short-term oriented traders may want to use options in order to take advantage of ALNY’s recent momentum, while hedging off recent market volatility.

I am looking at the $190 & $195 calls with the 10/15 expiration date.

For puts, I am looking at the $200 & $210 strike price contracts, even though they are relatively illiquid with low open interest.

Tying It All Together

All-in-all, ALNY stock looks to have many advantages that traders & investors will both like.

With their recent strength, there looks to be more bullishness in the near-term for ALNY stock.

Larger money managers like ALNY in the long-term as well, which some investors take as a sign of strength as well.

Overall, ALNY stock is worth taking a closer look at for traders & investors alike.

*** I DO NOT OWN SHARES OF ALNY STOCK ***

Paychex Inc. PAYX Stock Analysis

Paychex Inc. stock trades under the ticker PAYX & is a member of the software industry.

PAYX stock has shown recent bullishness that traders & investors alike may want to take a closer look at.

Breaking Down Paychex Inc. PAYX Stock’s Technical Performance

Paychex Inc PAYX Stock Technical Performance For The Last Year

PAYX Stock Price: $112.45

10 Day MOving-Average: $109.11

50 Day Moving-Average: $112.73

200 Day Moving-Average: $100.55

RSI: 56.5

MACD: -0.967

Paychex Inc.’s stock completed a bullish MACD crossover yesterday, on a ~4.3% gap up day.

With higher than average volume, the share price bullishly crossed both the 10 & 50 Day Moving-Averages.

With 3% difference between the 10 & 50 Day MA’s, there looks to be an additional bump in momentum in the coming days for PAYX.

With an RSI still in the 50’s, PAYX stock looks set to establish a new range in the coming days, with bullish momentum still behind it.

Paychex Inc. PAYX Stock As A Long-Term Investment

Long-term oriented investors may be interested in Paychex Inc.’s stock for a variety of factors.

PAYX’s P/E(ttm) is 35.77, with a P/B of 13.26, which is both modest for a software company, especially considering that they work in the employee payment space where there is always going to be demand.

PAYX has 12.5% Quarterly Revenue Growth Y-o-Y, and has a ~74% % Institutional Investors.

With Total Cash (mrq) of $1.03B & Total Debt (mrq) of only $926M, their balance sheet looks appealing for investors.

Add in a 2.34% Dividend Yield & they look even more appealing.

One area of concern though regarding the dividend is their 83% Payout Ratio, which is rather high.

Paychex Inc. PAYX Stock As A Short-Term Trade Using Options

Short-term oriented traders can use options to take advantage of PAYX’s current upward momentum, while hedging off current volatility risks.

I am looking at the $105 & $110 strike calls with the 10/15 expiration date.

The $110’s have more Open Interest & are currently in-the-money with a delta of 0.67 & gamma of 0.0602.

The sentiment behind PAYX is still rather bullish, with far less open interest on the puts for the same expiration date.

I am looking at the $120 & $115 puts, although they are far less liquid than the calls, but are a necessity while we are in this volatile period.

Tying It All Together

Overall, Paychex Inc.’s stock has a lot of great attributes that investors & traders will both like.

From a long-term perspective they offer decently valued software industry exposure, with a nice dividend yield & solid looking balance sheet.

In the near-term, they are still riding positive momentum after their 4%+ gap up yesterday & look to have more steam to continue pushing their share price higher.

PAYX stock is worth taking a closer look at, no matter your trading style & time frame.

*** I DO NOT OWN SHARES OF PAYX STOCK ***

Dollar Tree Inc. DLTR Stock Analysis

Dollar Tree Inc. stock trades under the ticker DLTR & operates a chain of discount merchandise stores.

DLTR stock closed at $100.51/share, after a 16.5% gap up day, with more bullish signals in the near-term future.

Breaking Down Dollar Tree Inc. DLTR Stock’s Technical Performance

Dollar Tree Inc. DLTR Stock Technical Performance Over The Last YEar

DLTR Stock Price: $100.51

10 Day Moving-Average: $88.16

50 Day Moving-Average: $95.49

200 Day Moving-Average: $104.44

RSI: 66.8

MACD: -1.691

Yesterday, DLTR had a bullish MACD crossover, while also crossing over both the 10 & 50 Day Moving-Averages.

While they are still ~4% below their 200 Day MA, there is still momentum to the upside that will help them maintain their current bullishness.

While DLTR stock’s RSI is trending towards overbought, this should subside as they begin to establish a new range.

With the current share price ~5% higher than the 50 Day Moving-Average, the 10 Day Moving-Average should be able to provide additional upwards pressure as it is ~7% away from bullishly crossing the 50 Day MA.

Dollar Tree Inc. DLTR Stock As A Long-Term Investment

Investors may find DLTR’s P/E(ttm) of 13.83 appealing, although their P/B is a bit rich at 2.81.

Yield seeking investors will be disappointed in their lack of a dividend, however there is a lot of bullishness among Institutional Investors, with a 93.5% holding percent.

DLTR has 1.00% Quarterly Revenue Growth Y-o-Y, which investors are beginning to expect more from with inflation concerns.

One area that sticks out to me that investors may not like is DLTR’s $720.8M in Total Cash (mrq) & $9.68B in Total Debt (mrq).

Dollar Tree Inc. DLTR Stock As A Short-Term Trade Using Options

Short-term traders may be interested in taking advantage of DLTR’s recent momentum, while hedging against recent volatility by using options.

I am looking at the 10/15 expiration date contracts, which will have more open interest as the weekly contracts begin to expire in between that time.

The $99 & $100 strike price calls look appealing, with the $105 & $110 puts to be used for hedging against more volatility.

While these contracts are not very liquid at the moment, week by week they should get more Open Interest, as the 10/1 contracts expire tomorrow & the next dated set expire a week from tomorrow.

Tying It All Together

Overall, DLTR stock looks to have many advantages that traders & investors may want to look closer into.

Investors may like their valuation metrics, as well as future growth potential in an iflationary environment.

Short-term traders will like their recent momentum & future growth potential as their technicals catch up with yesterday’s massive gap up.

Dollar Tree Inc.’s stock looks to be worth taking a closer look at, regardless of your trading style or timeframe.

*** I DO NOT OWN SHARES OF DLTR STOCK ***

CIT Group Inc. CIT Stock Analysis

CIT Group Inc. stock trades under the ticker CIT & is a member of the Specialty Finance Industry.

CIT stock closed at $53.60/share, after showing recent bullishness that traders should take interest in.

CIT Group Inc. CIT Stock’s Technical Performance Broken Down

CIT Group Inc. CIT Stock Technical Performance For The Last Year

CIT Stock Price: $53.60

10 Day Moving-Average: $51.39

50 Day Moving-Average: $51.70

200 Day Moving-Average: $48.16

RSI: 58.4

MACD: -0.077

Yesterday, CIT completed a bullish MACD crossover after completing bullish 10 & 50 Day Moving-Average crossovers the week prior.

CIT looks to have bullish momentum to continue pushing it higher, with its next test coming at the ~$54.66 level.

There looks to be another bump higher on the horizon as the 10 Day Moving Average is .6% below the 50 day, poised to break through it bullishly soon.

CIT Group Inc. CIT Stock As A Long-Term Investment

CIT stock has many attributes that investors should find appealing.

From a valuation perspective, their P/E(ttm) of 8.44 & P/B of 0.91 are very fair.

CIT’s Quarterly Revenue Growth (Y-o-Y) is 112%, and almost 96% of their shares are held by institutional investors (95.9%).

CIT has Total Cash (mrq) of $5.66B with Total Debt (mrq) of $6.14B, which is much better than most other companies.

Tying in their 2.62% Dividend Yield with a 23.4% Payout Ratio, and there looks to be a lot of great investment opportunity in CIT.

CIT Group Inc. CIT Stock As A Short-Term Trade Using Options

I am looking at CIT options, eyeing the 10/15 expiration date.

From the calls perspective, the $50 strike price looks good, being in-the-money & much more liquid than the $55 contracts; although the $55’s also look appealing if this momentum continues.

Overall sentiment on CIT stock looks bullish, as the Open Interest on the 10/15 puts is near nonexistent compared to the calls.

With that said, the $55 strike puts are currently looking like the best option.

Tying It All Together

Overall, CIT Group Inc. stock has many opportunities in the near & long-term.

In the near-term, momentum looks set to continue powering their share price higher over the coming weeks.

In the long-run, CIT stock’s fundamentals are appealing, and their Dividend Yield looks very safe.

Traders & investors alike will both find CIT Group Inc. stock worth taking a closer look at to see if they are a good fit for their trading strategy.

*** I DO NOT OWN SHARES OF CIT STOCK ***

Carver Bancorp Inc. CARV Stock Analysis

Carver Bancorp, Inc. stock trades under the ticker CARV & has shown recent bullishness that traders & investors may want to take a closer look at.

CARV stock closed at $17.63/share on 9/27/2021, with signals pointing to more gains to come in the near-future.

Carver Bancorp, Inc. CARV Stock Technical Performance Breakdown

Carver Bancorp Inc. CARV Stock Technical Performance Over The Last Year

CARV Stock Price: $17.63

10 Day Moving-Average: $14.86

50 Day Moving-Average: $16.32

200 Day Moving-Average: $11.33

RSI: 58.2

MACD: -0.434

Completing a bullish MACD & 50 Day Moving-Average crossover yesterday, CARV stock looks poised to continue climbing.

With the 10 Day MA ~9% below the 50 Day, there should be more upward momentum to help CARV continue climbing, while it begins to establish a new range.

CARV stock’s RSI does not show signs of being overbought yet, which also helps in the near-term.

Carver Bancorp, Inc. CARV Stock As A Long-Term Investment

Carver Bancorp Inc. stock may be appealing to some investors who are looking to gain micro-cap exposure to the banking industry.

CARV has a modest P/B at 1.69, with Quarterly Revenue Growth (Y-o-Y) of 16.7%.

CARV has only 19.2% Institutional Ownership, which makes sense given their micro cap status & lack of a dividend to help reduce risk.

One area that looks great for CARV is their $78.73M in Total Cash (mrq) vs. their $50.3M in Total Debt (mrq).

Carver Bancorp, Inc. Stock As A Short-Term Trade

CARV stock does not have options for traders to use, so any momentum will need to be caught by owning common shares.

Their next test would be at ~$18.83, followed by $20.39/share.

For hedging purposes, traders may think to establish a puts position in IWC, which is a microcap stock etf.

Tying It All Together

Overall, Carver Bancorp Inc. stock has many advantages that traders & investors may want to capitalize on.

CARV stock has positive momentum despite broader market volatility, and because of its micro-cap status may get extra momentum from FOMO traders piling in after recent big days.

Investors looking for micro-cap bank exposure may like CARV’s cash & debt levels.

CARV stock is worth taking a closer look at, regardless of your trading style & timeframes.

*** I DO NOT OWN SHARES OF CARV STOCK ***

Concrete Pumping Holdings, Inc. BBCP Stock

Concrete Pumping Holdings Inc. stock trades under the ticker BBCP & is a member of the building materials industry.

BBCP stock closed up +3.05% at $8.81/share on 9/24/2021, after showing signs of future bullishness.

Concrete Pumping Holdings Inc. BBCP Stock Technical Performance Broken Down

BBCP Stock Price: $8.81

10 Day Moving-Average: $8.21

50 Day Moving-Average: $8.43

200 Day Moving-Average: $7.16

RSI: 61.7

MACD: -0.02

After completing a bullish MACD crossover on Friday, BBCP stock looks poised to continue climbing higher with positive momentum.

With their price bullishly crossing both the 10 & 50 Day Moving-Averages, with the 10 Day breaking above the 50 day in ~2.5% for added momentum.

BBCP’s RSI is a little bit overbought at 61.7, but as the stock establishes a new range this will smooth out, also encouraging more bullish price movement.

Concrete Pumping Holdings Inc. BBCP Stock As A Long-Term Investment

Investors focused on the long-term may find BBCP stock appealing.

Concrete Pumping Holdings Inc.’s stock has a modest P/E (ttm) of 6.38, as well as a P/B of 1.75.

59% of shares outstanding are held by institutional investors, which some investors use a sign of confidence in the stock’s performance.

BBCP’s Quarterly Revenue Growth (Y-o-Y) is 4.7%.

An area of caution is that they do not offer a dividend yield, and do have more Total Debt (mrq) than Total Cash (mrq), at $369.1M vs. $20.2M.

Concrete Pumping Holdings Inc. BBCP Stock As A Short-Term Trade Using Options

BBCP stock has options that traders can use to take advantage of short-term momentum, while also hedging off the risks associated with the volatile market environment.

I am looking at the $7.50 & $5 call options with the 10/15 expiration date.

The $10 & $12.50 puts also look appealing at the same expiration date.

These options all have low Open Interest though, meaning that they are not going to be very liquid when trying to get rid of them, making it more & more imperative to purchase in-the-money contracts.

Tying It All Together

Concrete Pumping Holdings Inc. stock has many short & long-term benefits that traders may want to research further.

In the near-term they offer strong momentum to the upside, as the price attempts to break above the $9-level.

Longer-term focused investors may be interested in their low valuation metrics, as well as their exposure to the construction materials industry.

Overall, BBCP stock is worth taking a closer look at by traders & investors of all styles.

*** I DO NOT OWN SHARES OF BBCP STOCK ***

Conn’s Inc. CONN Stock Analysis

Conn’s Inc. stock trades under the ticker CONN & is in the specialty retailers industry.

CONN stock closed at $24.09/share on 9/22/2021, after showing recent bullishness.

Breaking Down Conn’s Inc. CONN Stock’s Technical Performance

Conn's Inc. CONN Stock Technical Performance For The Last Year

CONN Stock Price: $24.09

10 Day Moving-Average: $23.31

50 Day Moving-Average: $23.41

200 Day Moving-Average: $19.74

RSI: 53.6

MACD: -0.033

CONN stock completed both a bullish MACD crossover & a bullish 10 & 50 Day Moving Average crossover yesterday.

They look to have positive momentum to push them forward towards their next test at ~$24.50, then $24.85.

With a slightly overbought RSI, CONN may present some good entry points for both short & long-term traders in the coming days while it establishes a new range.

Conn’s Inc. CONN Stock As A Long-Term Investment

Investors will find CONN’s P/E(ttm) of 5.99 & their P/B of 1.06 to be appealing.

As a small cap stock with a ~$682M market cap, CONN has a lower than average amount of institutional investors (55%).

This also is likely due to their Beta of 2.5 & their lack of a dividend yield.

CONN’s has met (1) or beat (4) their past 5 earnings estimates, with a 13% growth in revenue Y-o-Y.

One area of concern is their Debt/Equity (mrq) at 129.6, which may be considered high for many investors’ taste.

Conn’s Inc. CONN Stock As A Short-Term Trade Using Options

Conn’s Inc. stock has options that traders can use to harness their recent momentum, while also providing hedges against broader market volatility.

I am looking at the $24 & $25 calls with the 10/15 expiration date.

There is less open interest on the puts for the same expiration date, showing that the market still expects bullish performance from CONN in the coming weeks.

However, I am also looking at the $26 & $25 puts as well as a hedge in this volatile environment.

Tying It All Together

Overall, CONN stock looks to have many attributes that traders of all time frames may find appealing.

Short-term oriented traders will like their current momentum, while longer term investors will like their low valuation compared to other peers.

Conn’s Inc. is worth taking a closer look at for a profit opportunity.

*** I DO NOT OWN SHARES OF CONN STOCK ***