Ekso Bionics Holdings Inc EKSO Stock

Ekso Bionics Holdings Inc. stock trades under the ticker EKSO & developes exoskeleton technologies.

EKSO stock closed at $4.94/share on 9/21/2021, after displaying signs of bullishness.

Ekso Bionics Holdings Inc. EKSO Stock Technical Performance

Ekso Bionics Holdings Inc. EKSO Stock Technical Performance For The Last Year

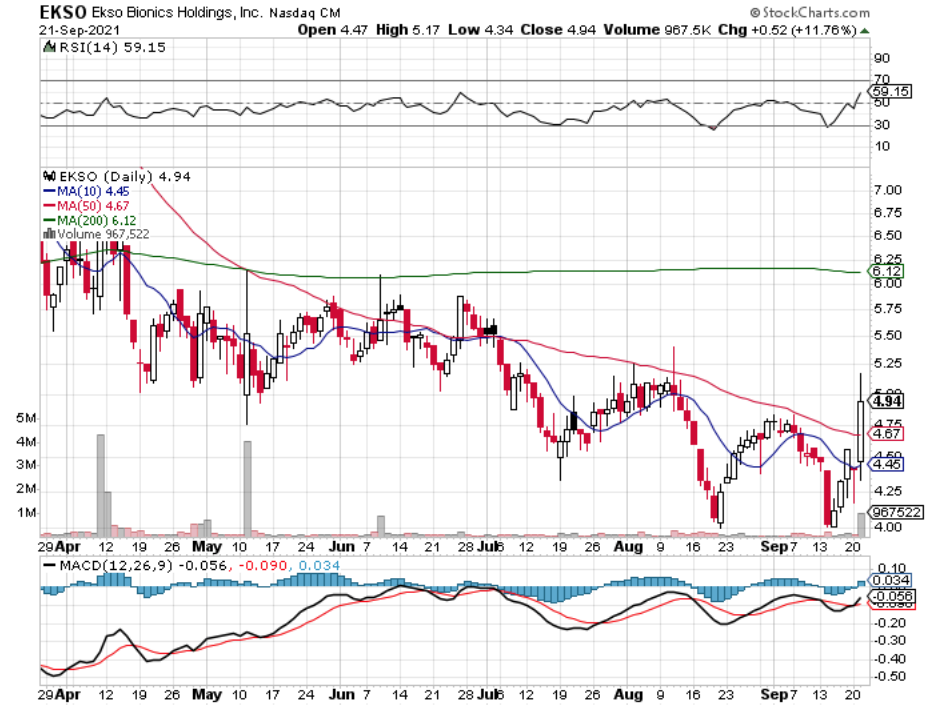
EKSO Stock Price:$4.94

10 Day Moving-Average: $4.45

50 Day Moving-Average: $4.67

200 Day Moving-Average: $6.12

RSI: 59.2

MACD: -0.056

EKSO stock has been rallying after a decline in early September, completing a bullish MACD crossover yesterday.

EKSO also bullishly crossed its 10 & 50 Day Moving-Averages yesterday.

Despite still being far below their 200 Day MA, EKSO still looks poised to continue climbing with their current momentum.

With an RSI at 59.2, there may be some temporary dips during the climb that traders can buy in at a better price on.

Ekso Bionics Holdings Inc EKSO Stock As A Long-Term Investment

EKSO stock may be appealing to investors who are looking for exposure to the medical equipment industry.

While they do not have a P/E (ttm), their P/B of 1.44 is modest.

There is no dividend yield paid to holders of the stock, which between that & their micro-cap status attributes to their low ~17% Institutional Owners.

One area of particular appeal is EKSO’s Total Cash (mrq) at $45.94M, while only have a Total Debt (mrq) of $2.5M.

Ekso Bionics Holdings Inc. EKSO Stock As A Short-Term Trade Using Options

Options traders can capitalize on EKSO’s momentum while also mitigating their risks in this volatile market environment.

I am looking at the $2.50 & $5 strike price calls, with the 10/15 expiration.

The Delta on the $2.50’s is 0.98, making them particularly appealing.

From the puts perspective, the $7.50 & $5 puts look the best to use as a hedge, with the $7.50’s having a delta of -0.77

Tying It All Together

Ekso Bionics Holdings Inc. stock has many attributes that long & short-term traders are sure to like.

Their current momentum looks set to carry them higher, with $5.50 being the next major test.

Investors may like their debt & cash levels, as well as their healthcare equipment industry exposure.

Short-term traders will like their momentum, especially in a market that is as volatile as the last few days have been.

Overall, EKSO is worth taking a closer look at, no matter your trading style or timeframe.

*** I DO NOT OWN SHARES OF EKSO STOCK ***

ViaSat Inc. VSAT Stock Analysis

ViaSat Inc. stock trades under the ticker VSAT & is a Telecom Technologies & Services company.

VSAT stock has recently shown technical strength despite overall market volatility, making it worth taking a closer look at by traders & investors.

Breaking Down ViaSat Inc. VSAT Stock’s Technical Performance

ViaSat Inc. VSAT Stock Technical Performance For The Last Year

VSAT Stock Price: $52.03

10 Day Moving-Average: $49.86

50 Day Moving-Average: $50.80

200 Day Moving-Average: $47.95

RSI: 55.2

MACD: -.284

Yesterday, ViaSat stock closed up over 2% on the day, while the major indexes were negative roughly the same amount.

In doing so, they completed a bullish MACD crossover, and their share price bullishly broke out over both the 50 & 10 Day Moving-Averages.

Their volume has been above average for the year over the last couple of weeks, signaling more conviction behind their recent bullishness by investors & traders.

VSAT looks set to continue climbing higher, with the next major test at about the $53.36 level.

ViaSat Inc. VSAT Stock As A Long-Term Investment

ViaSat Inc. stock has many attributes that longer-term oriented investors may be interested in.

VSAT’s P/B is 1.42, which is modest, despite having a P/E(ttm) of 103.8.

Their Quarterly Revenue Growth (YoY) is 25% and their % Institutional Shareholders is 87%.

VSAT does not offer a dividend, which may be problematic to some investors, but they do have many attributes that make them worth looking at for Telecom exposure in a long-term oriented portfolio.

ViaSat Inc VSAT Stock As A Short-Term Trade Using Options

Traders who are looking to take advantage of VSAT’s short-term momentum can use options to profit off of their performance.

The $50 & $55 calls with the 10/15 Exp. are worth looking into, although they are relatively illiquid with Open Interest only in the 100’s.

The Open Interest on VSAT puts is also very low, although with the rise in market volatility recently more contracts may be written as investors seek to sell shares & hedge their long positions.

Tying It All Together

VSAT looks appealing both in the near-term & long-term, no matter what your trading style & timeframes are.

They have many appealing characteristics in the near-term, where they have plenty of good momentum to continue climbing higher in price.

Long-term investors may also like their statistics & attributes as an investment.

Overall, VSAT is worth taking a closer look at for traders & investors alike.

*** I DO NOT OWN SHARES OF VSAT STOCK ***

Alector Inc. ALEC Stock Analysis

Alector Inc. is a biopharmaceutical company that trades under the ticker ALEC.

ALEC stock has recently shown great technical strength, closing at $26.45/share on 9/17/21.

Alector Inc. ALEC Stock Technical Performance Broken Down

Alector Inc. ALEC Stock Technical Performance For The Last Year

ALEC Stock Price: $26.81

10 Day Moving-Average: $24.42

50 Day Moving-Average: $27.97

200 Day Moving-Average: $20.87

RSI: 54.2

MACD: -0.649

After yesterday’s Bullish MACD crossover, ALEC looks to have more room to run with positive momentum in the near-term.

Although the broader market is not looking stable at the moment, ALEC stock has gone up almost every day of September, while maintaining a relatively even RSI.

While their share price is 4% below the 50 Day MA, there looks to be positive momentum to push ALEC stock price higher, bringing the 10 Day MA higher with it.

Alector Inc. ALEC Stock As A Long-Term Investment Opportunity

Alector Inc. looks to have some positive attributes that long-term focused investors may want to take advantage of.

ALEC’s Total Cash (mrq)is $319.6M, while only having $49.6M in Total Debt (mrq).

They also have a 78.8% % Institutional Ownership rate, showing that larger investors are fans of their stock.

They do not offer a Dividend Yield, and do not have a positive P/E (ttm).

However, some investors may be interested in their high cash/low debt levels & use ALEC stock to get exposure to biopharmaceutical companies.

Alector Inc. ALEC Stock As A Short-Term Trade Opportunity With Options

ALEC stock looks set to carry their positive momentum higher in the near-term, so I am looking at their 10/15 expiration dated options.

From the calls perspective, the $25 & $30 strike prices look appealing, with $25 being in-the-money already.

Friday was the expiration date for their September options, so expect to see more Open Interest coming in the coming days as more contracts are written.

From a puts perspective, the $35 & $30 puts look appealing, with notably lower Open Interest, showing bullishness from market participants.

Tying It All Together

All-in-all ALEC stock looks to have many advantages that are worth taking a closer look at.

Longer-term focused investors will like their low debt/high cash levels, as well as their industry exposure.

Short-term traders can still benefit from their current momentum, while also being able to profit from the current volatility that looks set to hit markets this week.

Overall, Alector Inc. stock is worth taking a closer look at, no matter your trading style & timeframe.

*** I DO NOT OWN SHARES OF ALEC STOCK ***

Autozone Inc. AZO Stock Analysis

Autozone Inc. stock trades under the ticker AZO & has recently shown technical strength that traders may want to take a closer look at.

AZO stock closed at $1,596/share on 9/15/21, after completing a bullish MACD crossover.

Autozone Inc. AZO Stock’s Technical Performance

Autozone Inc. AZO Stock's Technical Performance For The Last Year

AZO Stock Price: $1,596.72

10 Day Moving-Average:$1,549.66

50 Day Moving-Average: $1,594.55

200 Day Moving-Average: $1,390.21

RSI: 56

MACD: -9.5

AZO stock looks set to break out higher, completing a bullish MACD crossover yesterday, while also closing above both the 10 Day & 50 Day Moving-Averages.

With only 3% between their 10 Day & 50 Day MA’s, there looks to be more momentum coming in the coming days as well.

With an RSI of 56, there is still further room for Autozone’s stock to continue climbing.

The next tests should be at ~$1,600 & $1,622/share.

Autozone Inc. AZO Stock As A Long-Term Investment

AZO stock’s P/E (ttm) looks modest at 17, with no posted P/B.

Autozone’s stock does not offer a dividend to investors.

Their Debt & Cash levels are something that investors want to keep an eye on.

AZO’s Total Cash (mrq) is only $1.03B, while their Total Debt (mrq) is $8.12B.

Overall, investors may be interested in further reviewing AZO as an investment opportunity based on their portfolio needs.

Trading Autozone AZO Stock Options In The Short-Term

Short-term focused traders who wish to take advantage of AZO’s momentum may be interested in the 10/15 expiration options.

I am looking at the $1,600 calls & $1,610 calls, with $1,620 & $1,630 puts.

The Open Interest on these is currently low, which should increase as more of the weekly expiration dated options expire.

Tying It All Together

Autozone’s stock looks interesting for long & short-term traders alike.

From a long-term perspective they have a healthy P/E (ttm) which investors like.

From a short-term perspective AZO looks primed to continue climbing with their existing momentum.

All-in-all AZO stock is worth taking a look at for traders & investors of all types!

*** I DO NOT OWN SHARES OF AZO STOCK ***

SecureWorks Corp. SCWX Stock Analysis

SecureWorks Corp. stock trades under the ticker SCWX & works in the information security industry.

Closing at $20.55/share on 9/13/2021, SCWX stock has recently shown technical strength that traders & investors should be interested in further examining.

SecureWorks Corp. SCWX Stock Technical Analysis

SecureWorks Corp. SCWX Stock Technical Performance For The Last Year

SCWX Stock Price: $20.55

10 Day Moving-Average: $19.46

50 Day Moving-Average: $20.20

200 Day Moving-Average: $16.08

RSI: 56.1

MACD: -0.09

SCWX share-price bullishly crossed their 50 & 10 Day Moving-Averages yesterday, with added momentum to come when the 10 Day MA crosses the 50 Day.

With <4% difference between the two, the bullish continuation of price movement should make that cross occur within the coming days.

SCWX’s volume has been above average for the last year, although still far lower than when it was at its greatest in June & July of 2021.

With an RSI at 56 & a bullish MACD crossover yesterday, SCWX’s stock price looks poised to continue to run.

SecureWorks Corp. SCWX Stock As A Long-Term Investment

SecureWorks Corp.’s stock has many interesting advantages that investors may be interested in in the long-term.

Most-notably to me is their Total Cash (mrq) at $196.96M while their Total Debt (mrq) is only $26.27M, for a Total Debt/Equity (mrq) 3.99.

SCWX does not offer a dividend yield, nor do they have a P/E (ttm), which may be off-putting to some investors.

They do have a 68% % Institutional Shareholders though, showing that many larger investors are involved in SCWX.

SecureWorks Corp. SCWX Stock As A Short-Term Trade Using Options

SCWX looks to have momentum to continue climbing forward in the near-term, so I am looking at their calls & puts with the 10/15 expiration date.

I am looking at the $20 & $22.50 calls, which I expect to gather more open interest after the September contracts expire on Friday.

The $25 & $22.50 puts are also appealing as a hedge opportunity, although they are even more illiquid, with very minimal Open Interest.

Tying It All Together

SecureWorks Corp. SCWX stock looks to have advantages that long-term & short-term traders can both benefit from.

In the near-term, their positive momentum & technical strength look positive to spur more growth for traders to take advantage of.

In the long-term, their debt & cash levels look great & are a sign of stability for investors.

Overall, SCWX stock is worth taking a closer look at for traders & investors of all time frames.

*** I DO NOT OWN SHARES OF SCWX STOCK ***

Oxbridge RE Holdings Limited OXBR Stock

Oxbridge RE Holdings Limited stock is in the reinsurance industry, trading under the ticker OXBR.

OXBR stock closed at $3.36/share on 9/10/21, after showing some near-term bullishness.

Oxbrigde RE Holdings Limited OXBR Stock Technical Analysis

Oxbridge RE Holdings Limited OXBR Stock Technical Performance For The Last Year

OXBR Stock Price: $3.36

10 Day Moving-Average: $3.28

50 Day Moving-Average: $3.42

200 Day Moving-Average: $2.71

RSI: 49.9

MACD: -0.038

Completing a bullish MACD crossover yesterday, OXBR stock looks to have positive momentum moving forward.

Their price has crossed the 10 Day MA bullishly & is <2% away from crossing over the 50 Day Moving-Average.

With their RSI just below 50, there looks to be more room to run in the near-term for OXBR’s share price.

Volume has been light since July, but their overall sentiment still appears bullish.

Oxbridge RE Holdings Limited OXBR Stock As A Long-Term Investment

OXBR’s P/E(ttm) is 33.6, and their P/B is 2.26.

Their book value looks fair given they are a small company, not requiring much to operate.

OXBR does not offer a dividend, and has limited Institutional Investors (<4%).

However, OXBR looks phenomenal with Total Cash (mrq) of $3.59M & Total Debt (mrq) at $395K.

Oxbridge RE Holdings Limited OXBR Stock As A Short-Term Trade

Oxbridge RE Holdings Limited’s stock looks to still have positive momentum.

Their price will be testing the 50 Day Moving-Average & when they do cross it their 10 Day MA will be closely behind, adding additional bullishness.

Their volume being so low is something to be conscientious of, but likely will not be a problem.

Tying It All Together

OXBR stock looks to have opportunities for both long-term investors & short-term traders.

While they do not have options, traders can still take advantage of their bullish price movements using common shares.

Long-term investors may be interested in their lack of debt & fair valuation figures, whereas short-term traders will be interested in their bullish momentum.

I will be looking at a making a short-to-medium-term trade, and perhaps hold some shares as a long-term investment, pending further research.

All-in-all, OXBR stock looks like something that deserves some closer research, no matter what your trading style is.

*** I DO NOT OWN SHARES OF OXBR STOCK ***

Analog Devices Inc. ADI Stock Analysis

Analog Devices, Inc. stock specializes in the design & manufacturing of integrated circuits; trading under the ticker ADI.

ADI stock has recently shown strong technical performance, making it worth taking a closer look at for a trade & investment opportunity.

Analog Devices Inc. ADI Stock Technical Performance

Analog Devices Inc. ADI Stock Technical Performance Over The Last Year

ADI Stock Price: $168.81

10 Day Moving-Average: $164.57

50 Day Moving-Average: $165.82

200 Day Moving-Average: $156.03

RSI: 56.95

MACD: -0.505

Yesterday, ADI stock completed a bullish MACD crossover, while their price broke out above both the 10 Day & 50 Day Moving-Averages.

ADI’s volume in the past few weeks is above average for the rest of the year, with more positive momentum set to come from the crossing of the 10 Day MA & 50 Day MA.

I will be watching the $169.63 level, as if they break above that the price should continue climbing until it tests $172.16.

With an RSI still below 60 traders will still be encouraged to buy, as there is still room to climb until the stock is considered overbought.

Analog Devices Inc ADI Stock As A Long-Term Investment

ADI stock’s P/E(ttm) is 36.9, which some investors may think to be a bit high, and their P/B is 7.4.

Analog Devices Inc. stock offers a 1.64% Dividend Yield, that looks stable with a Payout Ratio of 57%.

While that Payout Ratio is a bit high (typically <50% is ideal), the yield looks to be safe.

Institutional Investors are quite fond of ADI stock & compared to many other stocks we look at their Debt vs. Cash levels are ok, although they still have less Total Cash (mrq) vs. Total Debt (mrq) ($1.48B vs. $5.33B).

Analog Devices Inc. ADI Stock As A Short-Term Trade With Options

Short-term traders may be interested in ADI’s recent momentum.

I am looking at the 10/15 expiration date, with my eyes on the $165 & $170 strike price on the call options.

While the $170 calls are out-of-the-money, there is ~2X the open interest, making them very liquid compared to the $165’s.

There seems to be more bullish sentiment than bearish for ADI stock, as the open interest on the puts is much less, even for the in-the-money options (most likely being used as hedges for long positions.)

Tying It All Together

Overall, there seem to be a lot of opportunities for ADI stock that investors & traders alike can take advantage of.

From the long-term perspective, Analog Devices Inc. stock looks to be healthy, with a small, but safe dividend for investors to collect.

In the near-term, there looks to be momentum that can continue pushing ADI’s share price higher.

ADI stock is worth taking a closer look at, no matter what your time horizon is in the markets.

*** I DO NOT OWN SHARES OF ADI STOCK ***

Suburban Propane Partners LP SPH Stock

Suburban Propane Partners LP stock trades under the ticker SPH & closed at $15.33/share on 9/8/2021.

SPH stock has shown bullish signals recently, most notably a bullish MACD crossover yesterday, making it worth taking a closer look at.

Suburban Propane Partners LP SPH Stock Technical Performance

Suburban Propane Partners LP SPH Stock Technical Performance Over The Last Year

SPH Stock Price: $15.33

10 Day Moving-Average: $15.28

50 Day Moving-Average: $15.39

200 Day Moving-Average: $14.71

RSI: 49.10

MACD: -0.03

SPH’s share price recently broke above the 10 Day Moving-Average, and is ripe to bullishly cross through their 50 Day Moving-Average as well, providing more upside momentum.

SPH stock’s RSI is currently neutral at 49, as the stock has recently established a new price range after falling in early/mid August.

Their Volume has been a bit below average in the past month compared to the rest of the previous year, but that is somewhat to be expected given that we are at the market top.

Suburban Propane Partners LP SPH Stock As A Long-Term Investment

Long-term oriented investors may find Suburban Propane Partners LP stock’s Dividend Yield of 7.94% appealing, although their Payout Ratio is a bit high at 77.9%.

Their Trailing P/E of 9.95 is modest, with a P/B of 2.11.

One particular area of concern though is their Debt/Equity (mrq) at 279.4, with $6M in Total Cash (mrq) & $1.27B in Total Debt (mrq).

SPH stock may fit the risk profile for some investors though, especially those with an appetite for Dividend Yields.

Suburban Propane Partners LP SPH Stock As A Short-Term Trade

SPH stock looks primed for strength in the near-term that traders may wish to take advantage of.

They currently have upward momentum, despite falling in early-mid August.

From an options perspective, I am interested in the calls that are currently in-the-money, eyeing the 10/15 expiration date.

The $15 & $12.50 strike price calls are relatively illiquid, but offer some cushion in the event of a market correction while the major indexes hover near all-time highs.

The $20, $17.50 & $15 puts are all appealing, although they have very low open interest.

Once the most recent batch of contracts expire I expect there to be open interest for all of the SPH options, which may find more appealing prices for traders to take advantage of.

Tying It All Together

Overall, Suburban Propane Partners LP stock looks to have advantages for traders of all time frames to take advantage of.

SPH stock’s dividend offers a solid yield that longer-term oriented investors may like, while their recent momentum can provide gains for short-term & options traders as well.

Due to these factors, SPH stock is worth taking a closer look at for traders & investors alike.

*** I DO NOT OWN SHARES OF SPH STOCK ***

Quest Resource Holding Corp QRHC Stock

Quest Resource Holding Corp. works in the recycling & disposal services industry, trading under the ticker QRHC.

QRHC stock closed at $6.33/share on 8/18/2021, after a 9% rise on the day.

Quest Resource Holding Corp. QRHC Stock’s Technicals

Quest Resource Holding Corp. QRHC Stock's Technical Performance Over The Last Year

QRHC Stock Price: $6.33

10 Day Moving-Average: $5.94

50 Day Moving-Average: $6.34

200 Day Moving-Average: $3.91

RSI: 53.4

MACD: -0.099

After completing a bullish MACD crossover yesterday, QRHC looks set to test breaking through its 50 Day Moving-Average.

Their RSI of 53 is average, with 50 being completely neutral, trading on fairly average volume levels compared to the previous year.

QRHC stock looks to have more positive momentum behind it, with a 6.5% spread between their 10 & 50 Day MA’s, which should help power their share price higher.

While they’re currently testing the 50 Day MA, the next stop to test on the way up will be the $6.95-7 price range.

Quest Resource Holding Corp. QRHC Stock As A Long-Term Investment

QRHC stock’s P/E (ttm) is 44.6, with a P/B of 1.56. These levels are not unattractive in terms of overvaluation for a longer-term investment.

Their Debt/Equity (mrq) is also better than many of the other stocks we have looked at on here recently, coming in at 22.98, with $10.5M in Total Cash (mrq) & $16.32M in Total Debt (mrq).

Quest Resource Holding Corp.’s stock does not offer a dividend yield & is considered a micro-cap stock with a total market cap of $108.6M.

Due to these factors, only 44% of shares are held by Institutions.

Trading Quest Resource Holding Corp. QRHC Options In The Short-Term

From a short-term perspective, QRHC options look appealing.

I am looking at the 9/17 expiration contracts, which I think will gain in Open Interest after tomorrow’s expiration.

The $5 & $7.50 calls look appealing, with the $5’s being in-the-money & the $7.50’s being the next level above them.

From the puts perspective, there is very little open interest still, but once there is I will be eyeing the $7.50 strike price.

Tying It All Together

All-in-all QRHC stock looks to offer both long-term investors & short-term traders profit opportunities.

Their positive momentum in the near-term looks set to continue pushing their share price upwards.

In the long-run they have some appealing metrics from a valuation perspective, and may get additional price benefit from being a micro-cap.

This is because many stocks of that size go under the radar or are too small for some traders to invest in, so as they climb higher more people learn of them & pile in, forcing the price higher.

Overall, it seems that QRHC is worth taking a closer look at for both short & long-term traders.

*** I DO NOT OWN SHARES OF QRHC STOCK ***

Consol Energy Inc CEIX Stock Analysis

Consol Energy Inc. stock produces bituminous coal & trades under the ticker CEIX.

CEIX stock closed at $21.60/share on 8/17/2021, after a strong quarter+ of growth over the last 4 months.

Consol Energy Inc CEIX Stock’s Technical Performance

Consol Energy Inc CEIX Stock Technical Performance Over The Last Year

CEIX Stock Price: $21.60

10 Day Moving-Average: $22.22

50 Day Moving-Average: $19.26

200 Day Moving-Average: $11.75

RSI: 55

MACD: 1.08

Although CEIX had a bearish MACD crossover yesterday, their RSI is still in somewhat overbought territory, which suggests such cross was inevitable.

Their recent volume is slightly elevated from the year’s average, showing that investors are still interested in CEIX.

In the pre-market it appears that they’re going to open at the 10 Day MA, supporting higher growth until they re-test the $23.23 range.

Consol Energy Inc CEIX Stock As A Long-Term Investment

Consol Energy Inc. trades at a P/E(ttm) of 20.6 & a P/B of 1.3, both of which are reasonable levels.

81% of CEIX stock is held by institutions, which is another sign of safety.

One area of concern is their debt vs. cash situation, as their Total Debt/Equity (mrq) is 122, a bit high for my tastes.

An additional concern here would be on future environmental regulations, which we cannot tell in advance.

Consol Energy Inc CEIX Stock As A Short-Term Options Trade

Short-term focused traders can take advantage of CEIX’s momentum using options.

I am looking at the $20 & $22.50 calls with the 9/17 expiration.

These both look primed to expire in-the-money based on their current momentum to the upside.

The $25 & $22.50 puts for the same expiration also look appealing as a hedge.

Their options have lower Open Interest, which is something to consider before trading them.

Their Implied Volatility are also all above 50%, which some traders may opt to sell options instead of buying them when this level is that high.

Tying It All Together

All-in-all, CEIX stock seems to have many ways for traders of all time frames to profit from.

Long-term investors may be attracted to their P/E & P/B levels, and short-term traders can easily see that they’ve got great momentum going for them.

Consol Energy Inc. looks to have many profitable trade opportunities & is certainly worth taking a closer look at.

*** I DO NOT OWN SHARES OF CEIX STOCK ***