Direxion Daily Robotics, Artificial Intelligence & Automation Index Bull 3X Shares UBOT ETF Analysis

UBOT is an ETF that tracks the performance of stocks that are in the artificial intelligence & automation space, that is 3x leveraged.

UBOT is focused in areas that may be less impacted than other market segments in the event of another COVID-related shutdown, which is why it may be a good idea to add it to your watchlist.

UBOT has no options to use an a hedge, so using an inverse NASDAQ ETF may be your best bet.

Direxion Daily Robotics, Artificial Intelligence & Automation Index Bull 3X Shares UBOT ETF One Year Technical Performance

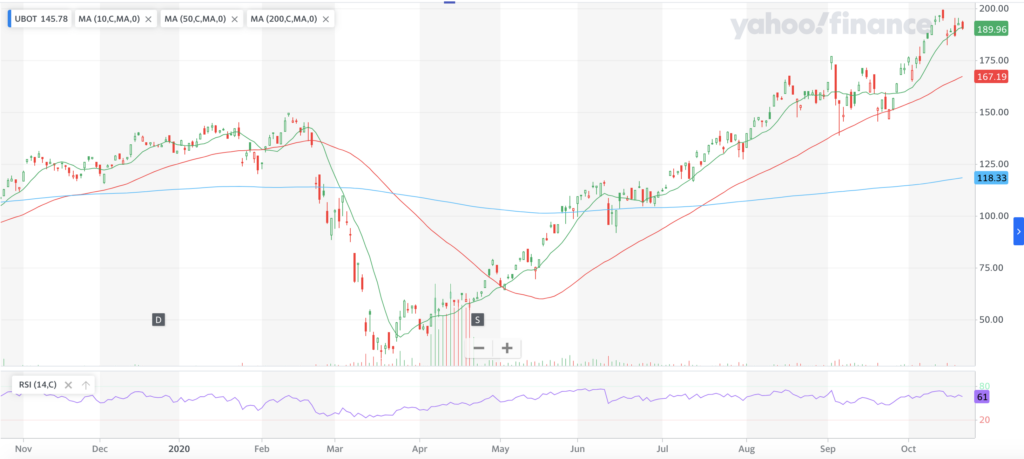
UBOT Share Price: $188.00

10 Day Moving-Average: $190.81

50 Day Moving-Average: $$167.19

200 Day Moving-Average: $118.33

RSI: 61

UBOT’s share price has dipped under the 10 Day Moving-Average, which is not a great sign in the near-term, so I would be more focused on keeping an eye on their performance before finding an entry.

I would focus on their RSI & seeing if there is more pain to come in the share price, or if it is able to break free of the 10 Day Moving-Average, and re-test the $195-196ish level successfully.

UBOT is something I will be looking at for an entry, but not acting on until I see a little more convincing evidence that they are on sturdy footing.

With that said, that doesn’t mean that there aren’t short-term entry opportunities for traders to capitalize on in the meantime.

*** I DO NOT OWN SHARES OF UBOT ETF ***

Ever-Glory International Group, Inc. EVK Stock Analysis

Ever-Glory International Group, Inc. stock trades under the ticker EVK & has recently shown technical strength worth taking a closer look at.

EVK stock closed for trading on 10/22/2020 at $2.60/share, and is up an additional 20% in pre-market trading.

EVK stock does not have options, so for an effective hedge, traders should consider buying long shares or options in an inverse NASDAQ ETF or an inverse retail ETF such as ONLN, EMTY or CLIX, as EVK focuses on retail supply chains (particularly for fashion).

Ever-Glory International Group, Inc. EVK Stock Technicals For The Last Year

EVK Stock Price: $2.60

10 Day Moving-Average: $1.05

50 Day Moving-Average: $0.99

200 Day Moving-Average: $1.09

RSI: 60

With an RSI of 60, there appears to be more room to run, as EVK is not signaling to be over-bought, and supply chain companies will always be needed, even if there is another COVID-related shutdown.

Ever-Glory International Group, Inc.’s 10 Day Moving-Average just crossed its 50 Day Moving-Average, and is poised to blow through the 200 Day Moving-Average, showing more signs of strength lie ahead.

Based on all the above, there seems to be more opportunity for traders to capitalize on further growth in EVK’s stock for a short-term trade.

I am looking to get into EVK today, but not anticipating holding it very long.

*** I DO NOT OWN SHARES OF EVK STOCK ***

Dragon Victory International Ltd. LYL Stock Analysis

Dragon Victory International LTD. stock trades under the ticker LYL & has recently displayed strong technical performance.

LYL stock closed for trading at $3.2499/share on 10/21/2020.

For the last week they have been trending heavily upwards, with a bit of a pullback yesterday (-8%), and they may go down a bit more today as NASDAQ futures are pointing to a down day (-0.42% as of my writing this at 6:15 am).

LYL does not have options, so a hedge may be an inverse micro-cap ETF, such as RWM, TWM, or TZA (through common shares, or call options, as depending on the Greeks there may be a better deal).

Dragon Victory International Ltd. LYL Stock Technical Performance For The Last Year

LYL Stock Price: $3.24

10 Day Moving-Average: $1.38

50 Day Moving-Average: $1.15

200 Day Moving-Average: $1.14

RSI: 81

Overall, LYL looks to have some strength still that can be capitalized on, as long as traders are cognizant of the hedge opportunities that are available to them.

Otherwise, I would be eyeing their charts to find the best entry point for a short-term LYL stock trade.

*** I DO NOT OWN SHARES OF LYL STOCK ***

Northwest Biotherapeutics, Inc. NWBO Stock Analysis

Northwest Biotherapeutics, Inc. stock trades under the ticker NWBO, and has recently shown technical strength making it worth taking a closer look at.

NWBO closed for trading at $2.30 (+12.75%) yesterday, 10/20/2020.

NWBO stock does not have options, so the only way to trade it is through the common shares, so the best way of finding a hedge opportunity might be through something like BIS, which is the inverse NASDAQ BioTech ETF (note that NWBO is an OTC stock, not a member of the NASDAQ).

Northwest Biotherapeutics, Inc. NWBO Stock Technical Performance For The Last Year

NWBO Stock Price: $2.30

10 Day Moving-Average: $1.14

50 Day Moving-Average: $0.683

200 Day Moving-Average: $0.354

RSI: 86

Their RSI currently signals over-bought conditions, which should even out as they establish more of a new range, after multiple gap-up days in October.

Their 1.46 Beta shows that there may be some more volatility to NWBO’s stock than the general markets, signaling that with the proper timing there should still be some opportunities for profits from Northwest Biotherapeutics, Inc.’s stock.

*** I DO NOT OWN SHARES OF NWBO STOCK ***

Kaixin Auto Holdings KXIN Stock Analysis

Kaixin Auto Holdings stock trades under the ticker KXIN & has recently shown great technical strength.

KXIN stock closed for trading at $8.15/share on 10/19/20 (+~294%).

In pre-market trading (6:30 am ET) they have dropped down to $6.55 (-~20%), making it worth eyeing them for a potential entry point for a short-term trade.

Kaixin Auto Holdings KXIN Stock Technical Performance For The Last Year

KXIN Stock Price: $8.15

10 Day Moving-Average: $2.07

50 Day Moving-Average: $0.91

200 Day Moving-Average: $0.72

RSI: 74

While their pre-market price is reflecting somewhat of a shakeout of yesterday’s steep climb, there may be an entry today or tomorrow that can lead to profitable trades once the dust settles.

KXIN stock does not have options, so trading the ordinary shares are the only way to go about this, making the timing of your entry more important, but with futures currently set higher (NASDAQ Futures are +0.64% as I write this), Kaixin Auto Holdings stock may catch the rest of the index’s momentum & continue to climb.

*** I DO NOT OWN SHARES OF KXIN STOCK ***

Natuzzi S.p.A. NTZ Stock Analysis

Natuzzi S.p.A. stock trades under the ticker of NTZ & has recently displayed great technical strength.

NTZ stock presents opportunities for traders to take advantage of, especially after a strong October performance.

While NTZ does not have options to trade, there still seem to be opportunities for profits by buying their common shares.

Their RSI is still high, so there should be a pullback that can be taken advantage of.

NTZ Share Price: $4.21

10 Day Moving-Average: $3.075

50 Day Moving-Average: $1.828

200 Day Moving-Average: $1.302

RSI: 94

I would wait until the RSI settles down a bit & a new range is established, but NTZ is certainly something to have your eyes on as a trader.

*** I DO NOT OWN SHARES OF NTZ STOCK ***

Owens & Minor, Inc. OMI Stock Analysis

Owens & Minor, Inc. stock trades under the ticker OMI, and closed for trading at $26.62 on 10/15/2020.

After having recently shown technical strength, OMI stock has some interesting trade opportunities, both in common stock, as well as options.

With the gap between Owens & Minor, Inc.’s stock price & 10 Day Moving-Average getting closer, the 11/20 expiration $25 puts may be worth picking up.

This is especially important, given that we expect to see more volatility leading up to the election in a few weeks, and the $25 put’s Theta (time decay) is -0.0359, and their Vega (volatility:price sensitivity) is 0.0311.

From a OMI call options perspective, I would also be looking at the $25 strike price for 11/20 expiration calls. This way there is some cushion for the price to decline, and their Delta is 0.65, vs. the $22.50 call’s Delta of 0.78.

OMI Stock Price: $26.623

10 Day Moving-Average: $25.28

50 Day Moving-Average: $18.30

200 Day Moving-Average: $10.13

RSI: 70

For investors who are looking on a longer-term horizon, owning the common OMI shares is an option.

OMI is also a part of many ETFs, including XSVM (Invesco S&P SmallCap Value with Momentum ETF) , XHS (SPDR® S&P Health Care Services ETF) & CALF (Pacer US Small Cap Cash Cows 100 ETF), which will provide OMI exposure, while reducing risk as other assets are also held in these funds.

*** I DO NOT OWN SHARES OF OMI STOCK ***

Nautilus, Inc. NLS Stock Analysis

Nautilus, Inc. stock trades under the ticker NLS, and closed for trading at $21.79 on 10/13/2020.

NLS has shown great strength since its price bottom in April, making it appealing for a trade opportunity.

NLS stock’s $22.50 call options are set to open in the money today based on yesterday’s post-market activity, with the next highest strike price level being $25 calls (looking at the 10/16 expiration).

Based on the prices of the put options, it seems that most traders see them going down in price before 10/16.

Nautilus, Inc. NLS Stock Chart For The Past Year

NLS Price: $21.79

10 Day Moving-Average:$19.64

50 Day Moving-Average: $15.06

200 Day Moving-Average: $7.69

RSI: 71

Given that the puts are priced at the same level, buying the $22.50 puts & calls for the same expiration may be the best course of action.

Weighting the holding to reflect your sentiment of their chart will help to protect you from losses, while maximizing gains.

Perhaps if you think NLS’s stock price will decline by Friday to under $22.50, buying a 2:1 ratio of puts:calls might make a safe way to trade on your belief, and vice versa for those who think Nautilus, Inc.’s stock price will rise.

*** I DO NOT OWN NLS STOCK ***

Kirkland’s, Inc. KIRK Stock Analysis

Kirkland’s, Inc. stock trades under the ticker KIRK & has recently been showing strong technical strength.

KIRK stock closed at $11.80 on 10/13/20, after taking off from May 2020.

Their in-the-money call options are $10 calls (10/16 expiration), with $12.50 being the next higher level, requiring a 6% increase in price by Friday in order to finish in-the-money.

With an implied volatility of 128%, the $12.50 calls look more appealing to sell than to buy, whereas the $10 calls provide for some added cushion from market volatility.

The Delta of the KIRK $10 call option is 0.946, making it worth considering outright buying the shares for a trade instead.

Kirkland's, Inc. KIRK Stock One Year Chart

KIRK Price: $11.80

10 Day Moving-Average: $9.38

50 Day Moving-Average: $8.21

200 Day Moving-Average: $3.20

RSI: 67

For a hedge on KIRK stock or call options, their $12.50 puts are in-the-money, and look much more appealing than their $10 out-of-the-money puts

With the gap between the 10 Day & 50 Day Moving-Averages narrowing & getting closer to the price/share, when buying Kirkland’s, Inc. stock or calls, I would make sure to be mindful of having a smart hedge on the table as well.

*** I DO NOT OWN KIRK STOCK ***

Seres Therapeutics, Inc. MCRB Stock Analysis

Seres Therapeutics, Inc. stock trades under the ticker MCRB & has recently shown technical strength.

MCRB stock is currently $31.80/share, and their calls at this level are at a $30 and a $35 strike price.

While the Delta of the in-the-money $30 call is already 0.72, I may be more inclined to buy this than the out-of-the-money $35 call, as it needs 10% growth in order to become in-the-money (using the 10/16 expiration date).

MCRB Stock Price: $31.80

10 Day Moving-Average: $29.09

50 Day Moving-Average: $23.48

200 Day Moving-Average: $8.85

RSI: 70

The other advantage of the MCRB $30 calls to the $35 calls is that their time decay will be slightly more forgiving; as the $30 call’s Theta is -0.083, and the $35 call’s Theta is -0.091.

The $30 strike price call option also has a more advantageous implied volatility, and although it is over 50%, selling the $35 call while owning the $30 call could be a good trade idea.

*** I DO NOT OWN SHARES OF MCRB STOCK ***