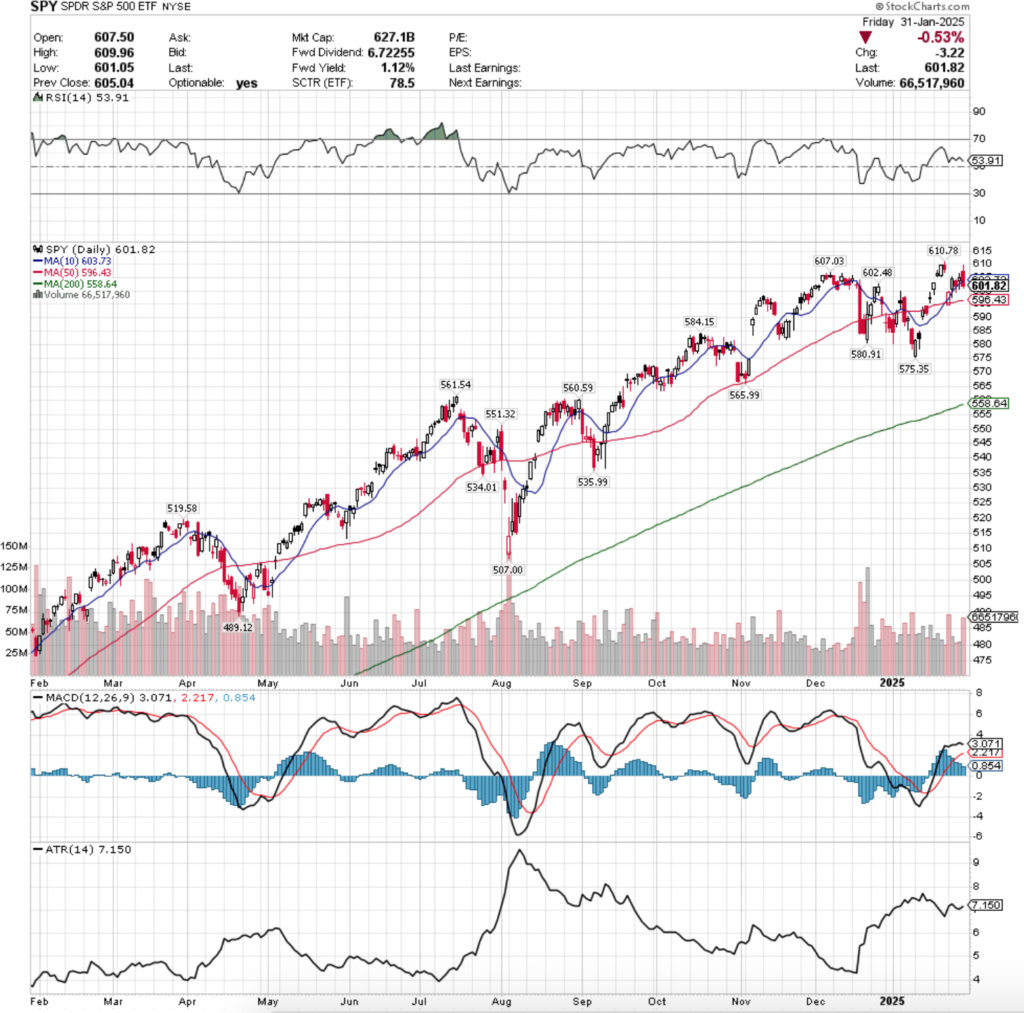
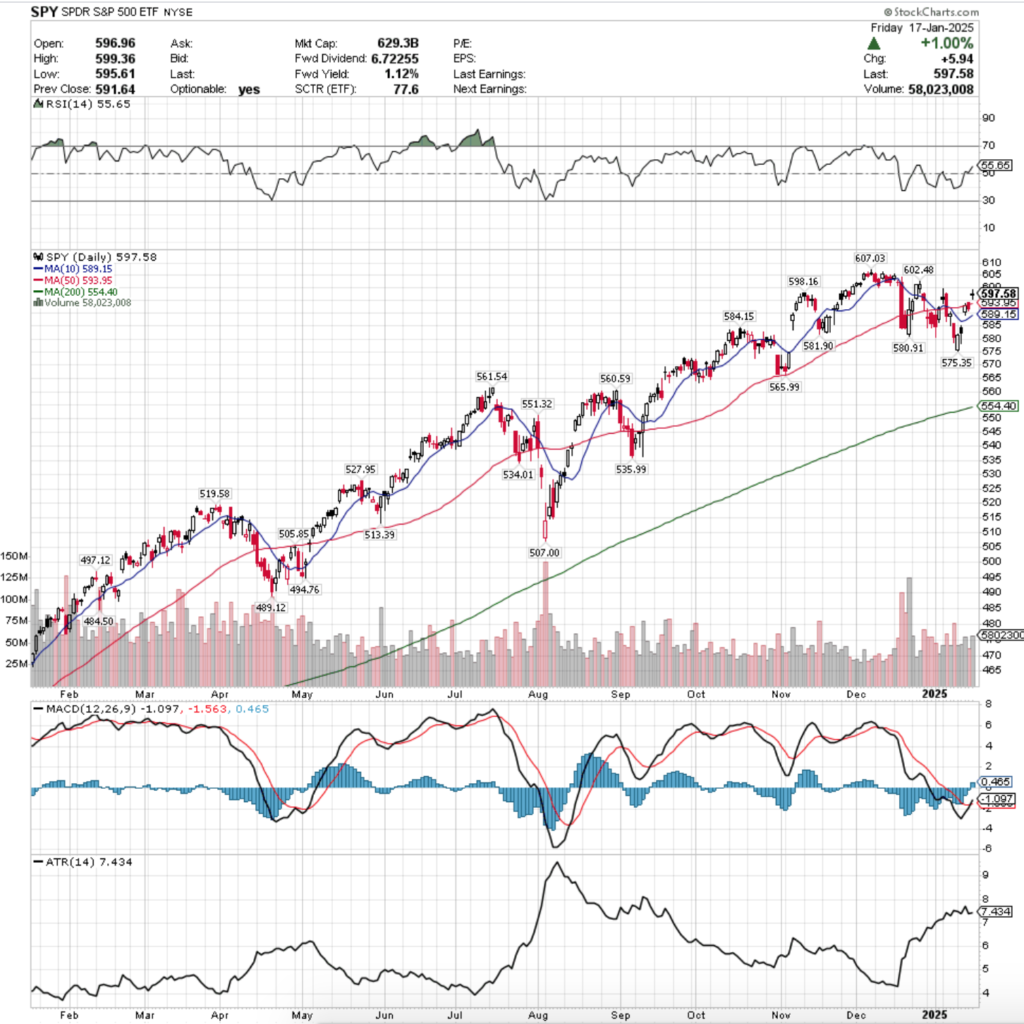
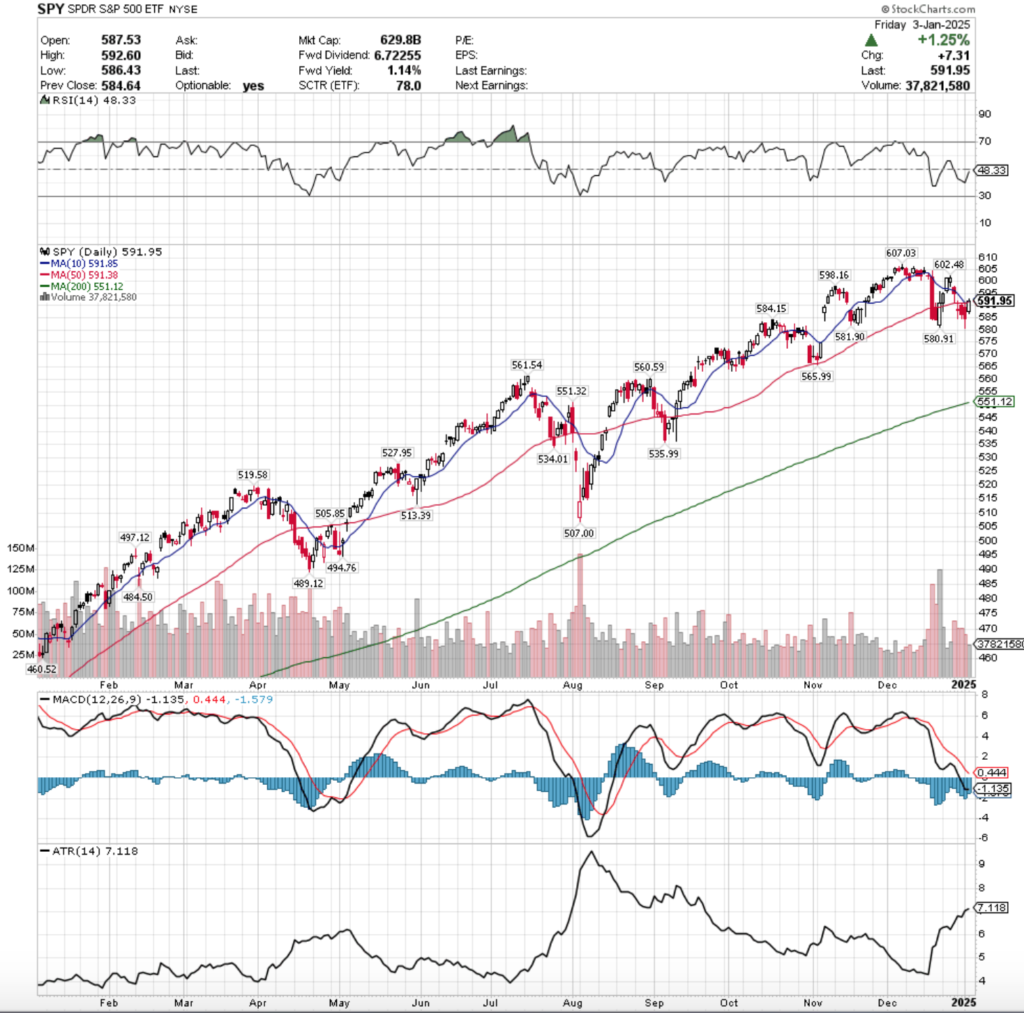
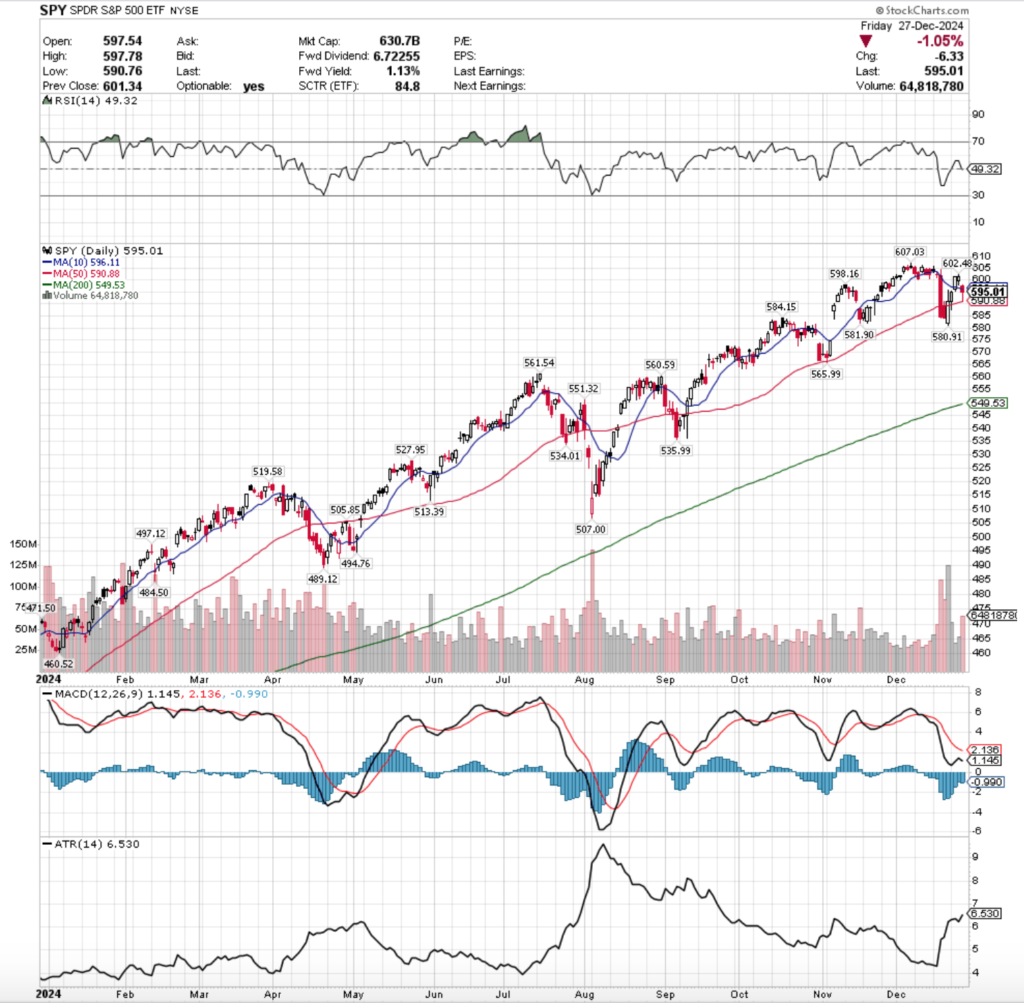
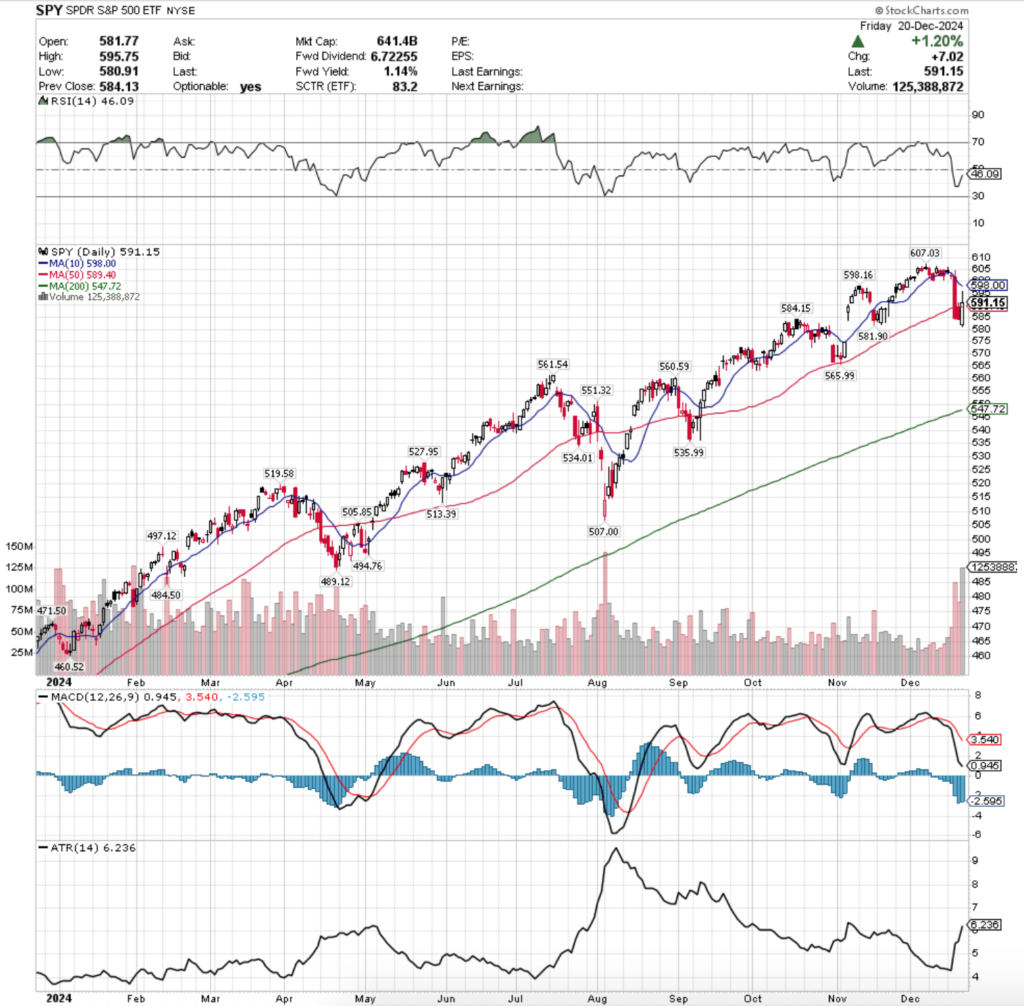
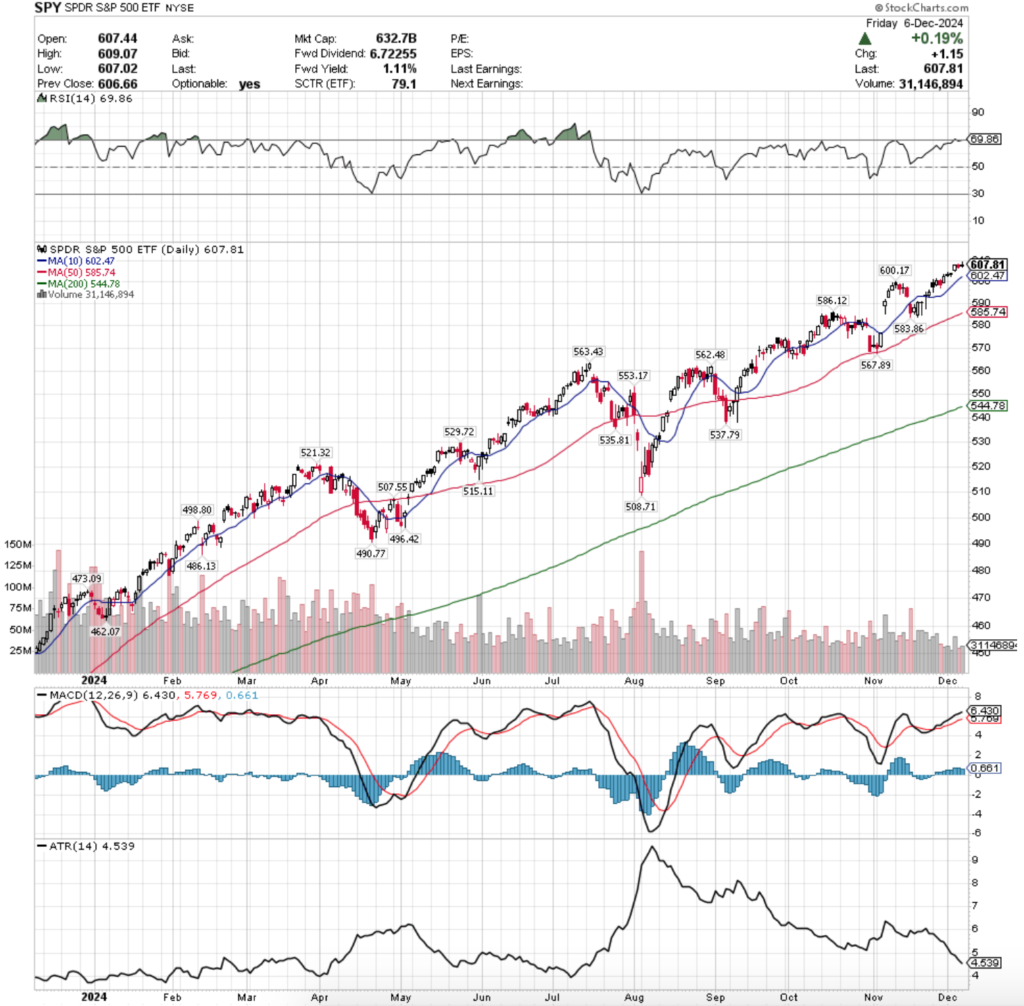
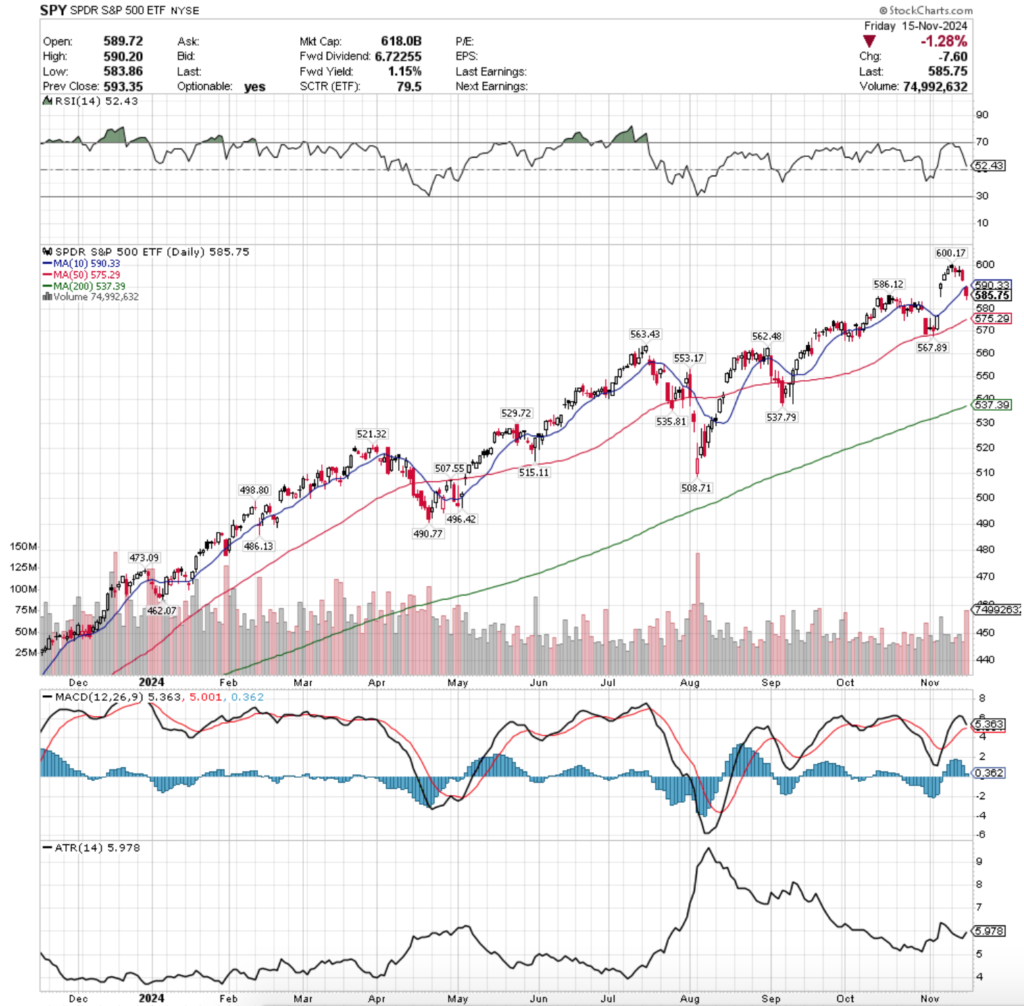
SPY, the SPDR S&P 500 ETF gained +1.49% last week, while the VIX closed the week at 14.77, indicating an implied one day move of +/-0.93% & an implied one month move of +/-4.27%.
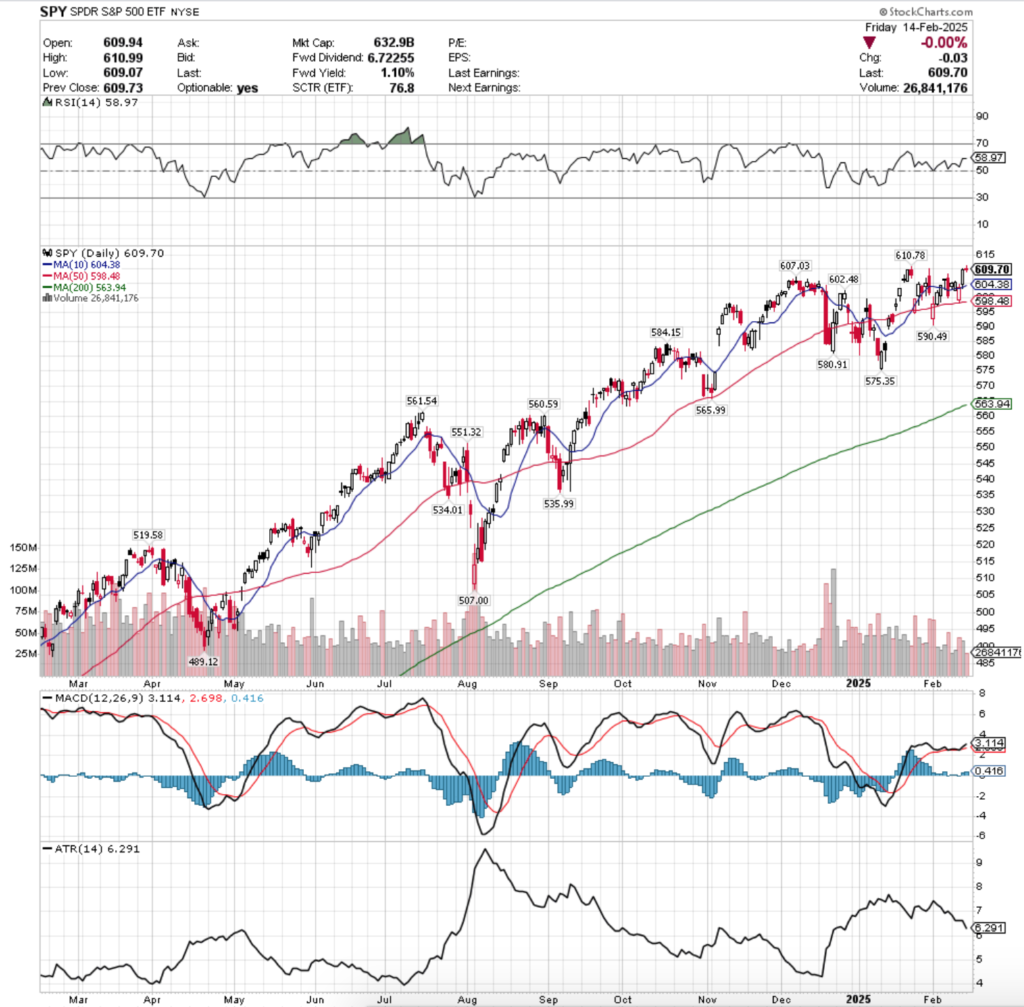
Their RSI is flat, midway between the neutral 50 mark & overbought 70 mark, sitting currently at 58.97, whiel their MACD remains bullish, but muted on the histogram due to the relative range-bound action of the past two weeks.
Volumes were -36.69% lower than the prior year’s average level (33.804,000 vs. 53,393,785), indicating that there is still a lot of hesitancy among market participants & adds to fears noted in prior weeks’ notes about how the current all-time highs will be difficult to break with staying power unless there is a major uptick in market participation (see here).
This is also important to note, as over the passing two weeks SPY’s average annual prior year’s volume has declined -2.63%, which will continue as we’ve noted over the past year as since 4/19/2024 average volumes have fallen dramatically.
To visualize this, one year ago in 2/18/2024’s Market Review Note the previous year’s average level was 81,771,964 as volumes began to wane in general, meaning this week’s average prior year’s level has fallen -34.7% lower Y-o-Y.
This should be viewed with caution given that we are still near all-time highs, but 1 of every 3 transactions that used to take place among market participants is no longer happening, indicating a high degree of uncertainty & hesitancy.
Between the upcoming wave of earnings this week, the January FOMC minutes coming out on Wednesday & the anticipated NVDA earnings call on 2/26/25 it looks like things will continue to oscillate around the 10 day moving average, much like they have for the past couple of weeks.
Monday opened the week up with a bearish harami candle on very low volume, where the 10 DMA’s support was able to hold up.
Tuesday showed a gap down open to below the 10 DMA’s support, but the resistance level was broken & SPY managed to end the day higher, forming a bullish engulfing pattern on slightly stronger, but still very weak volume, confirming the uneasiness mentioned above.
Wednesday is where all eyes should be when looking at the past week’s chart, as the week’s highest volume session opened on a gap down that flirted with the 50 day moving average’s support to the downside, but was able to power higher, temporarily breaking above the resistance of the 10 day moving average, before closing in line with it.
As the week’s average volume numbers show though, this was still not much to write home about despite the “high turnout” for the week.
Thursday saw slightly lower volume than Wednesday, and opened on a gap up, tested the 10 DMA’s support & then powered higher for the day, but the volume was still rather poor when the context of the annualized average volume is taken into account from above.
Friday the week wound down on a note of caution heading into the shortened holiday week this week, as the second lowest volume of the week resulted in a single day -0.00% decline.
The reason for the concern is that the doji combined with Thursday’s candle look set to create an evening doji star pattern potentially, which would be indicative of near-term pain on the horizon for SPY.
The volume of the past week wasn’t enough to keep SPY’s price above the all-time high when it broke through it temporarily on Friday, and that theme is still on the table.
Even should a rally occur, if the volume isn’t noticeably higher it would be wise to view it with skepticism & expect a high probability of a throwback before mid-March.
Moving into the new week it is going to be interesting to see what sort of upside momentum can be gathered, as SPY is just beneath its all-time high, but needs the volume mentioned above.
The likely average case will be a continuation of the oscillations around the 10 day moving average that we have been watching for the past few weeks & like much of December held, with some gap moves & then consolidation ranges.
Should this be the case & or any downside breakdown at all of the 10 DMA’s support take place there will be reasons for being vigilant in the coming week(s).
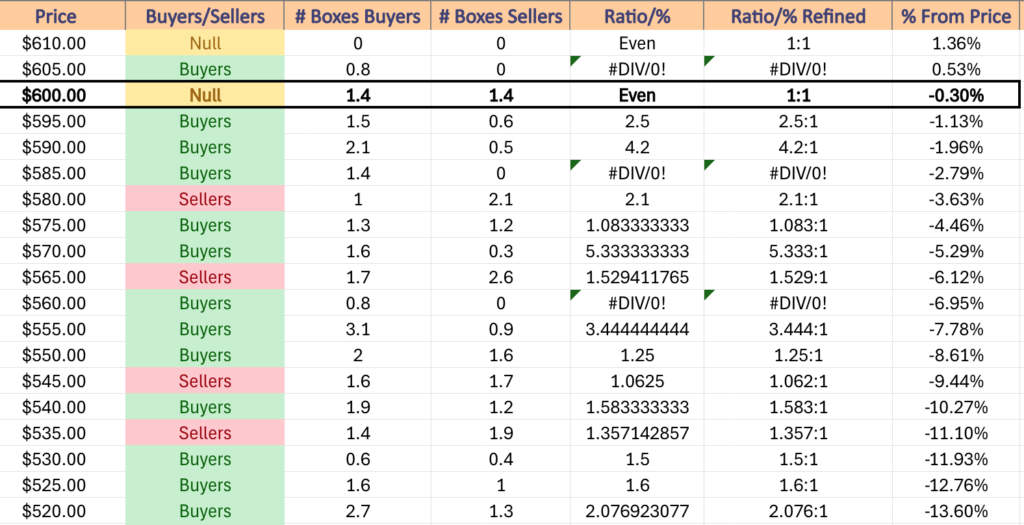
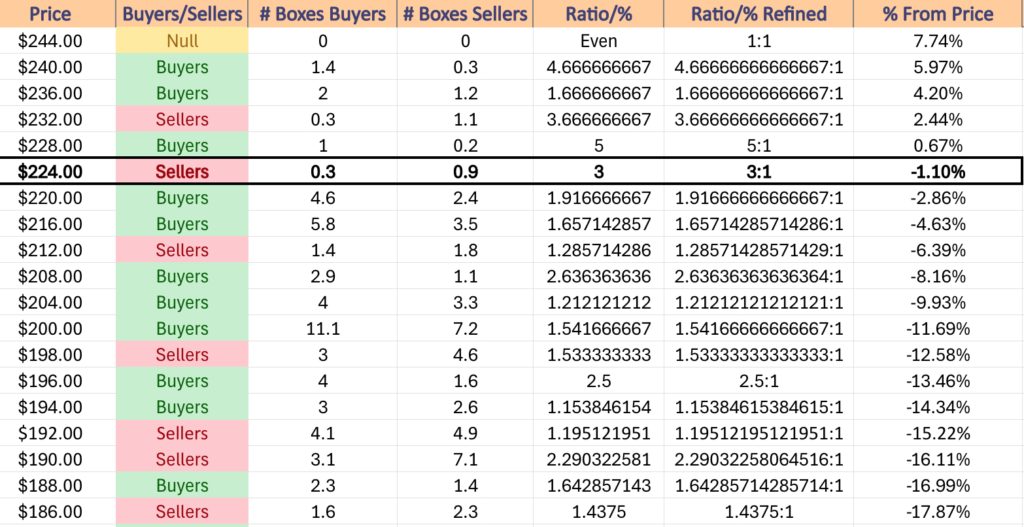
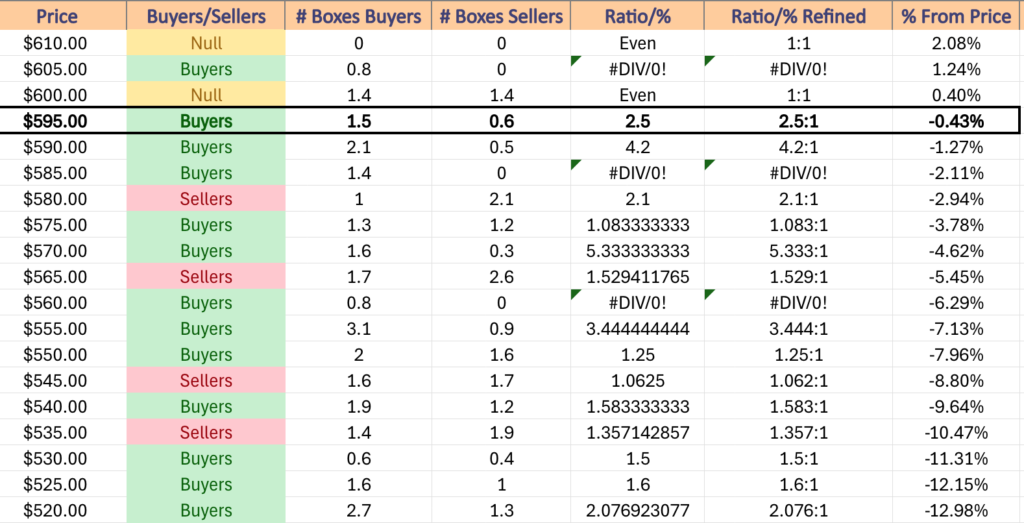
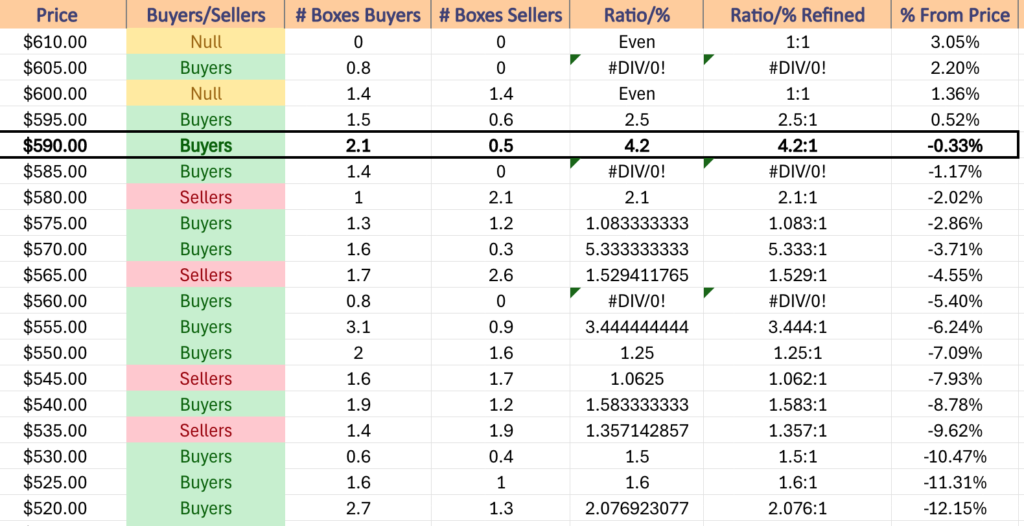
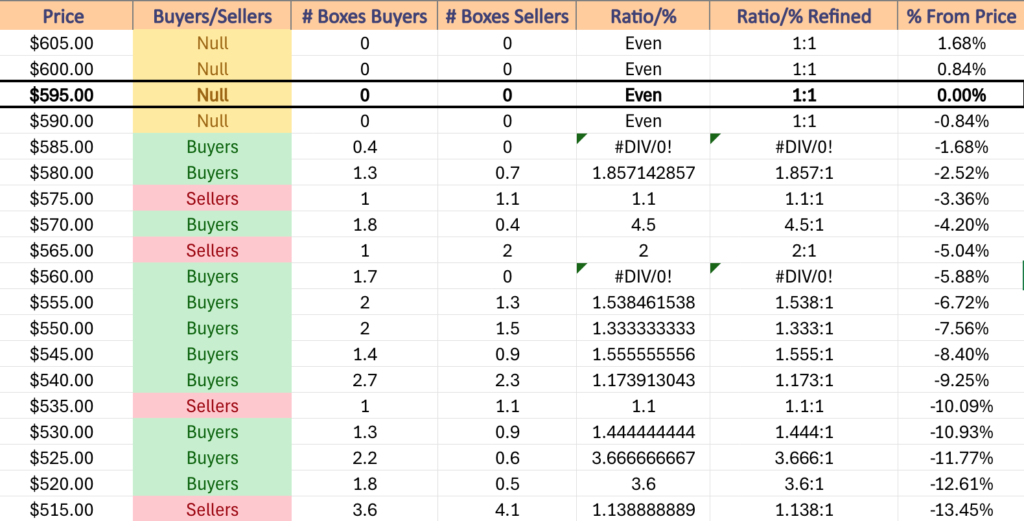
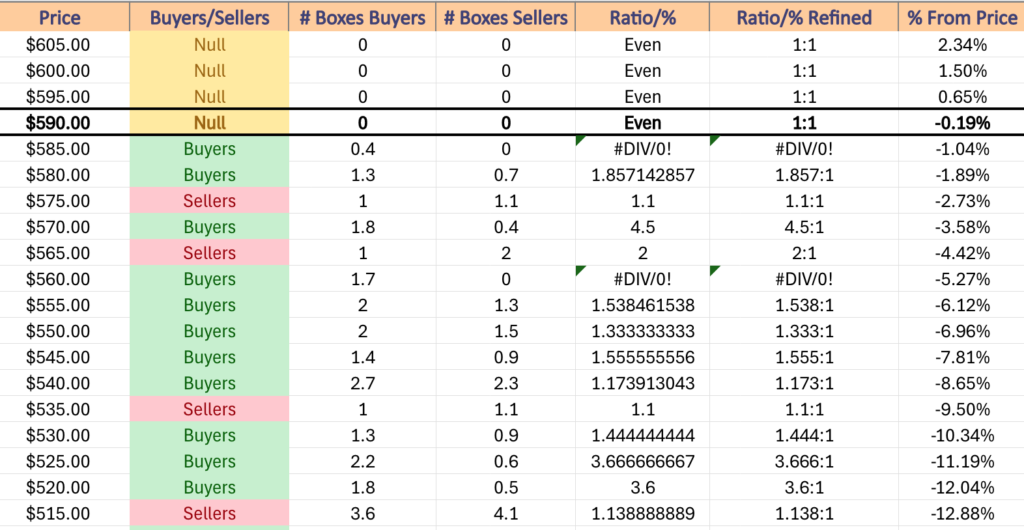
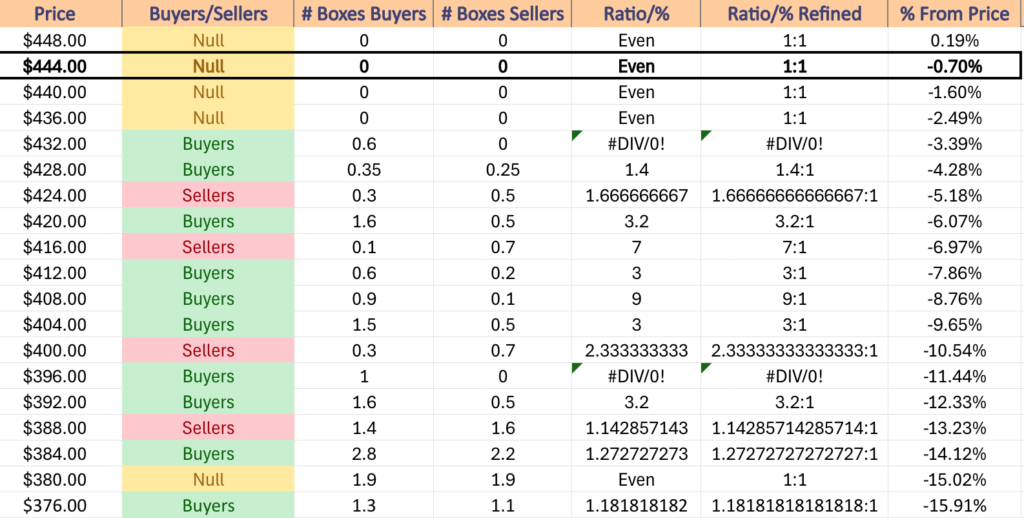
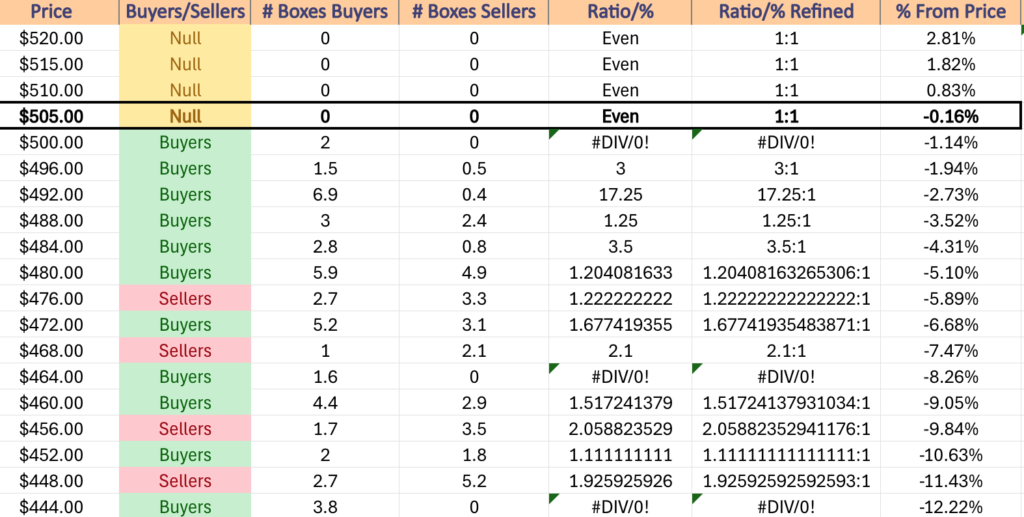
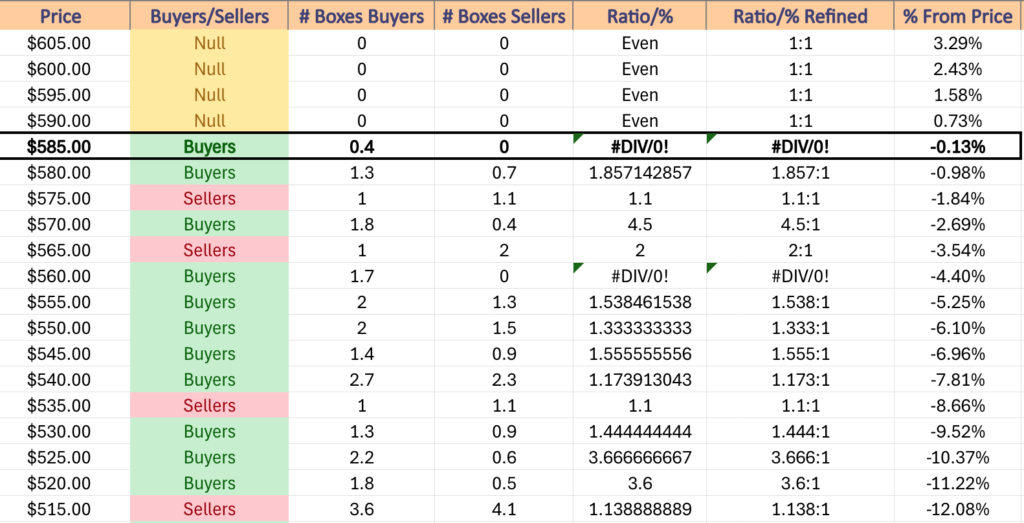
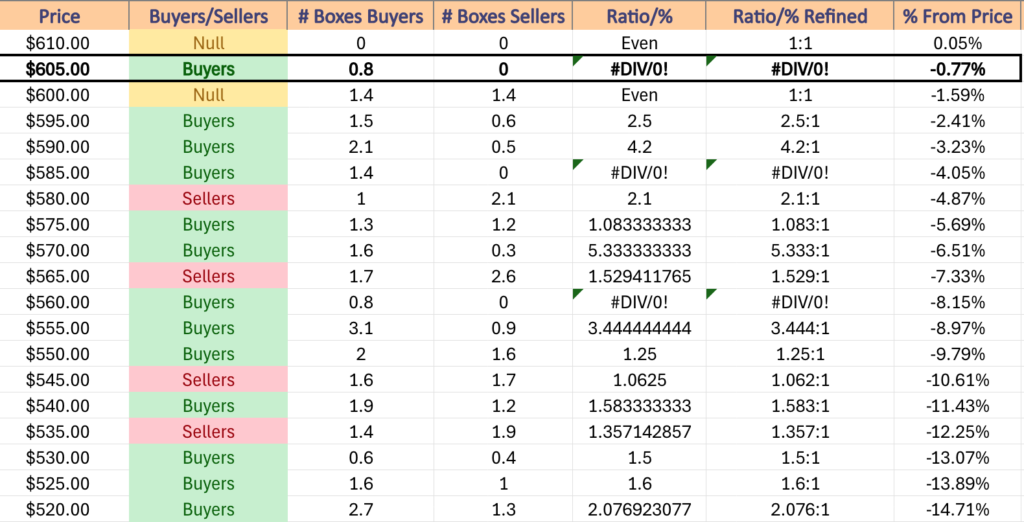
The 10 DMA currently is in a price zone that has historically been even, 1:1 between sellers & buyers over the past ~2 years & there is only one other support level separating the 10 & 50 DMAs.
When you consider that the 50 DMA is only -0.98% below the 10 DMA there’s limited room for a decline & waning enthusiasm for dip buyers to step in & make hold up the limited support levels.
It should also be noted that ~2% below the 50 DMA is the following support level, before just over 1% lower a Seller zone is entered, where Sellers have shown up 2.1:1.
While the next price zone below that one is Buyer dominated, but only at a rate of 1.08:1 & the only current support level is a hair above the lowest level of that price zone (see table below).
It’s become very evident that there’s a great need for vigilance in the coming week(s).
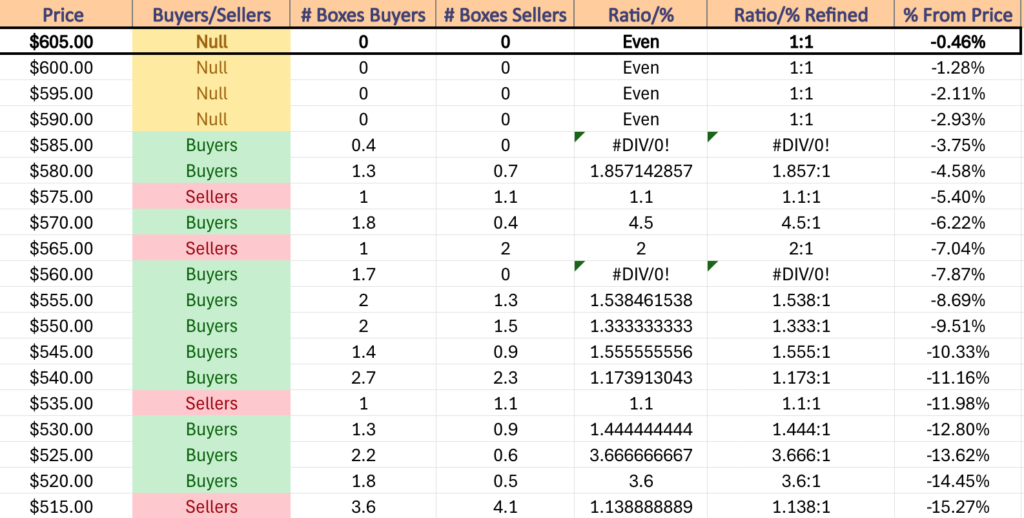
SPY has support at the $607.03 (Volume Sentiment: Buyers, 0.8:0*), $604.38 (10 Day Moving Average, Volume Sentiment: Even, 1:1), $602.48 (Volume Sentiment: Even, 1:1) & $598.48/share (50 Day Moving Average, Volume Sentiment: Buyers, 2.5:1) price levels, with resistance at the $610.78/share (All-Time High, Volume Sentiment: NULL, 0:0*) price levels.
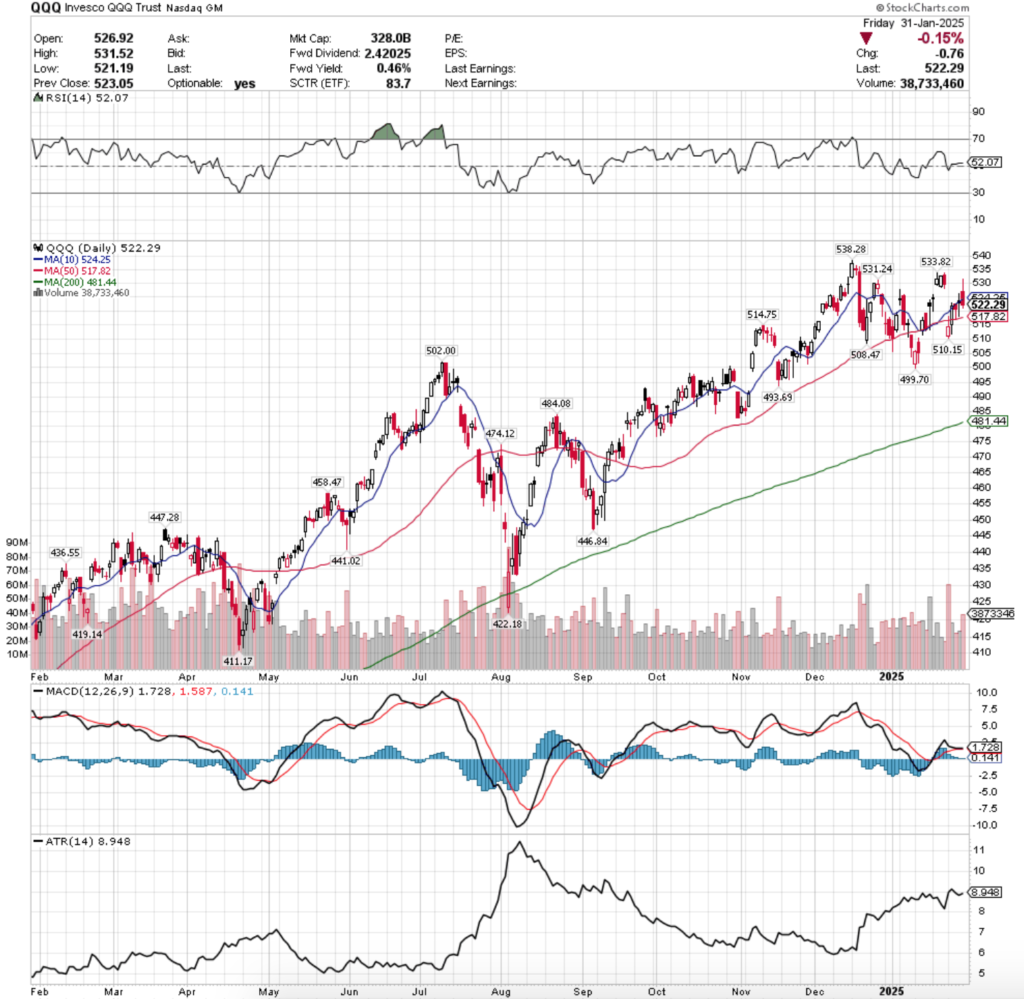
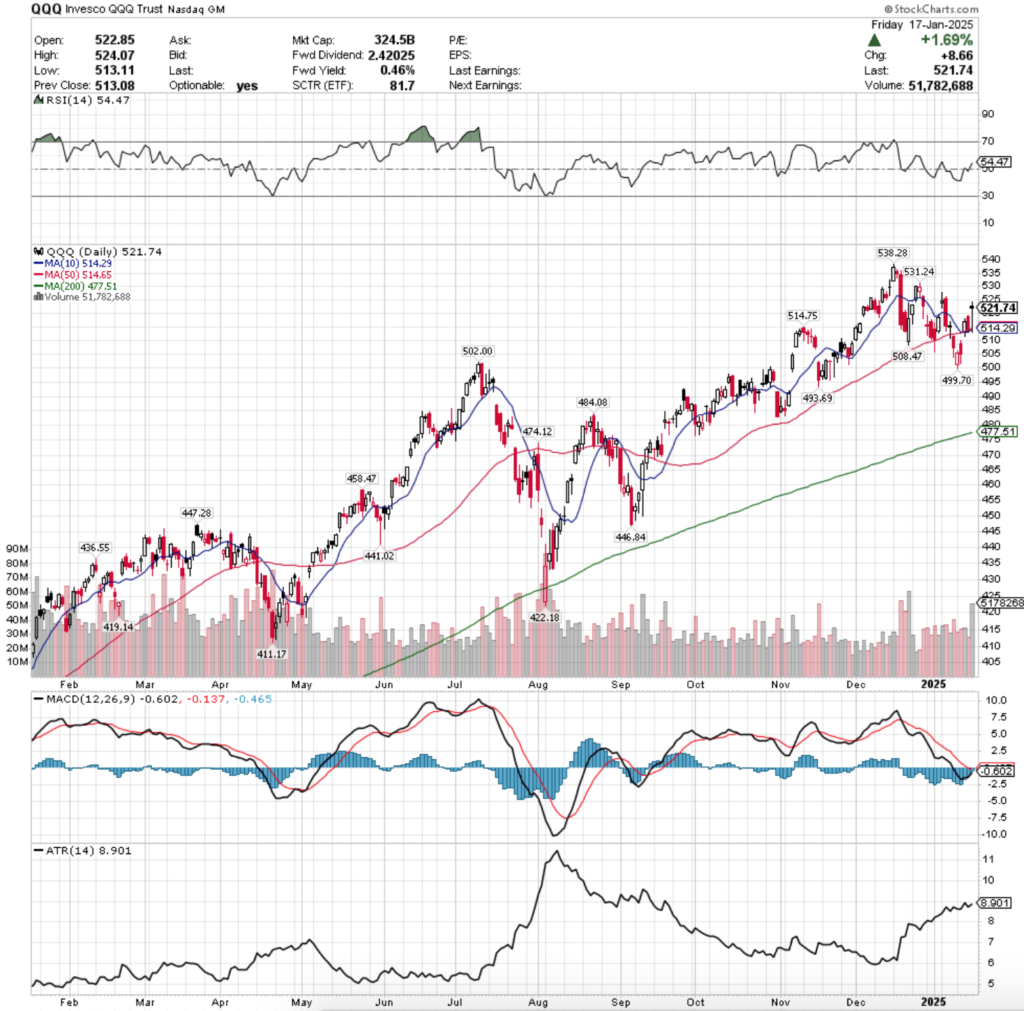
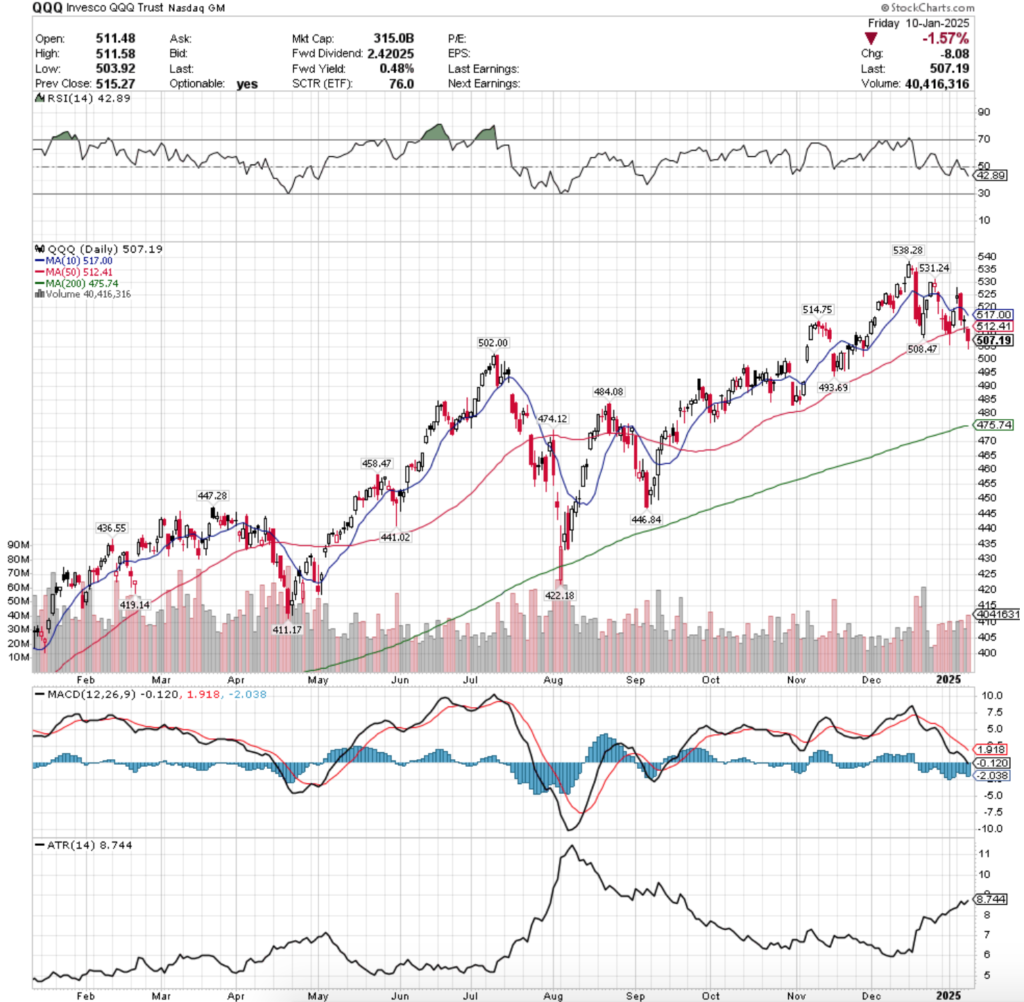
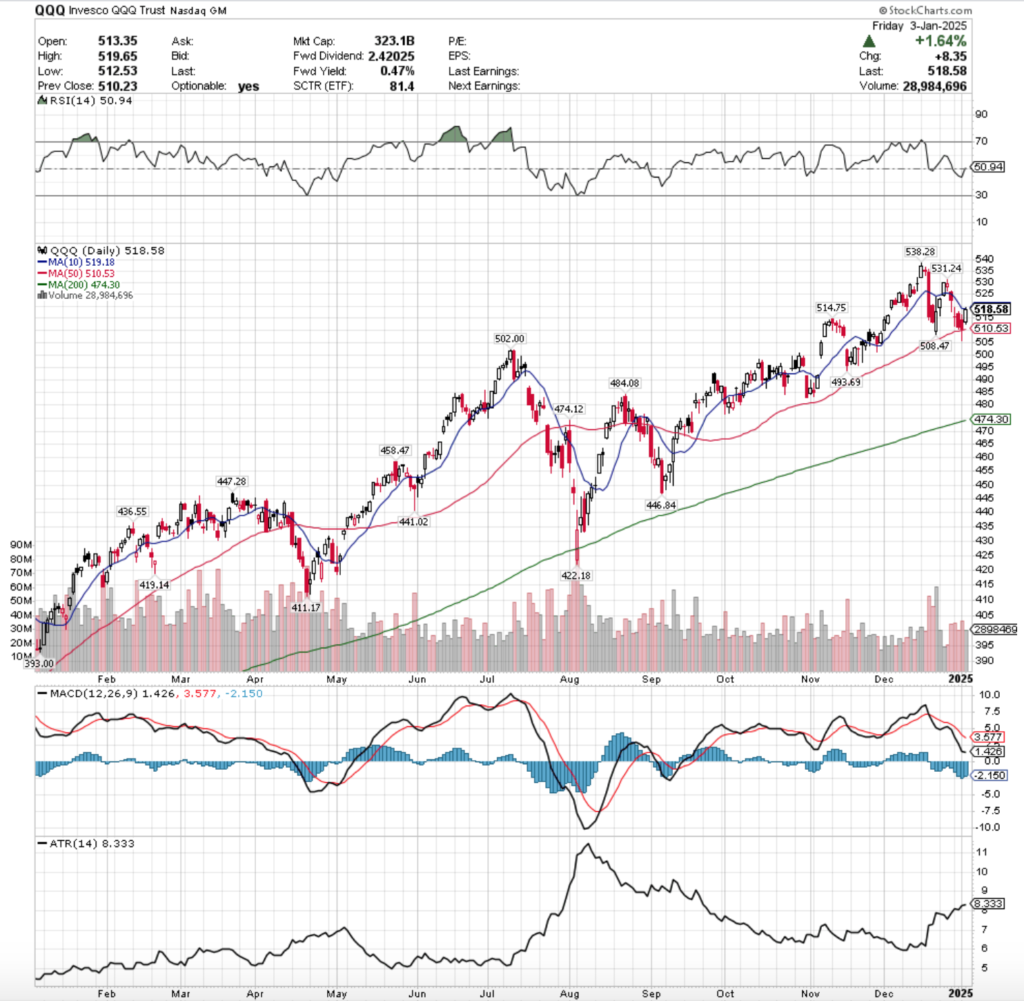
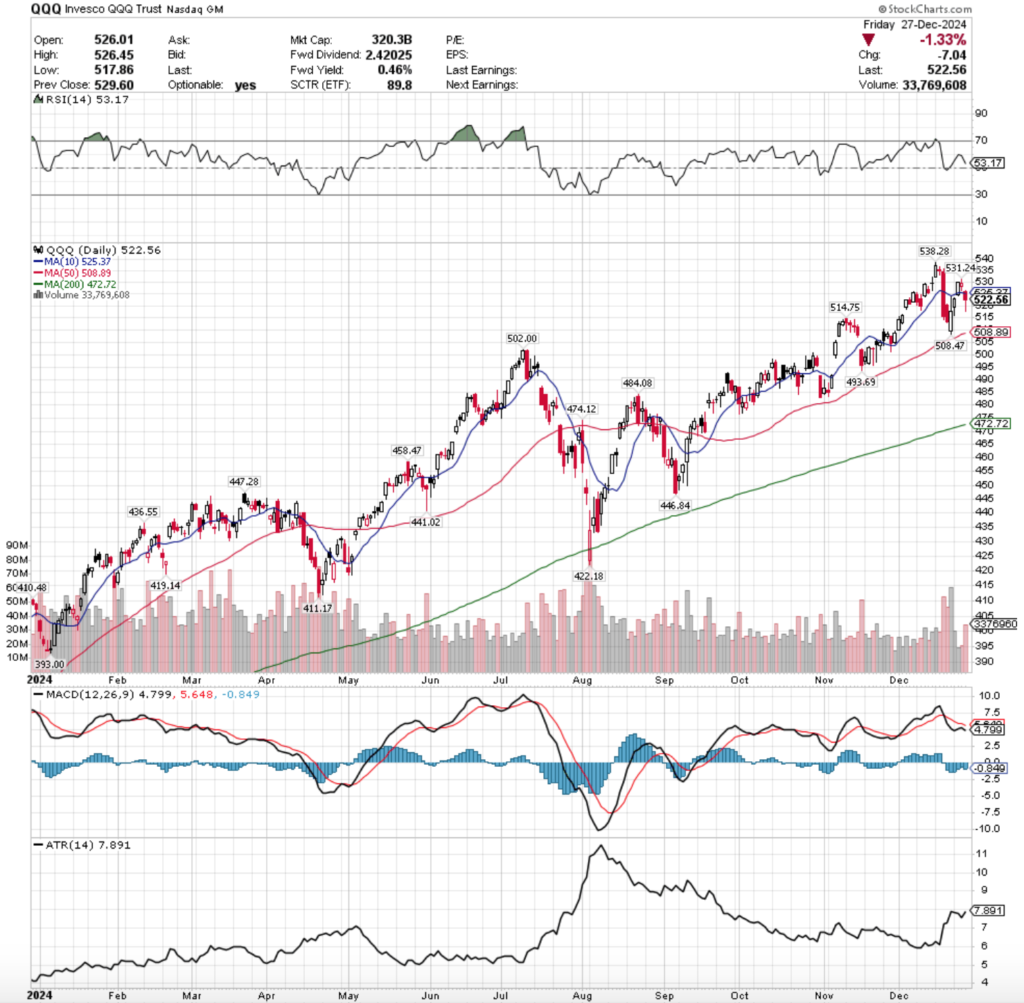
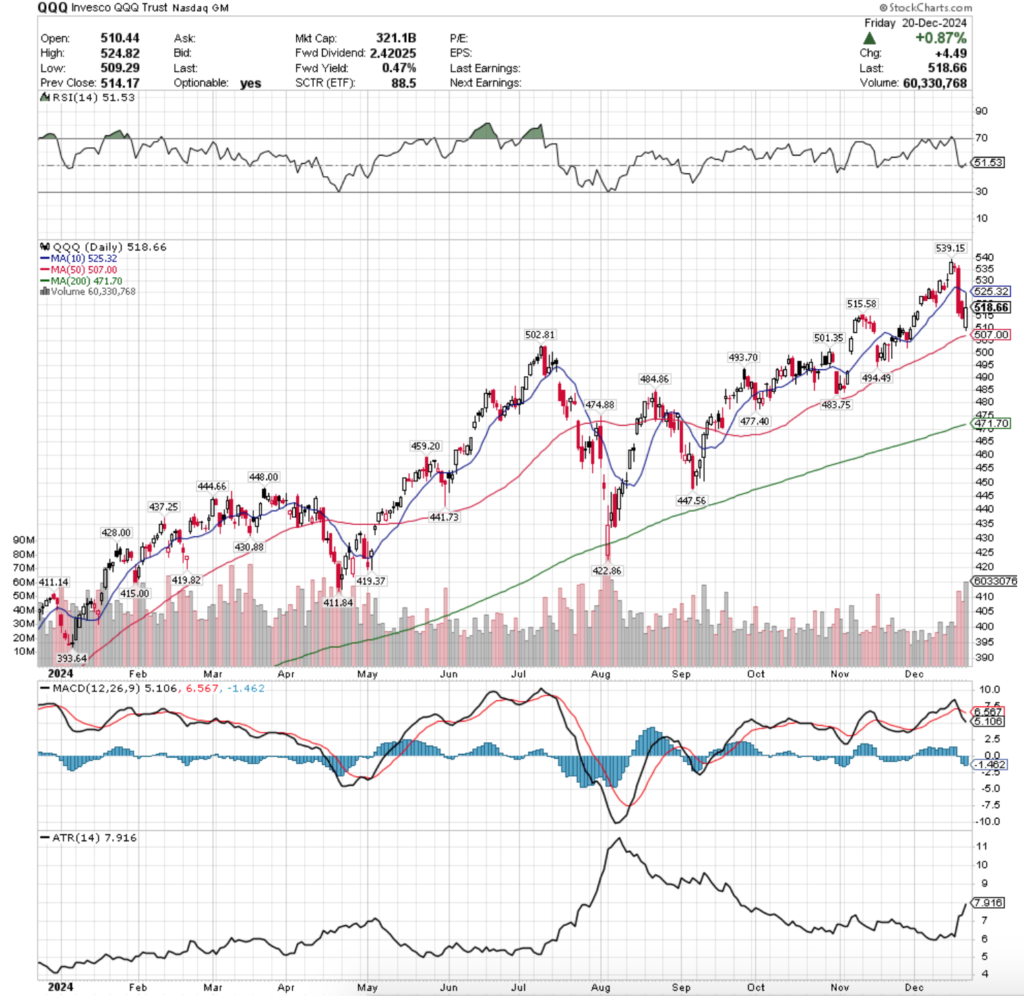
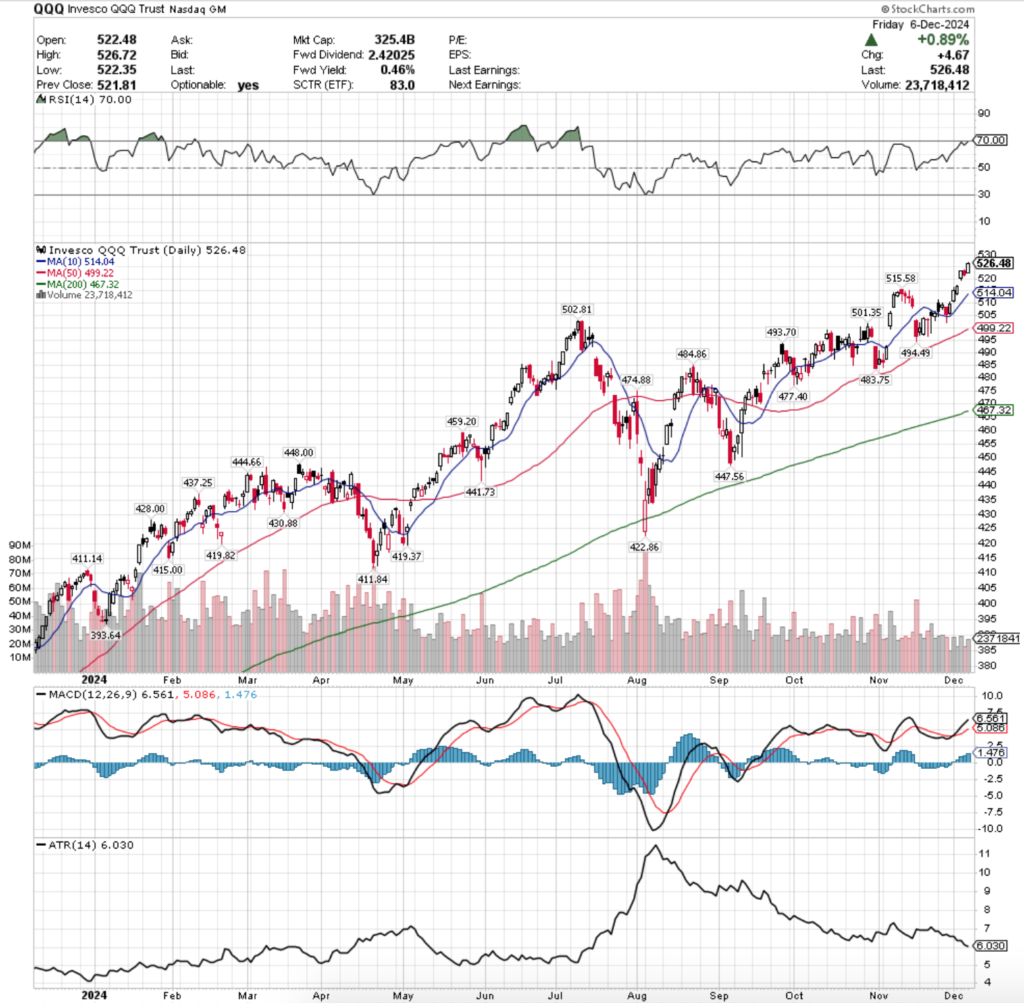
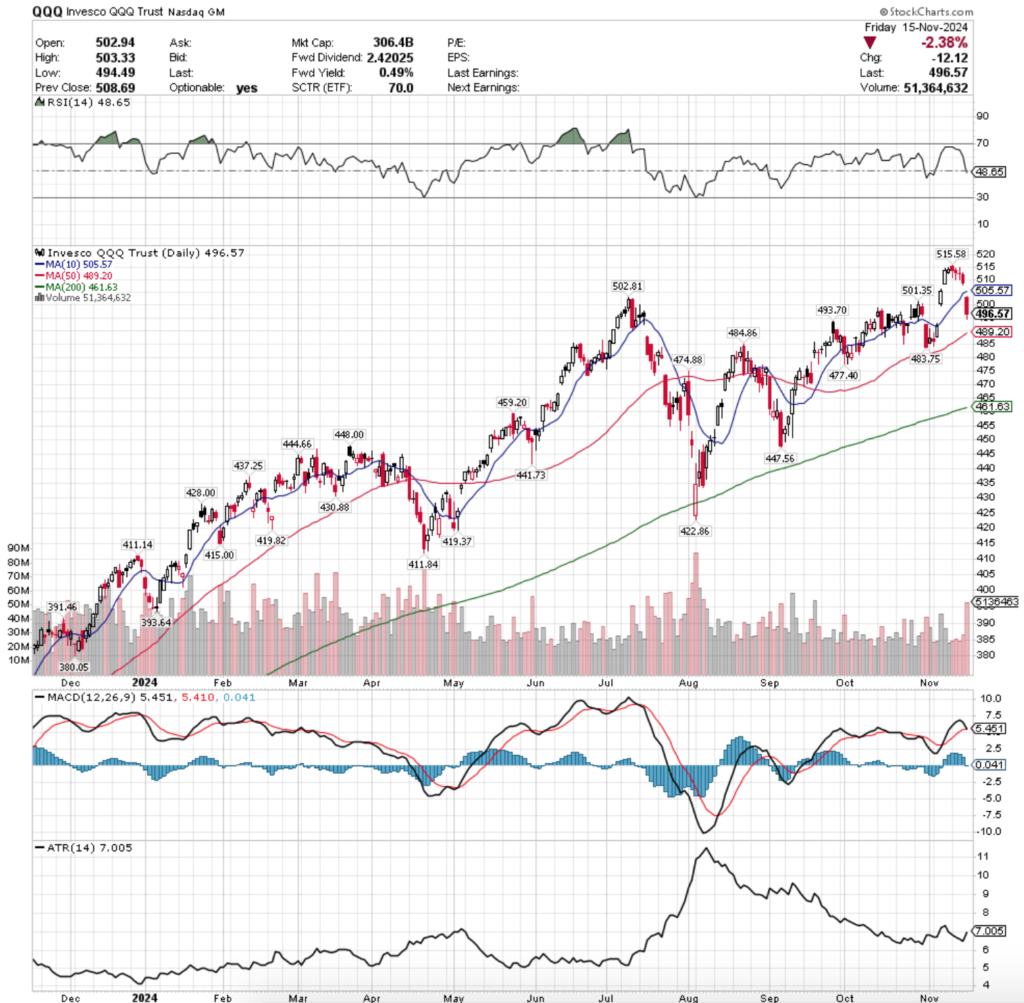
QQQ, the Invesco QQQ Trust ETF advanced +2.91% last week, as the tech-heavy index managed to fare the best of the major four index ETFs.
Their RSI is still advancing towards the overbought level & sits at 61.93 after the past three sessions, while their MACD is bullish, but its histogram has been muted since crossing over eight sessions ago.
Volumes were -36.76% lower than the prior year’s average levels (22,352,000 vs. 35,344,781), which is especially unnerving when you consider that the current past year’s average volume is -31.44% lower than than one year ago’s.
It’s also troubling to see volume this muted when 80% of the past week was advancing sessions for QQQ, indicating that there is a real lack of enthusiasm & folks are beginning to get slightly more worried.
Monday kicked QQQ’s week off on a bullish note, where the second weakest volume of the week’s session resulted in a bullish harami pattern, setting the stage for more gains in the near-term.
But not before Tuesday opened on a gap down, but quickly recovered to test the $530/share mark temporarily & managed to close higher, despite it being the weakest volume session of the week.
Things got a bit stranger come Wednesday, where on another gap down open QQQ opened below the 10 Day Moving Average’s support & tested the support of the 50 DMA, before rallying higher to close above the 10 DMA on the week’s second highest volume level, setting up the following two days of advancing sessions.
The fact that the 50 DMA was tested on the open after prices remaining above it for over a week is cause for caution & heightened awareness heading into this week.
Thursday’s gap up open also is cause for caution, just one day after the 50 DMA test, as despite having the strongest volume of the week, given how weak the week’s volume was is not convincing of any switches being flipped to the bullish side of things.
Friday also raises some eyebrows, as despite a new 52-week high being reached intraday, volumes were not strong enough to suggest a serious breakout to the upside particularly when compared to the two prior days’ levels.
Tuesday will play an important part in determining whether the three day rally lives on or if we see QQQ go back to oscillating around the 10 day moving average for the next week until NVDA earnings on 2/26/2025.
Like SPY, any meaningful upside movement in the near-term that will be sustainable will require an uptick in volume, especially given how robust the $538-539 window has held up among market participants.
Throwbacks should be watched for in the event of a breakout that does not occur on strong volumes.
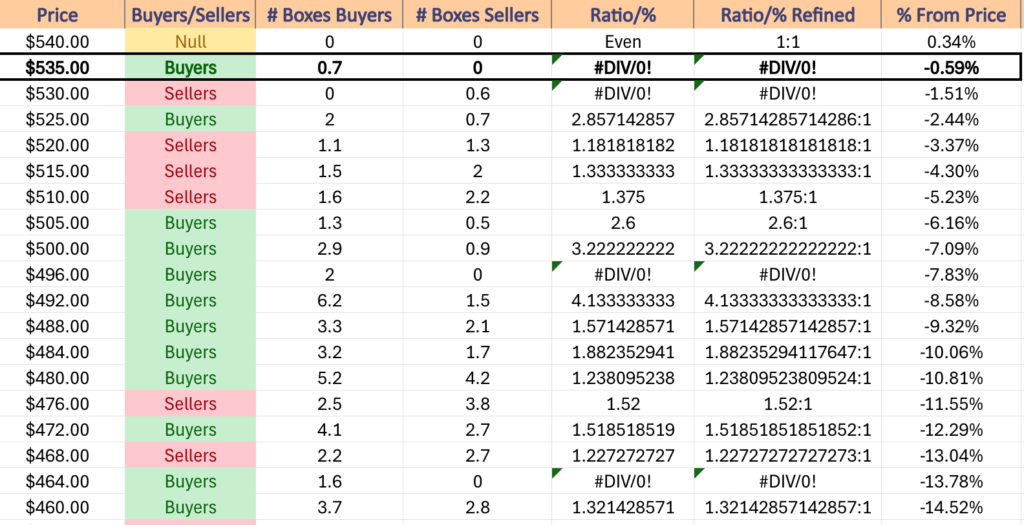
In terms of should we see a consolidation range form from the run up of the second half of the week the 10 day moving average will become a key area to watch.
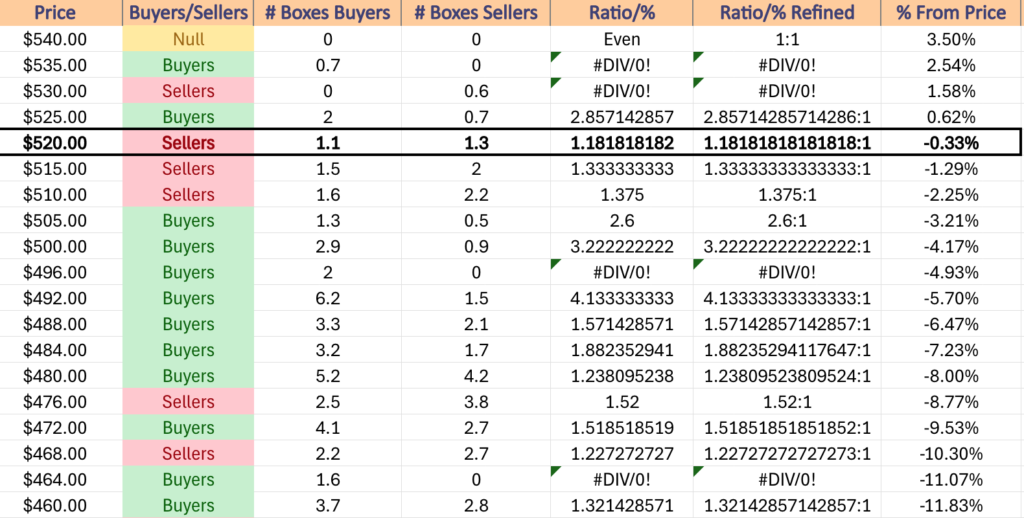
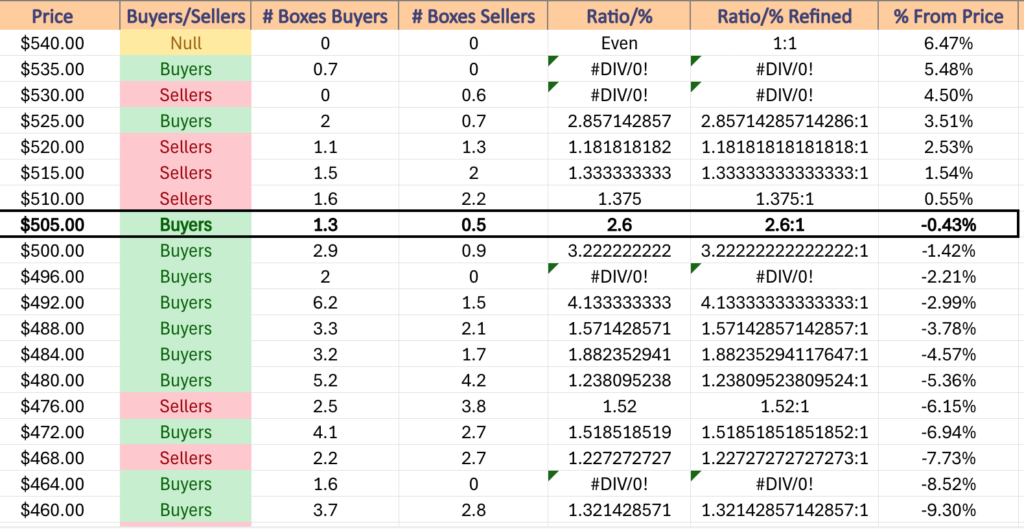
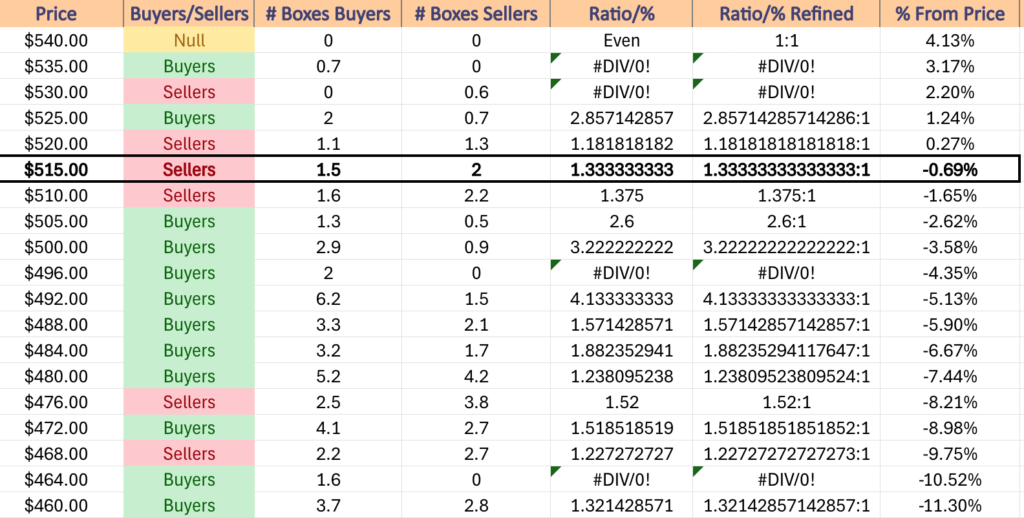
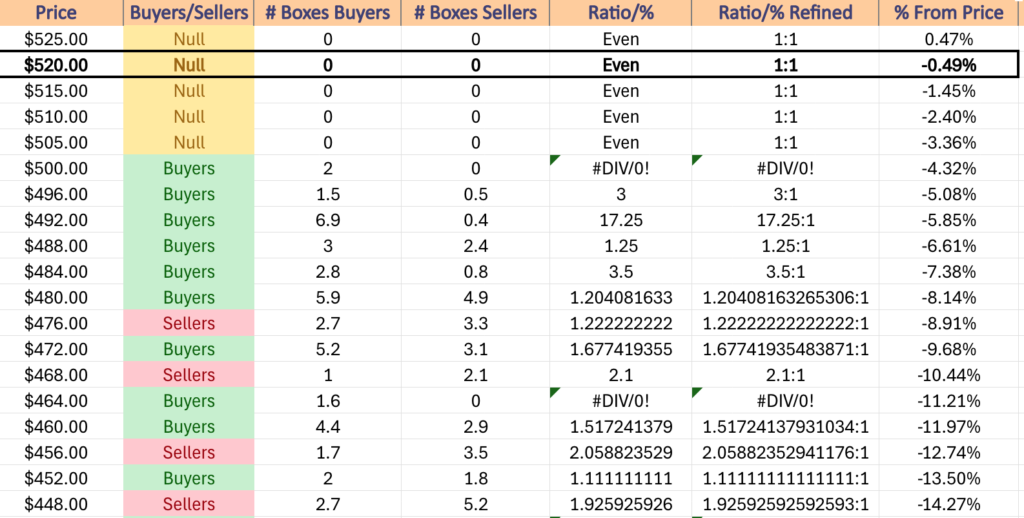
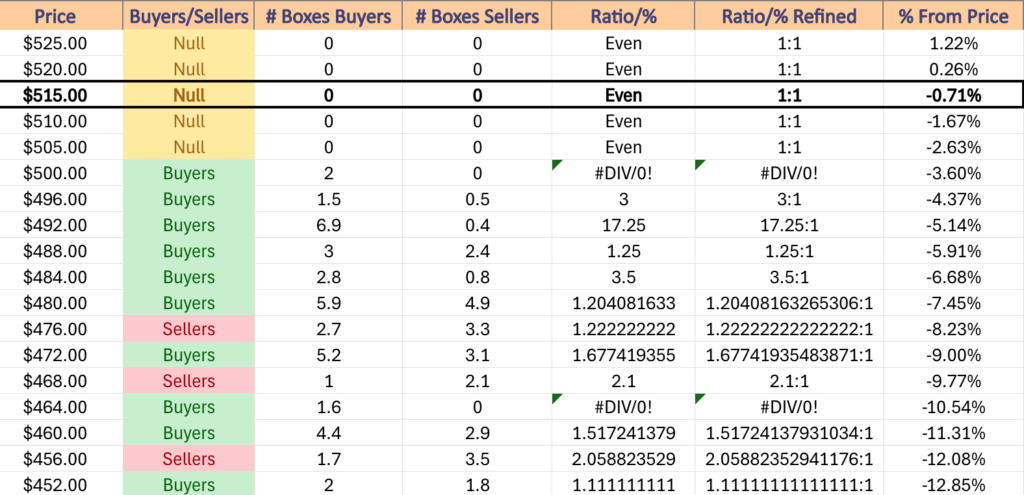
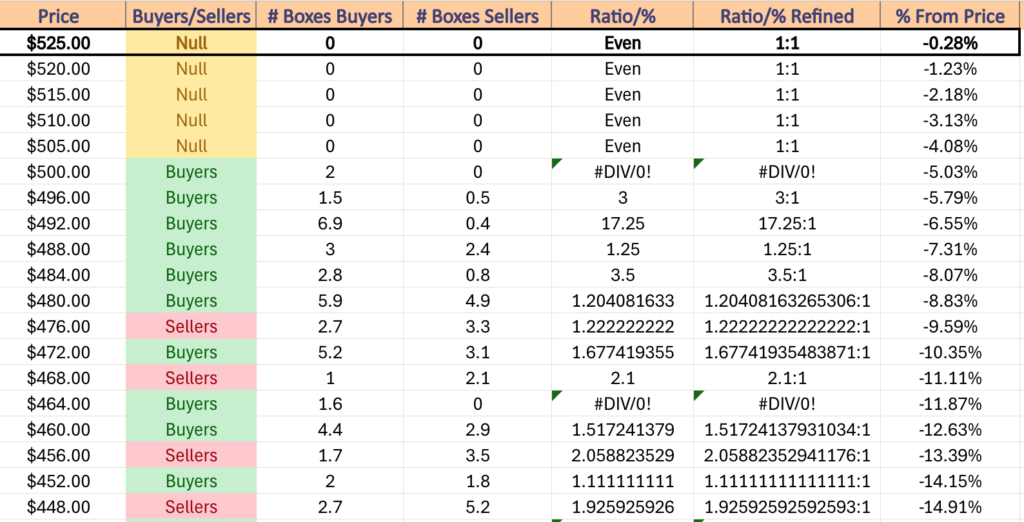
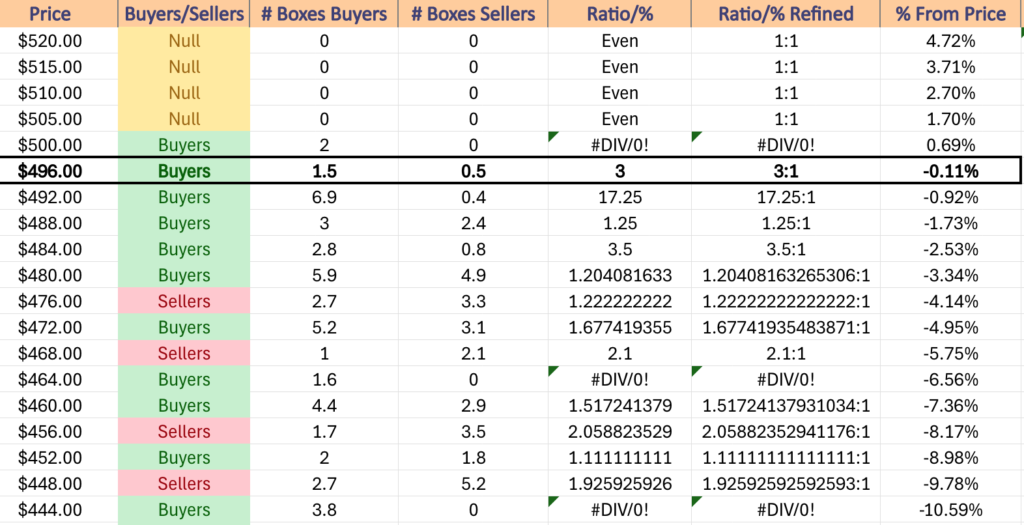
The reason being that once QQQ hits $534.99/share it is in a Seller dominated zone until it reaches $530/share, which is the zone currently housing the two support levels between the price & the 10 DMA.
Things will get tricky from there as then the next support level is the 50 day moving average, which also falls in a Seller zone that is on top of two additional Seller zones historically (see table below) with very sparse support along the way.
With few support levels to gain footing on & so much historic selling activity for the next -5.23% below Friday’s closing price it will make for good reason to watch those moving averages closely.
QQQ has support at the $533.82 (Volume Sentiment: Sellers, 0.6:0*), $531.24 (Volume Sentiment: Sellers, 0.6:0*), $528.15 (10 Day Moving Average, Volume Sentiment: Buyers, 2.86:1) & $522.34/share (50 Day Moving Average, Volume Sentiment: Sellers, 1.18:1) price levels, with resistance at the $538.28/share (All-Time High, Volume Sentiment: Buyers, 0.7:0*) price levels.
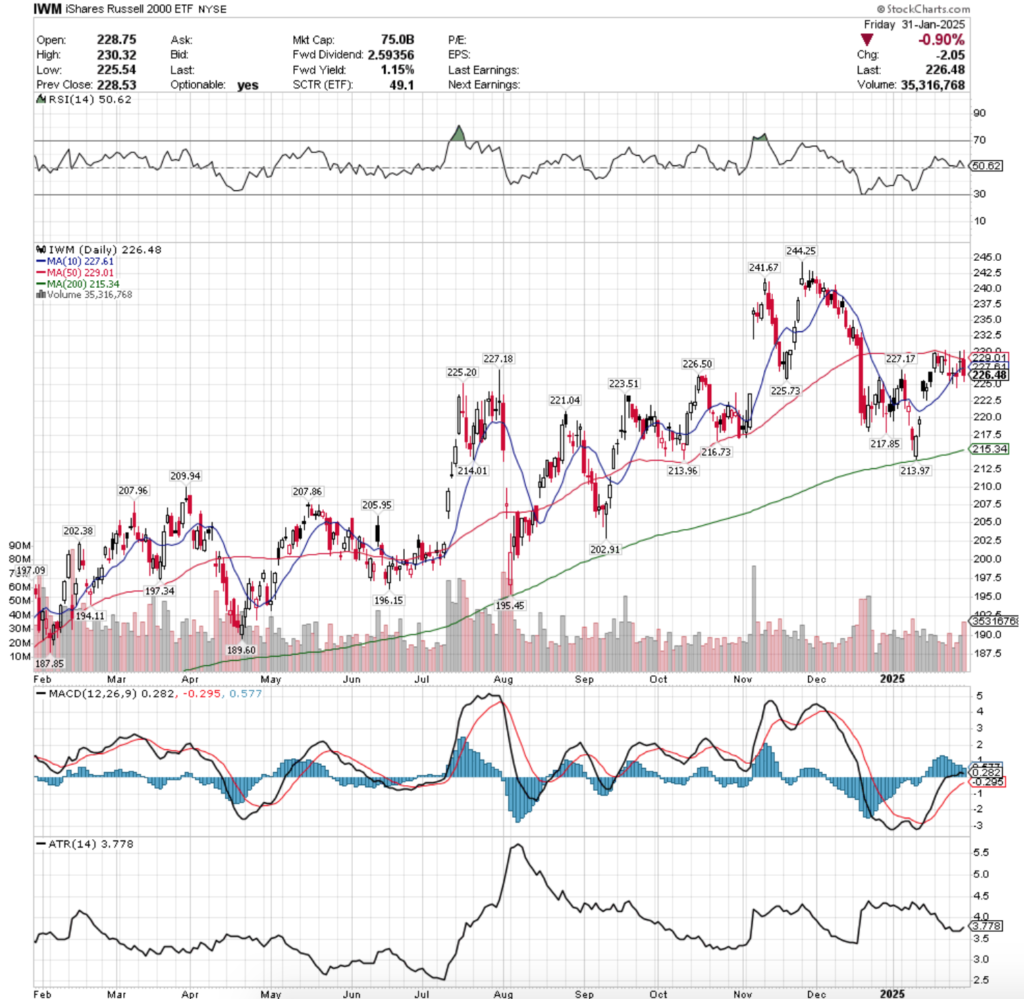
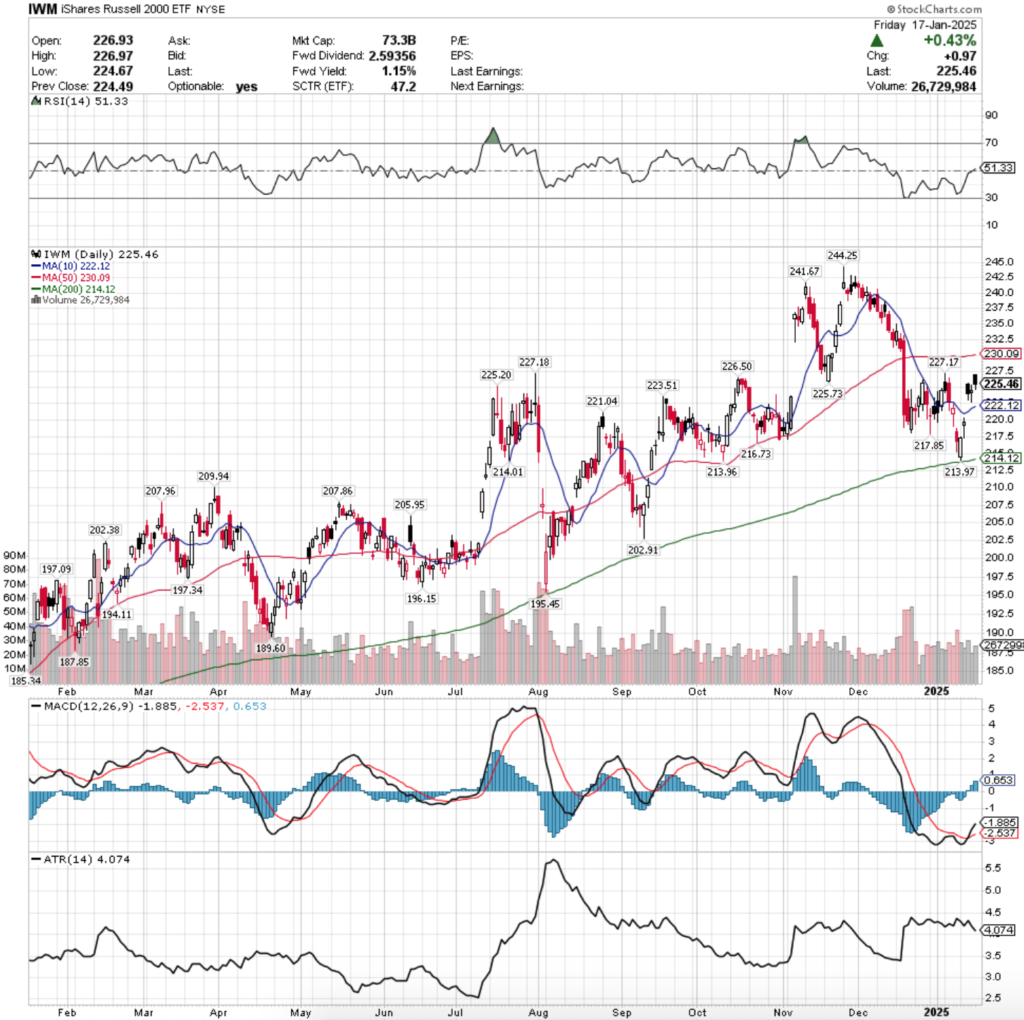
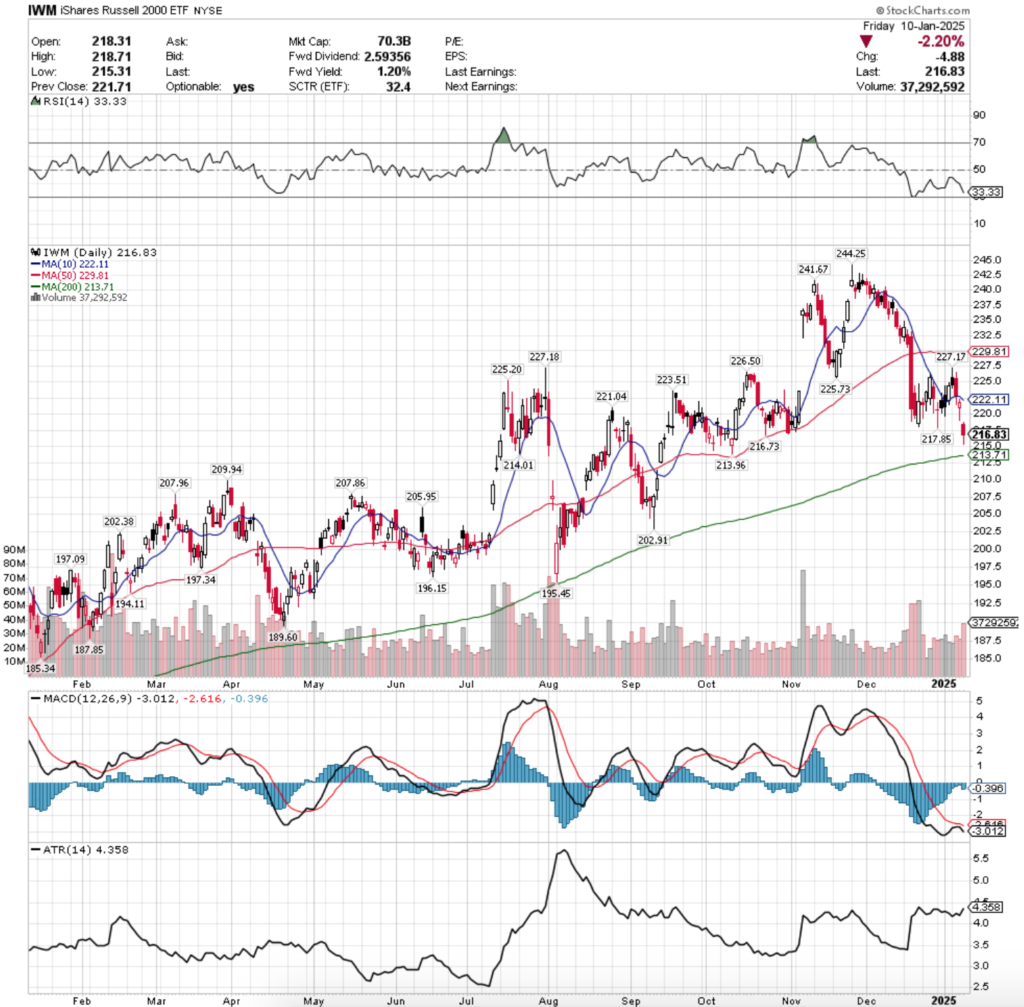
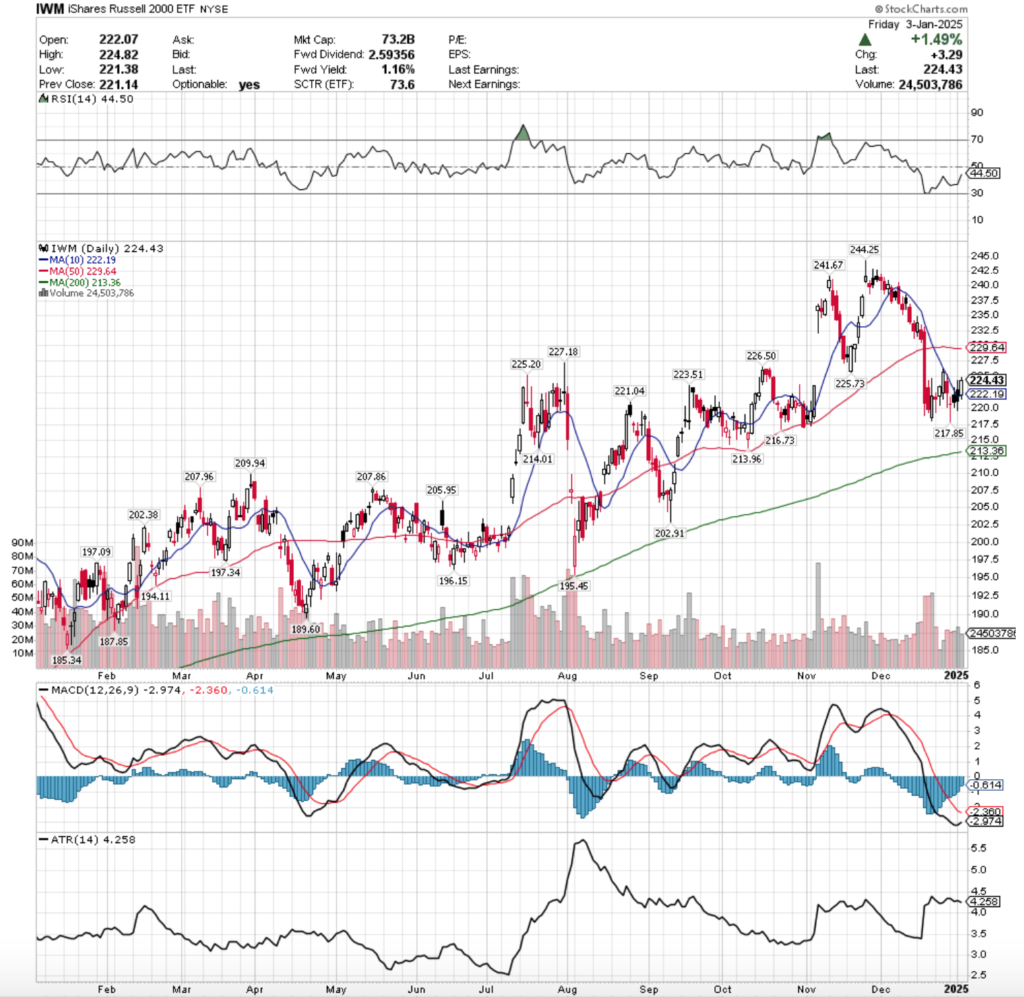
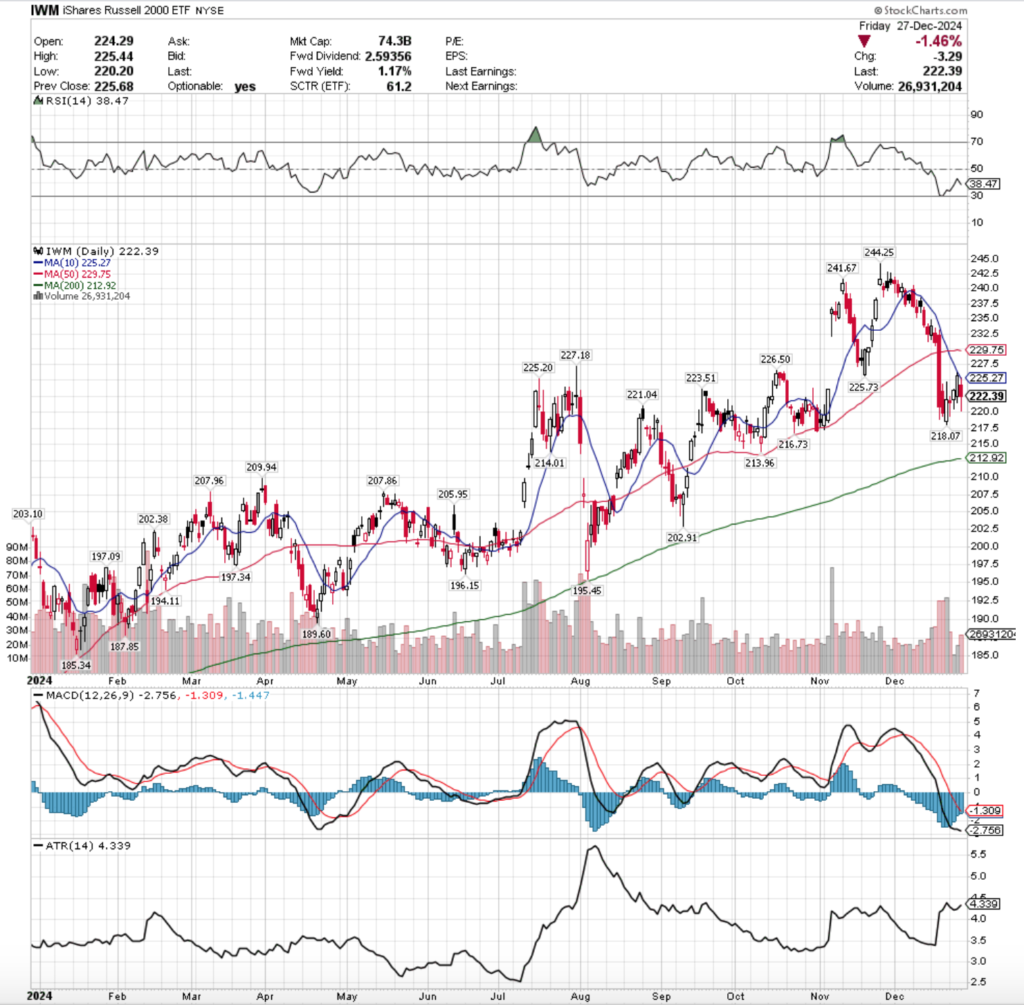
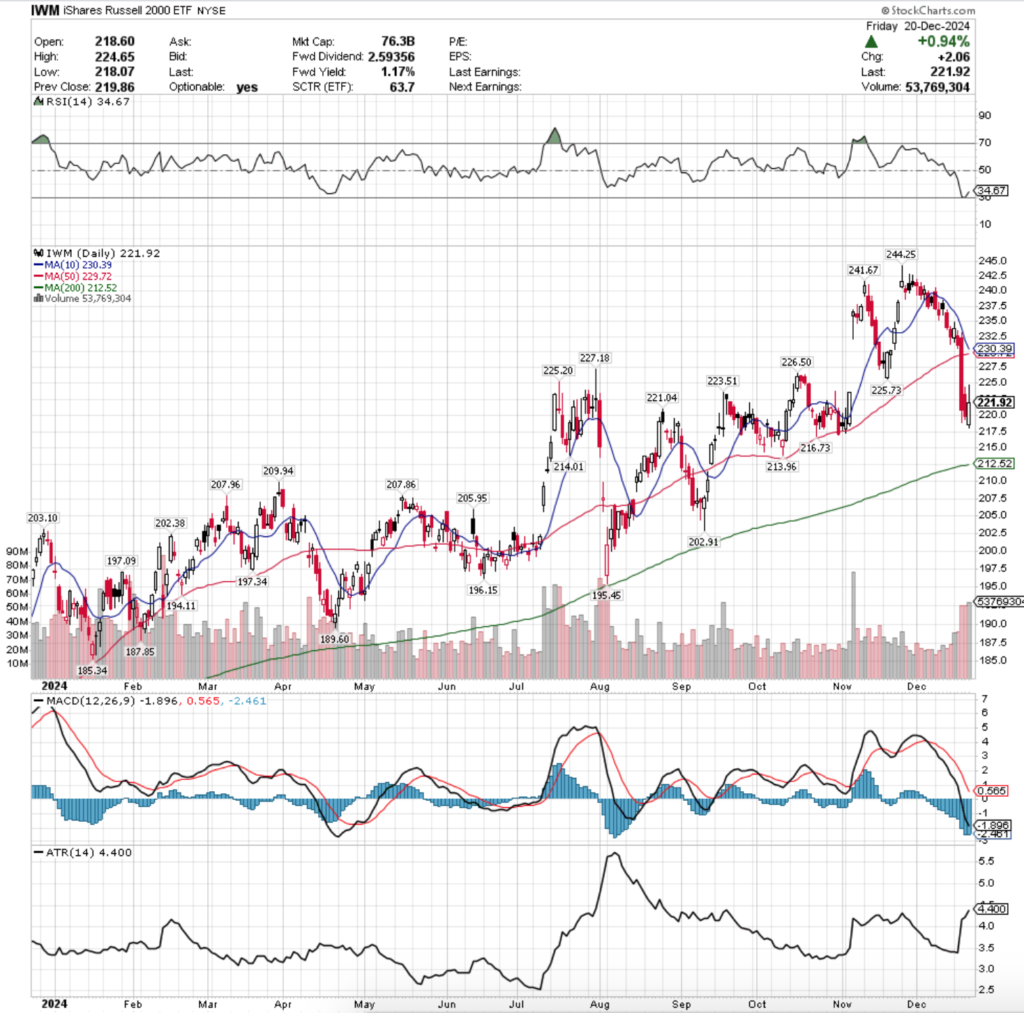
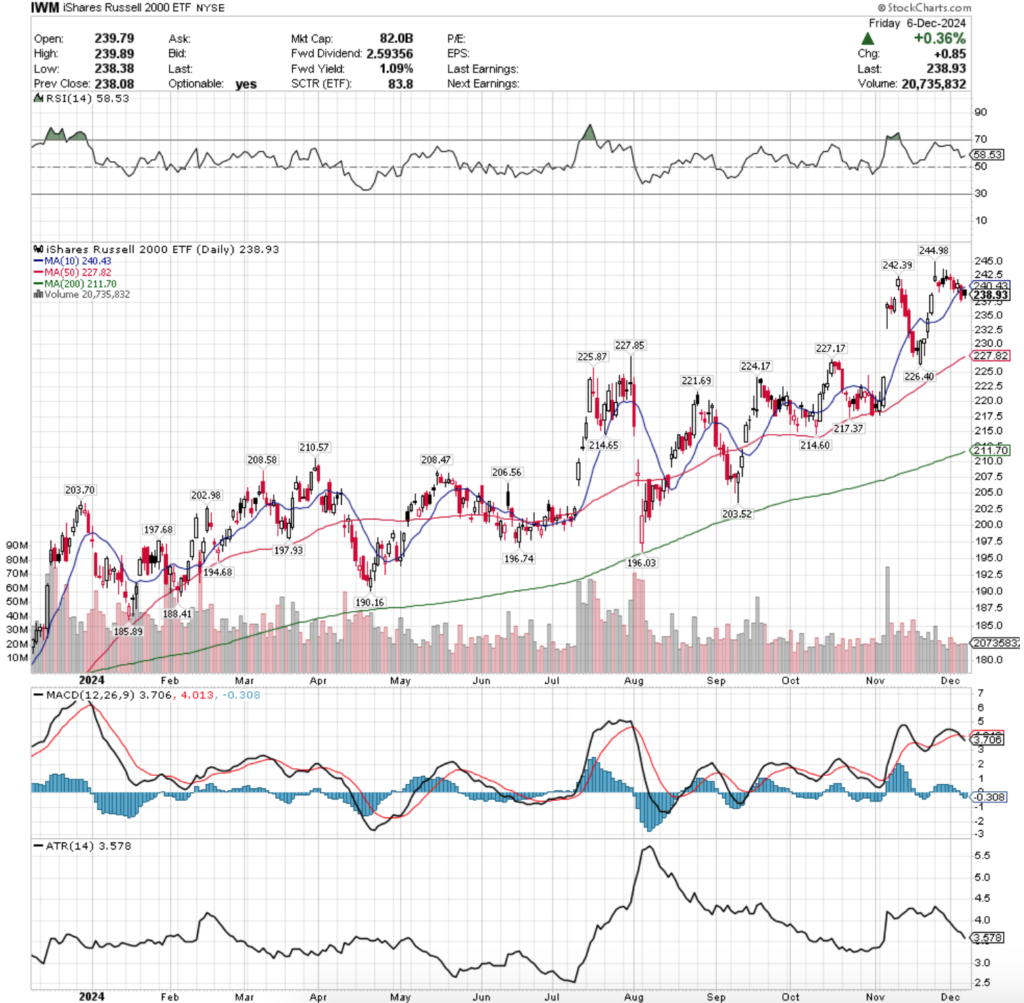
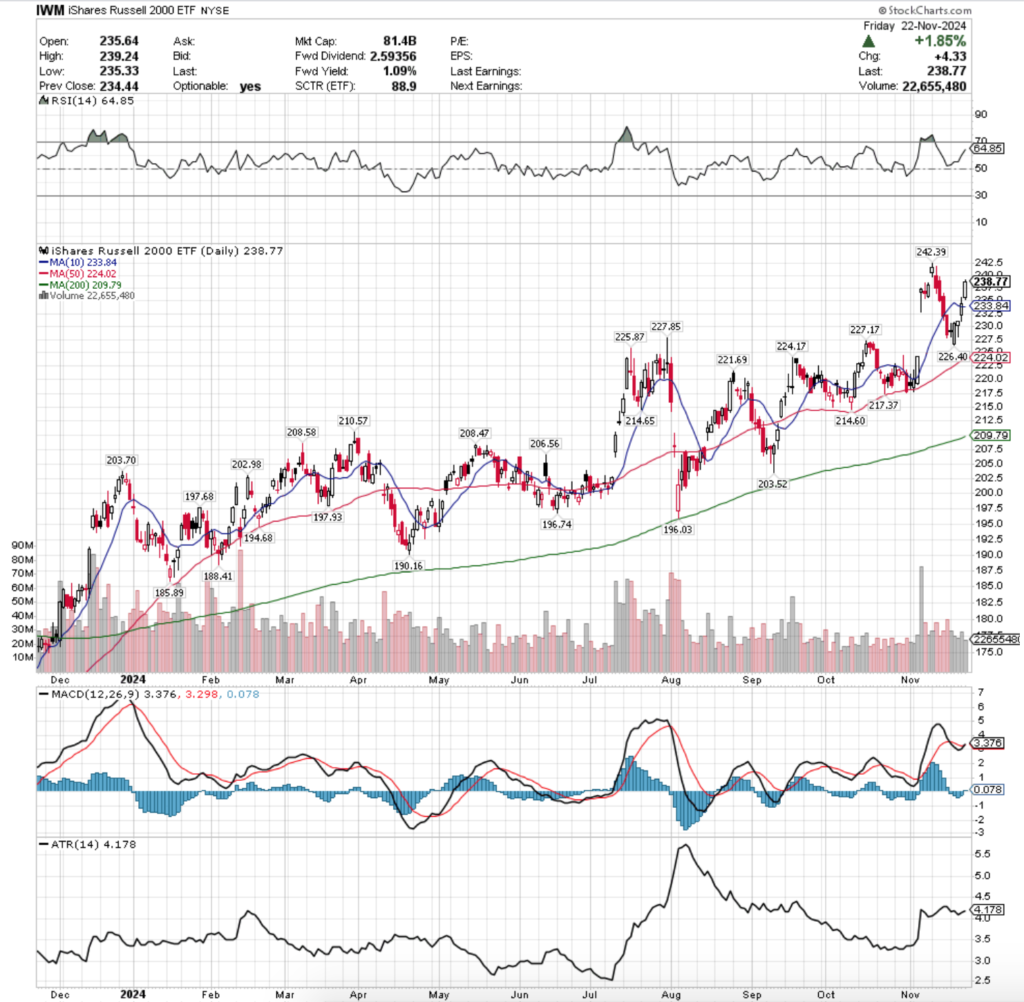
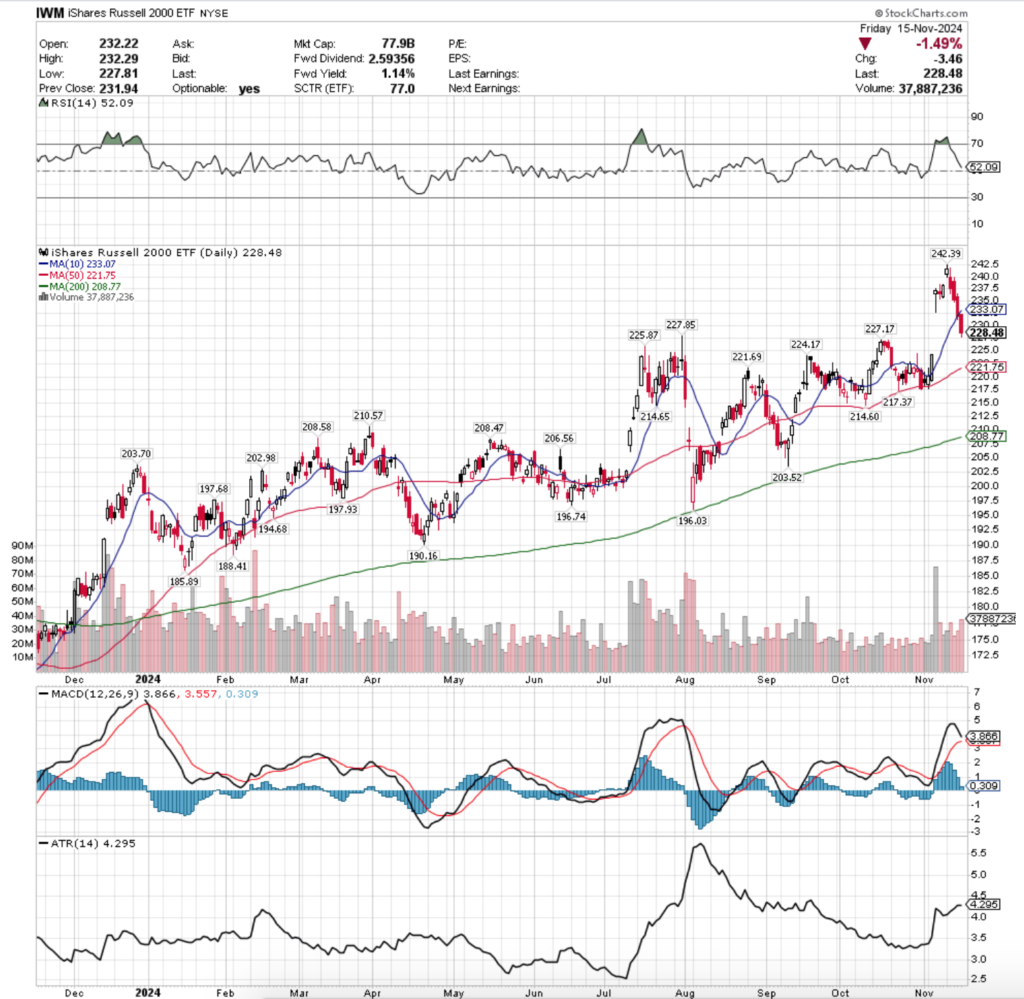
IWM, the iShares Russell 2000 ETF declined -0.01% last week, as the small-cap index was the least favored of the four major index ETFs.
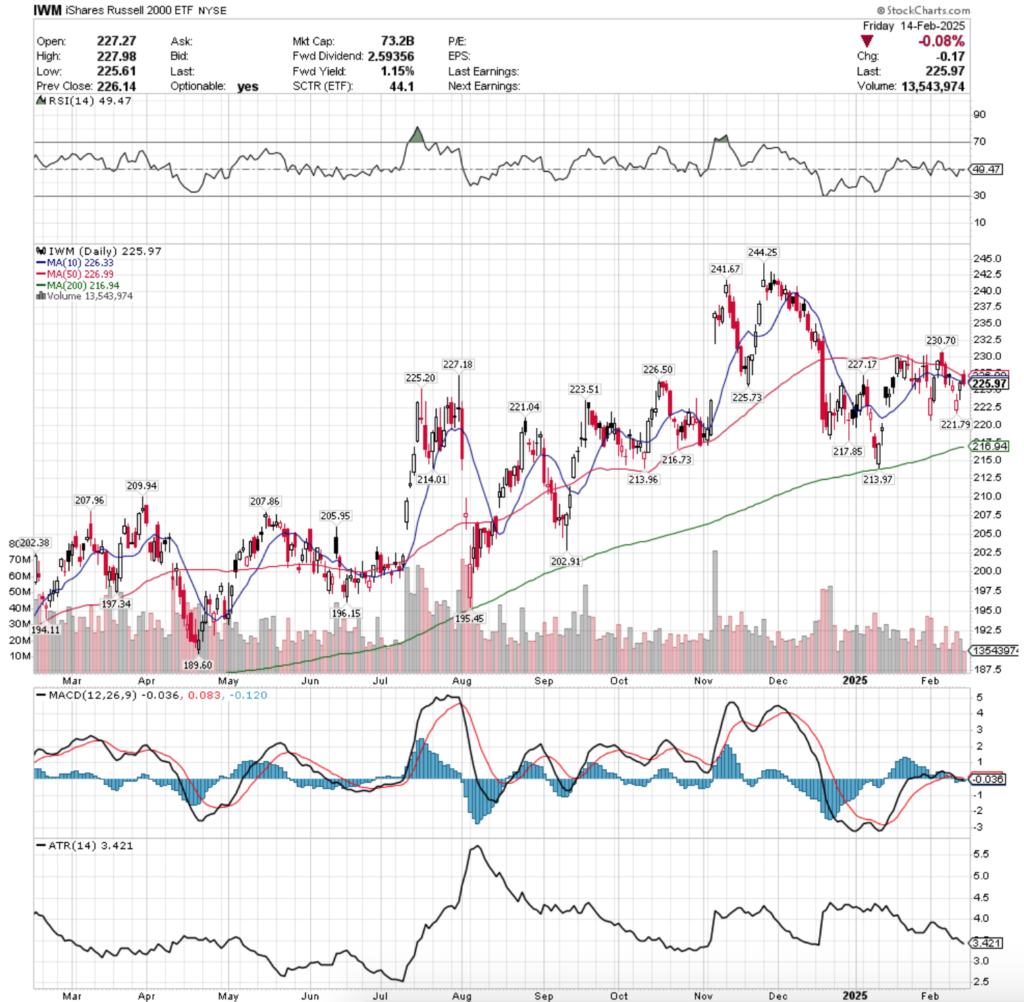
Their RSI is flat, just below the neutral 50 mark & sits currently at 49.47, while their MACD is bearish, but also flat after last week’s performance.
Volumes were -35.77% lower than the previous year’s average (18,670,000 vs. 29,066,135), showing that there is very much a “wait & see” attitude towards the small cap names, as last week IWM basically just tread water.
Compared to last year’s average volume, IWM’s current level is only -15.93% lower, which shows much greater participation than SPY or QQQ as noted above (2/18/2024’s note here).
Monday IWM started off on a troublesome foot, as the day formed a bearish harami pattern with Friday’s candle.
The session opened higher, but proceeded to break down below the 10 day moving average’s support before retracing back to close in-line with the 10 day moving average.
The next day opened on a gap down on stronger volume, but was able to close above its opening price.
Wednesday opened on yet another gap down, tested below the $222.50/share price mark but was able to run higher & closed above its open again, with the upper shadow indicating that there was some slight upside appetite, which was also confirmed by the week’s highest volume.
Thursday saw yet another gap open, but this time to the upside, which led to a retracement back to near Wednesday’s close, but ultimately IWM powered higher to close just beneath the 10 DMA’s resistance on the week’s second strongest volume.
Friday opened on a gap up in-line with the 50 day moving average’s resistance, broke out above it temporarily, before declining to close beneath the 10 DMA’s support.
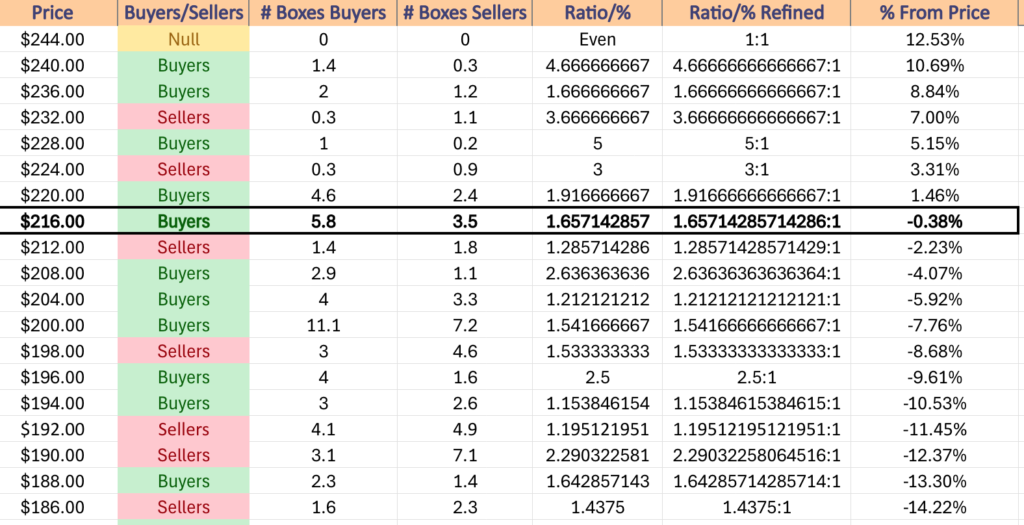
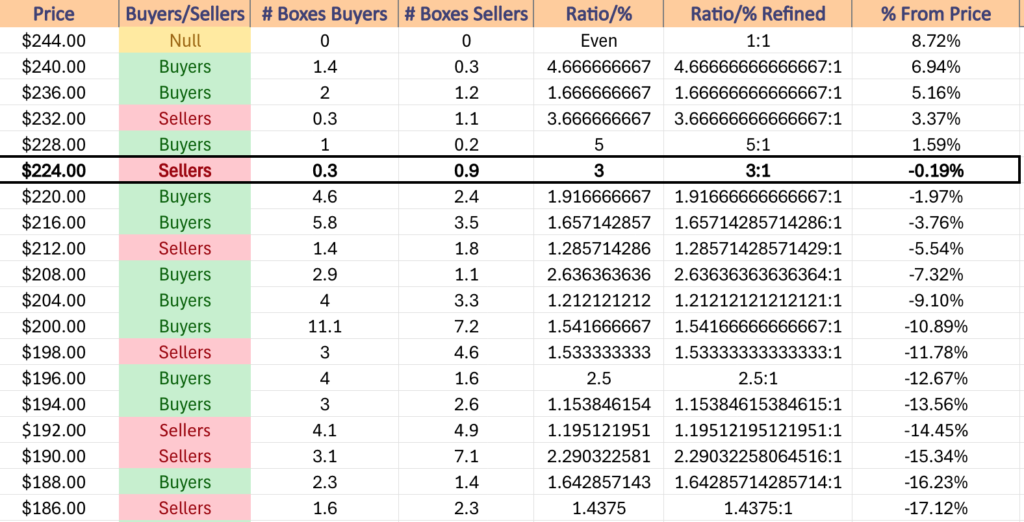
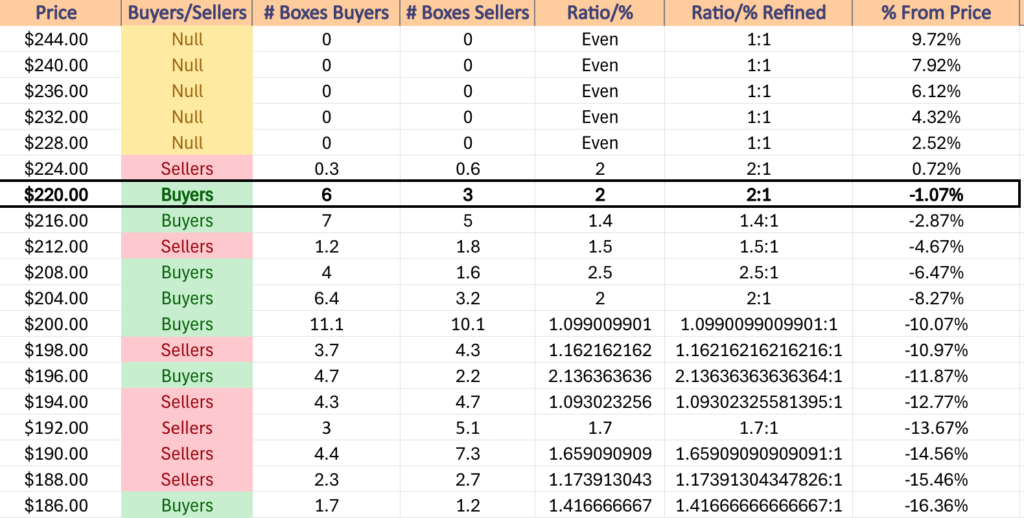
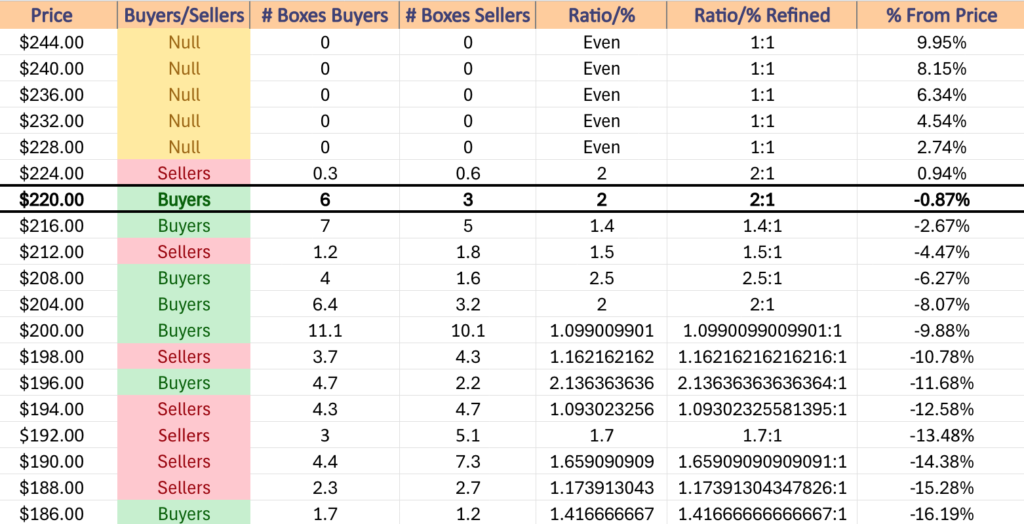
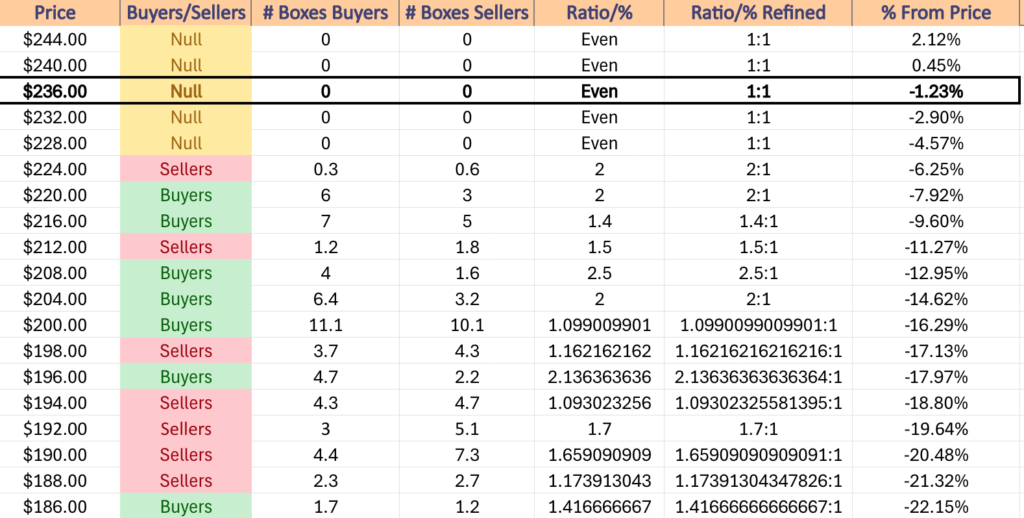
IWM has a lot more local support levels than SPY or QQQ above did, which will help them in the near-term unless there is a broader market selloff that impacts all of the major indexes.
This is also important as their long-term trend line (200 DMA) is currently -4% below Friday’s closing price, and a retest of the long-term trend may not go as well as the one that occurred in early January.
In the coming week it appears like IWM will continue to oscillate around the 10 & 50 DMAs & move more in-line with DIA than SPY & QQQ as market participants digest a lot of uncertainty.
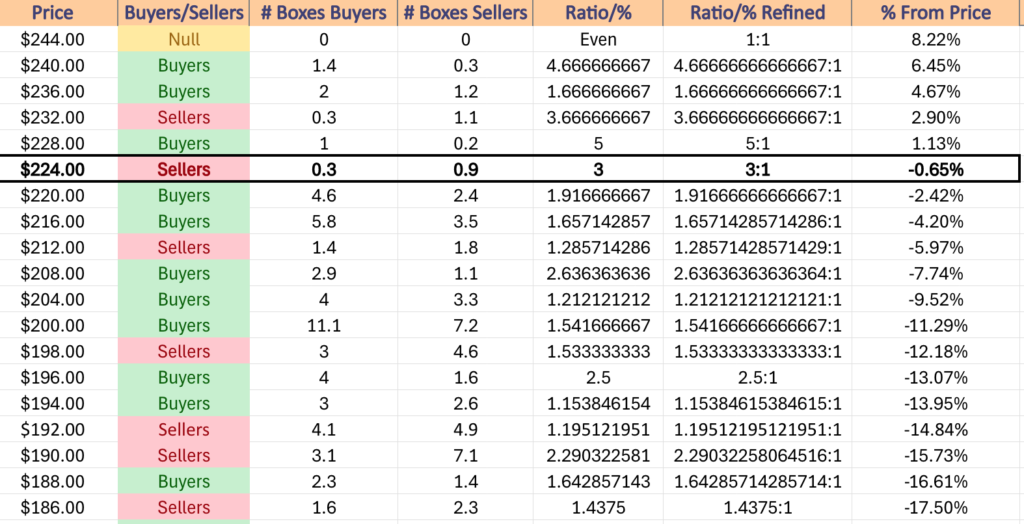
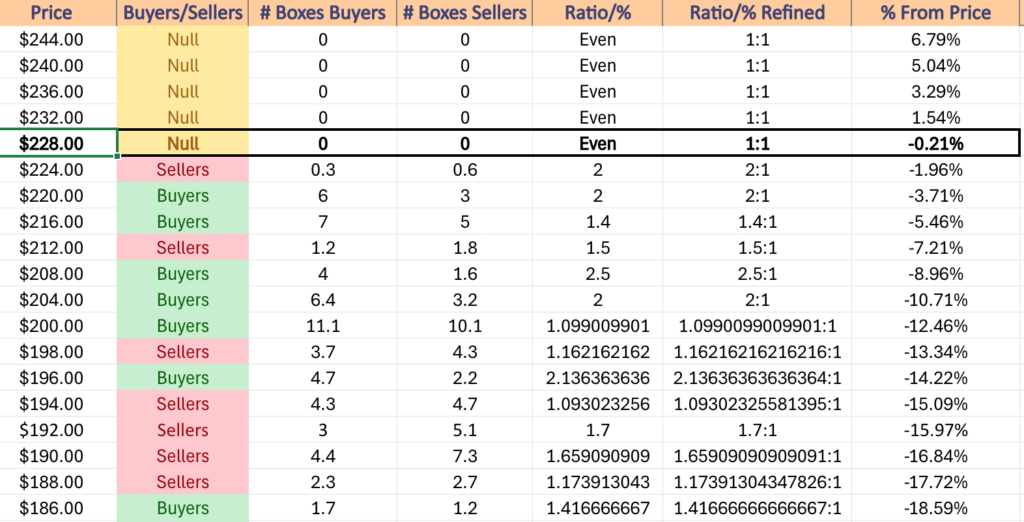
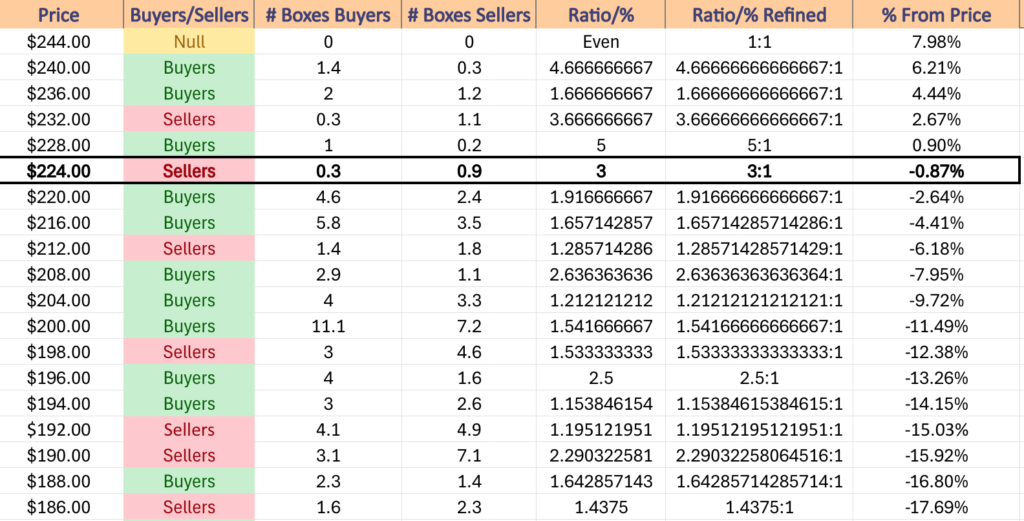
The table below can be used to assess the strength & weakness of the support/resistance levels that IWM encounters.
IWM has support at the $225.73 (Volume Sentiment: Sellers, 3:1), $225.20 (Volume Sentiment: Sellers, 3:1), $223.51 (Volume Sentiment: Buyers, 1.92:1) & $221.79/share (Volume Sentiment: Buyers, 1.92:1) price levels, with resistance at the $226.33 (10 Day Moving Average, Volume Sentiment: Sellers, 3:1), $226.50 (Volume Sentiment: Sellers, 3:1), $226.99 (50 Day Moving Average, Volume Sentiment: Sellers, 3:1) & $227.17/share (Volume Sentiment: Sellers, 3:1) price levels.
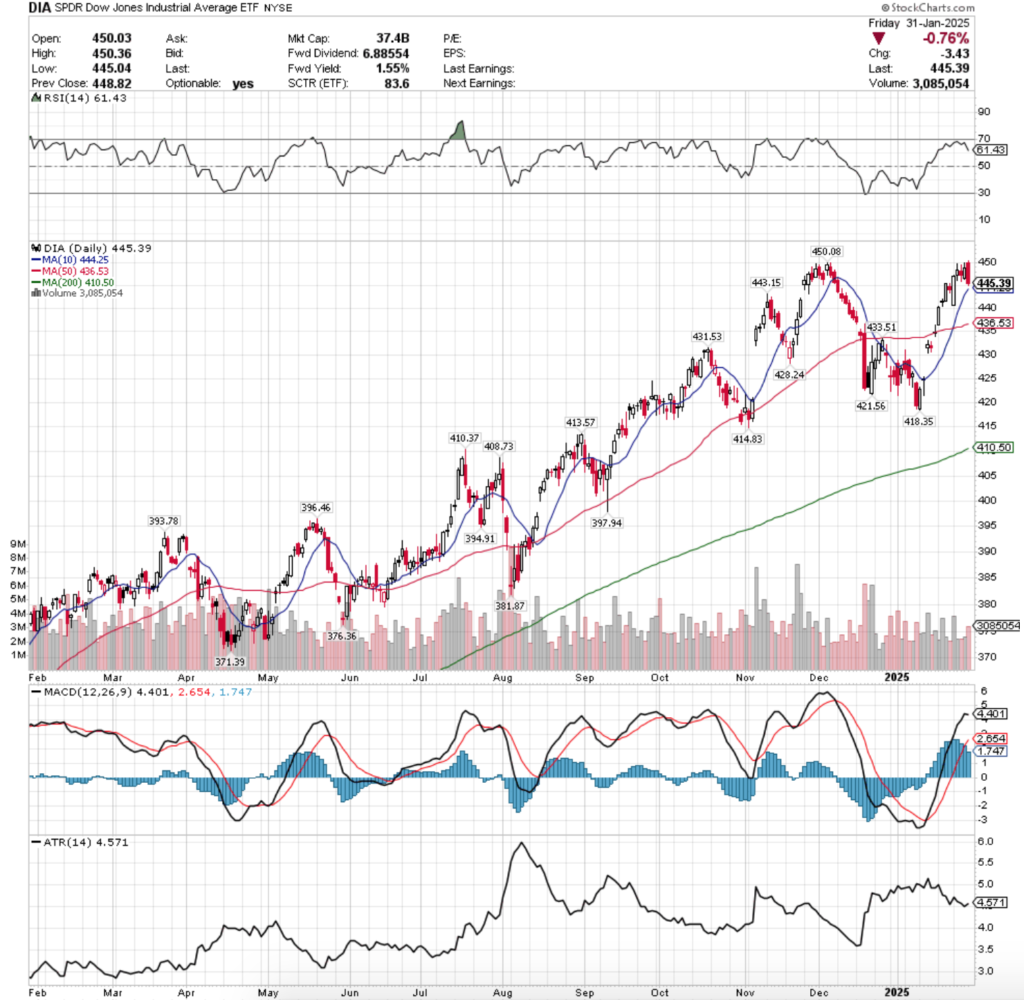
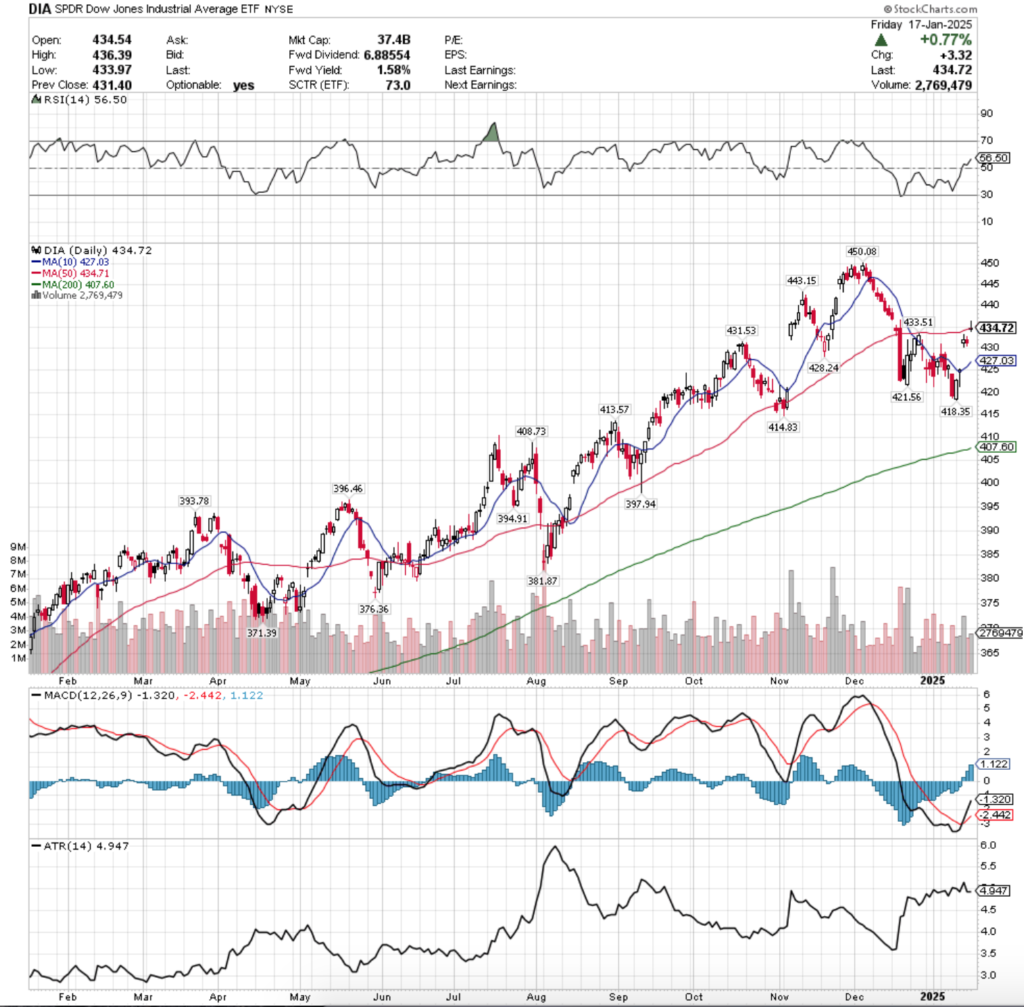
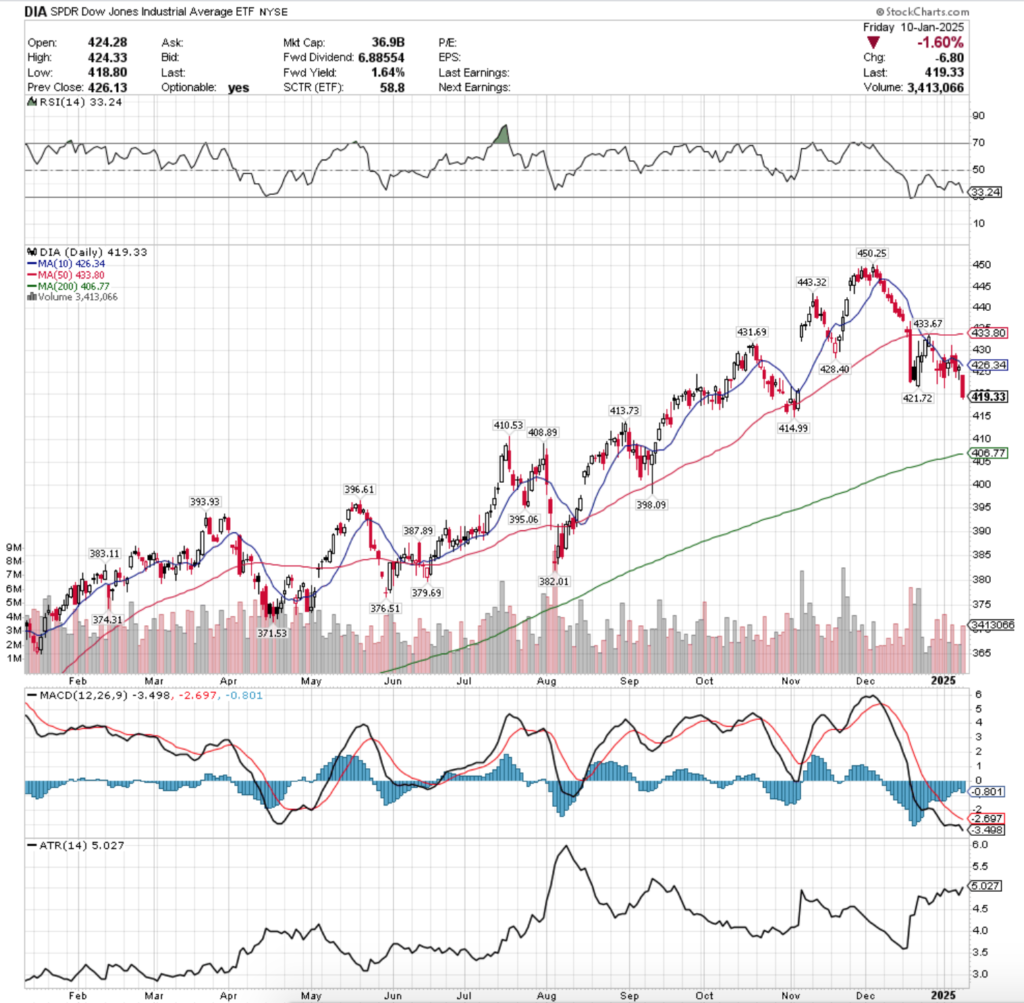
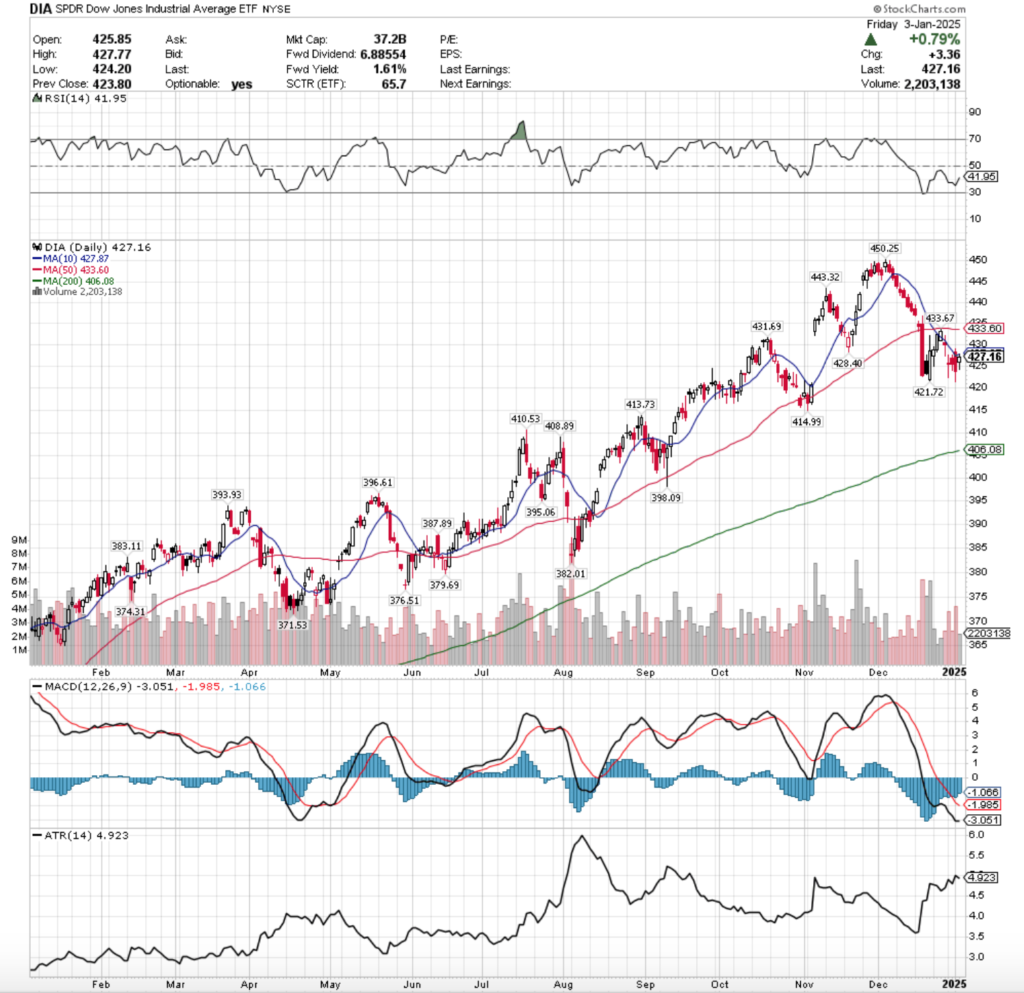
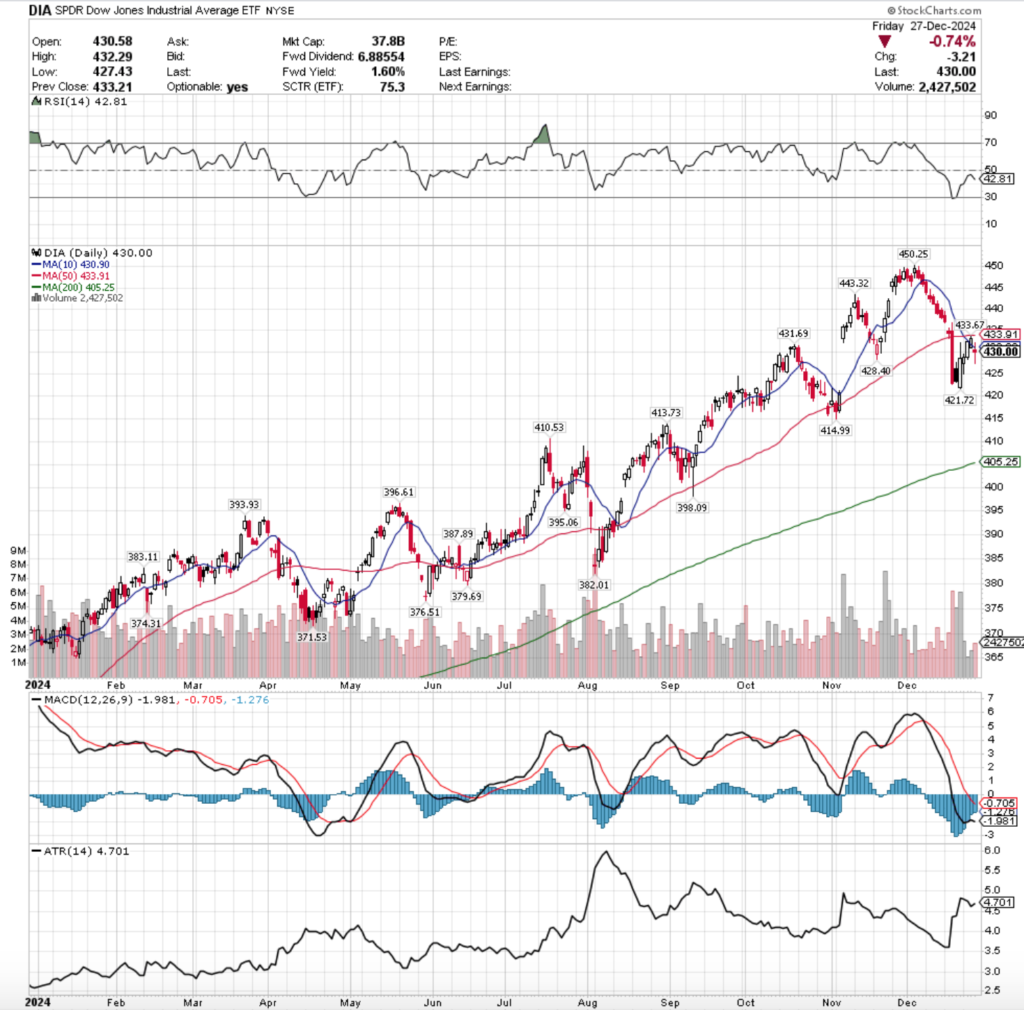
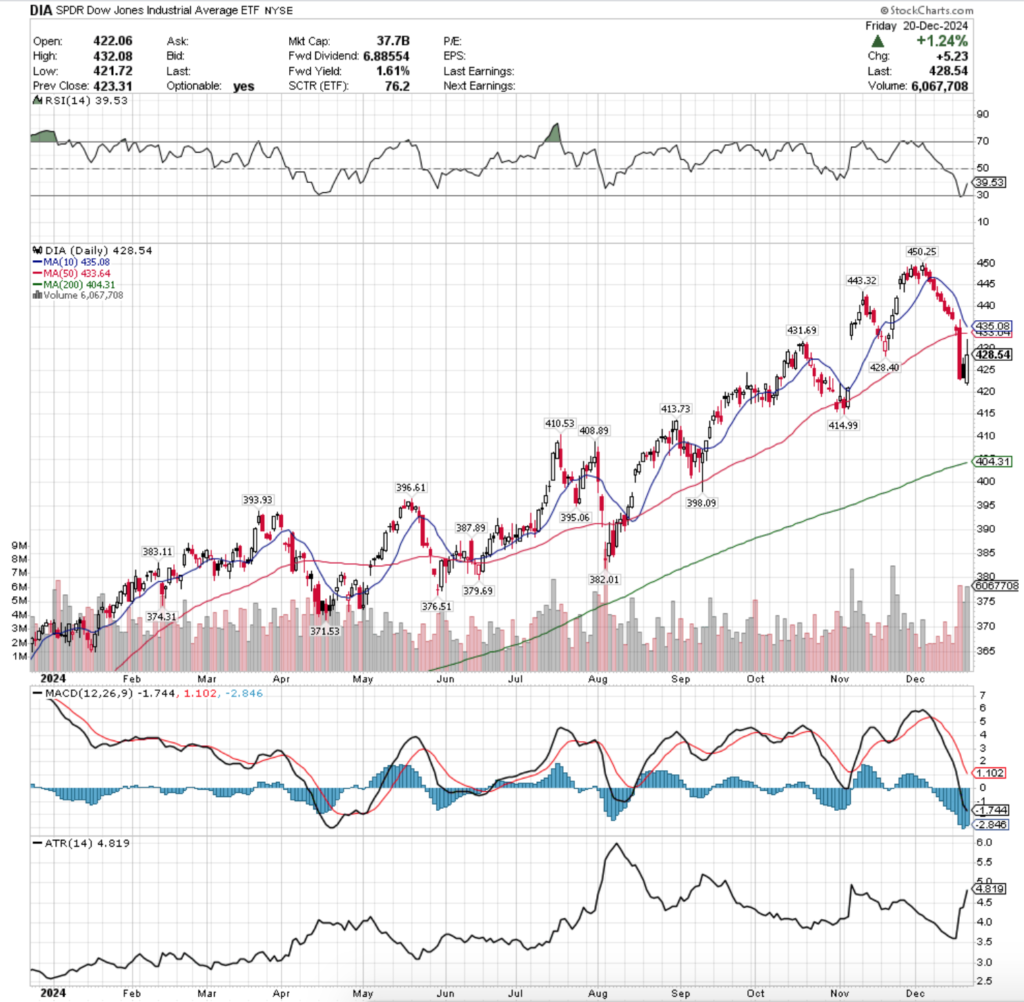
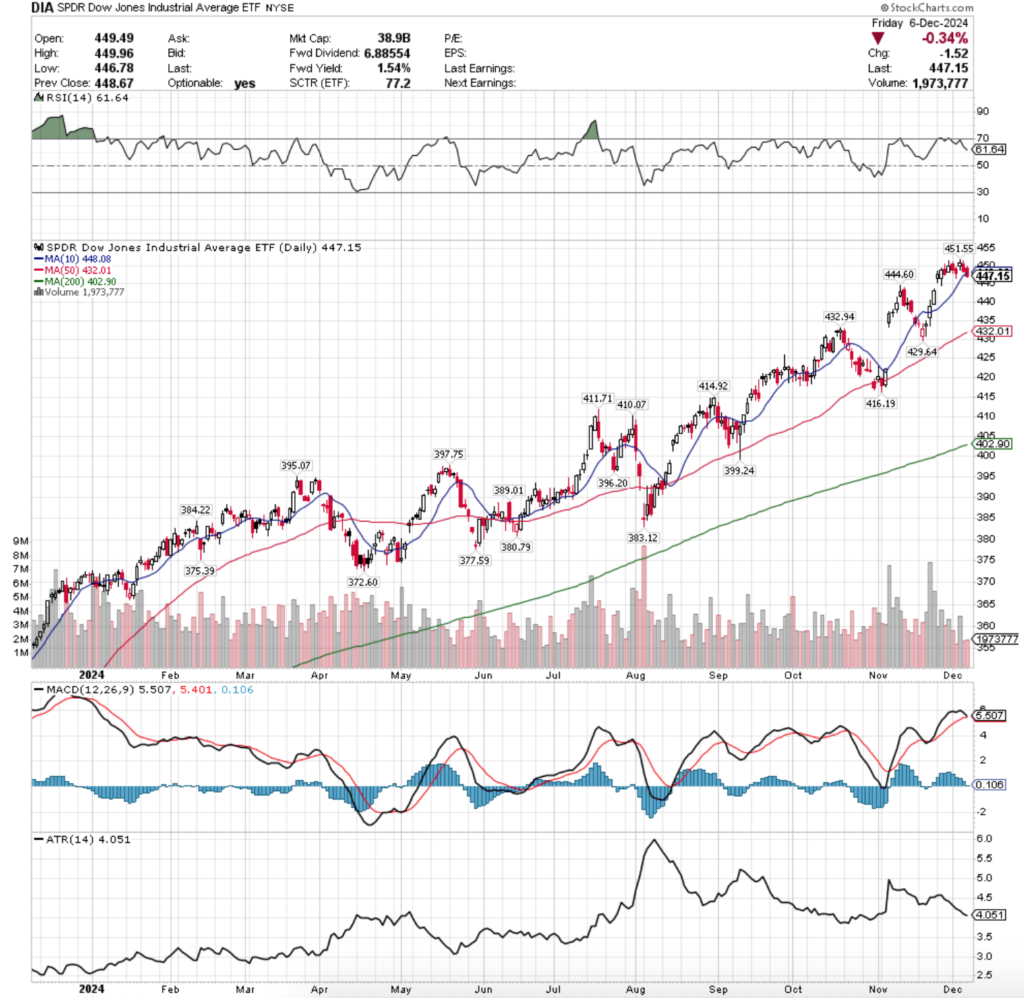
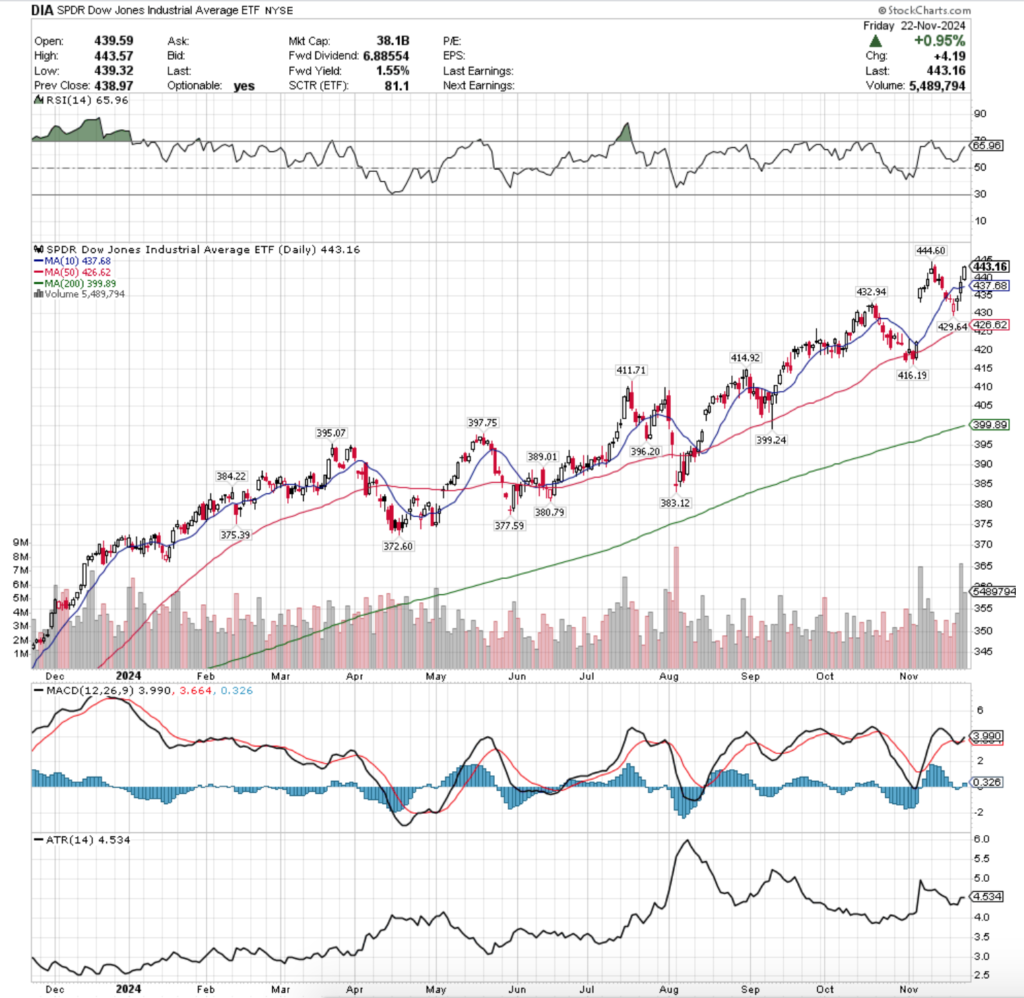
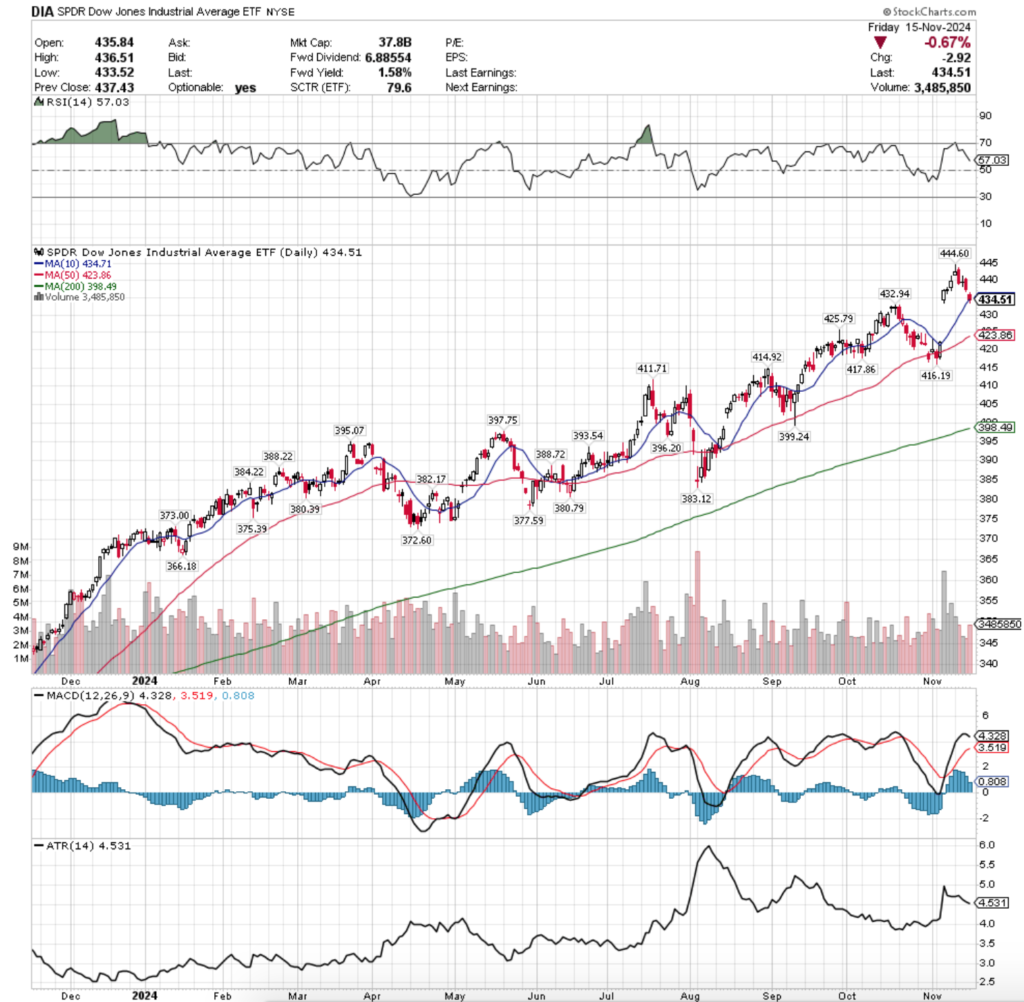
DIA, the SPDR Dow Jones Industrial Average ETF crept up +0.6% last week, as the blue chip index was unable to find any traction to advance on.
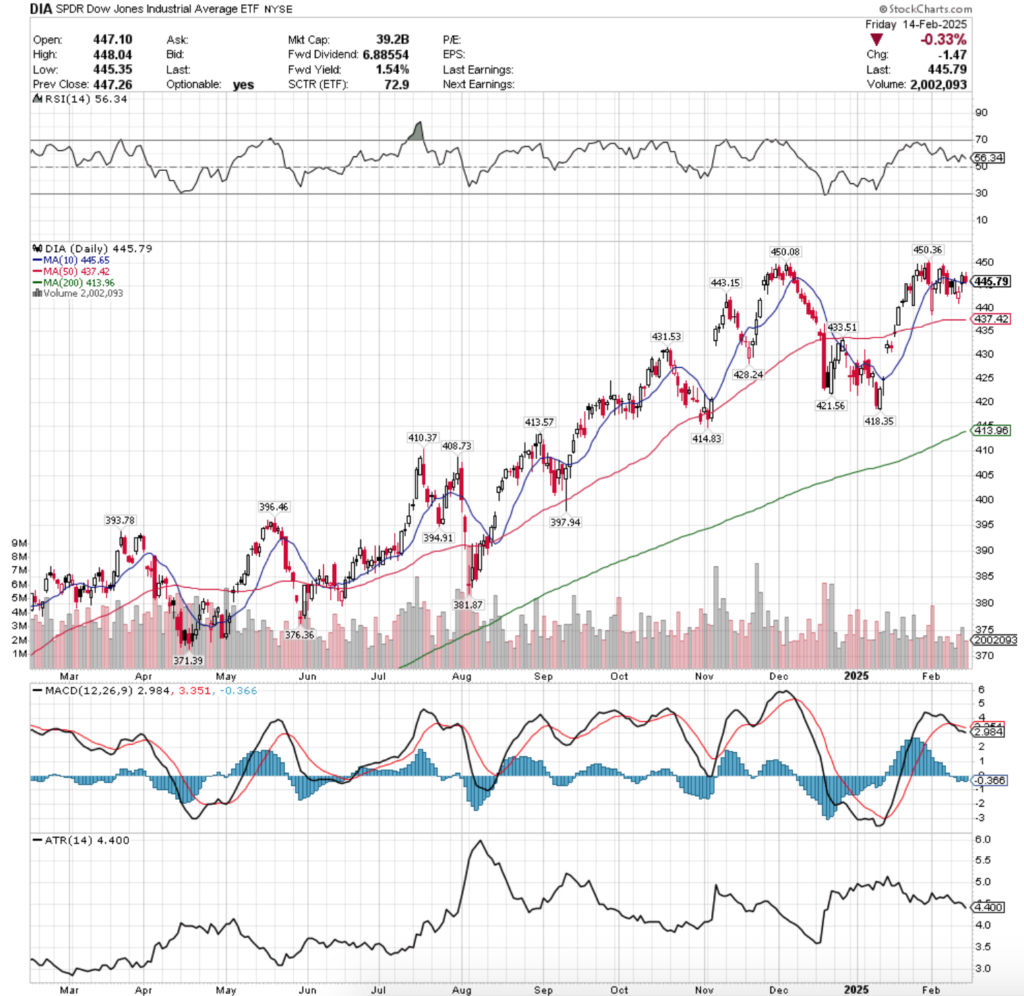
Their RSI is trending back down towards the neutral 50 mark & sits currently at 56.43, while their MACD is bearish but has been flattening out after last week’s consolidation.
Volumes were -34.28% below their previous year’s average level (2,142,000 vs. 3,259,442), which is troubling when you consider how two of the three advancing sessions of the week were on extremely light volume compared to the two declining sessions.
DIA has managed to have the most stable Y-o-Y prior year’s average volume level, with the current one being just -6% below a year ago’s as market participants have clearly favored the security of blue chip stocks.
Much like IWM, DIA opened the week forming a bearish harami pattern with Friday’s hanging man candle, setting the stage for a week of uncertainty based on the unusually low volume.
Tuesday opened lower but was able to rally on another light volume session for form a bullish engulfing pattern that closed in-line with the 10 dya moving average.
Wednesday opened on a gap lower & tested lower before closing above its open, but as a spinning top candle indicating that there was still a great deal of uncertainty in the air.
Thursday the jumpiness continued with a gap up open that was in-line with the 10 DMA’s resistance, before testing lower to Wednesday’s close & then powering higher to close above the 10 DMA.
Friday market participants did not want to be carrying risk into the weekend & it resulted in a -0.33% declining day that closed just above the support of the 10 day moving average.
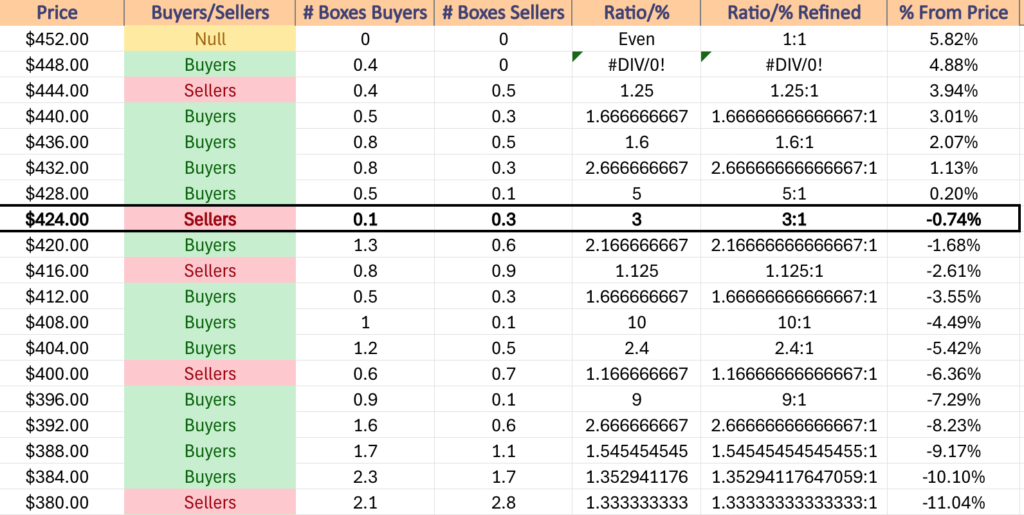
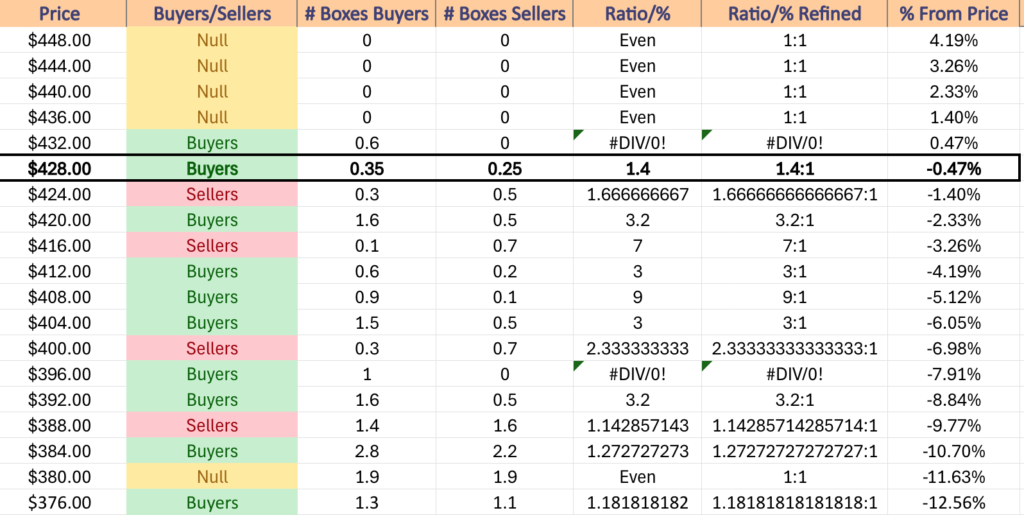
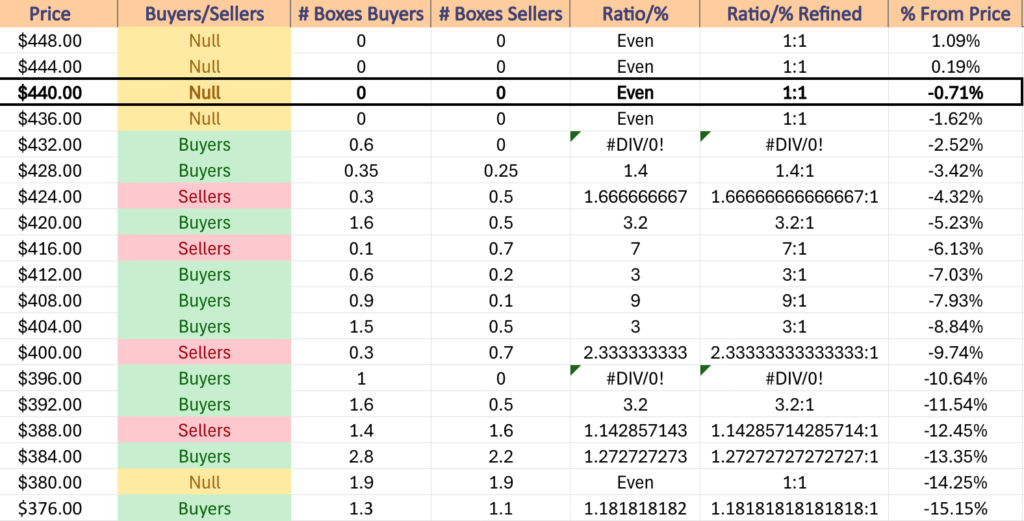
While DIA & IWM have moved in a more similar manner than SPY & QQQ, IWM has spent more time in consolidation ranges than DIA, leading to DIA having less support levels nearby.
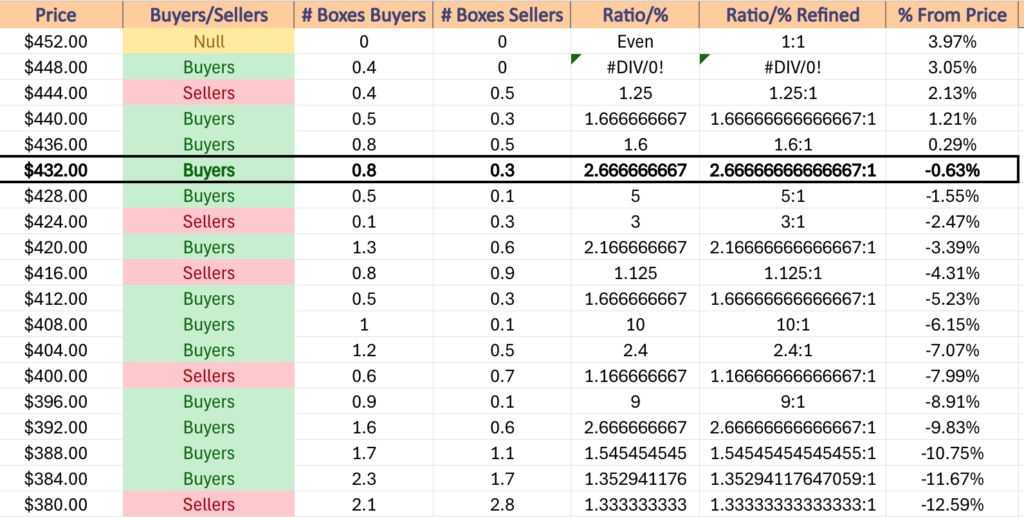
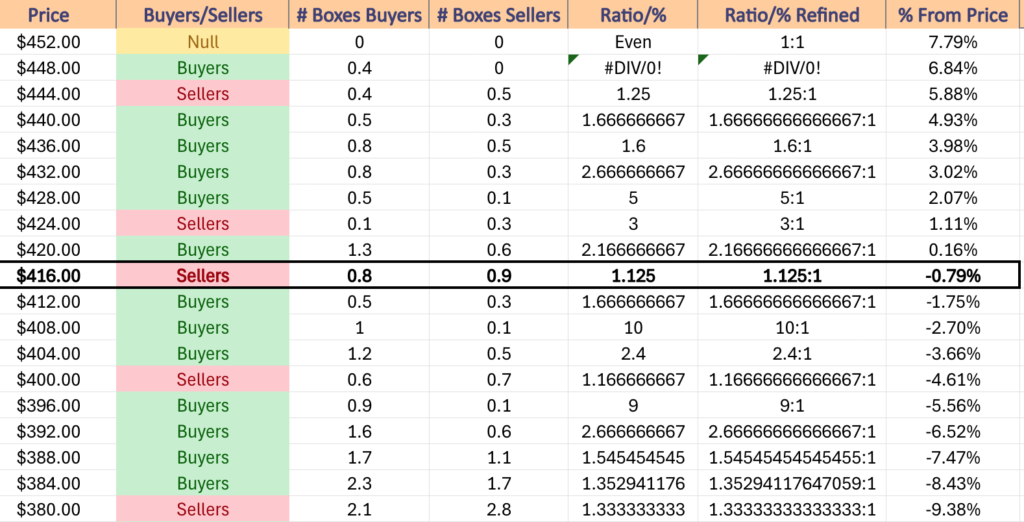
This means it will be important to keep an eye on the volume sentiment at each of their price levels in the coming week(s), particularly as they are currently in a Seller dominated zone over the past 3-4 years at a rate of 1.25:1, which could aid in their price slipping.
Else, without much of an increase in volume it will be difficult to see any meaningful new all-time highs on the horizon that have staying power.
Expect prices to oscillate back & forth around the 10 DMA & between it & the 50 DMA in the coming week, barring any news that leads to a sell off, as DIA has shown resilience among the major indexes with market participants still wanting to buy blue chip names, just at muted levels of participation.
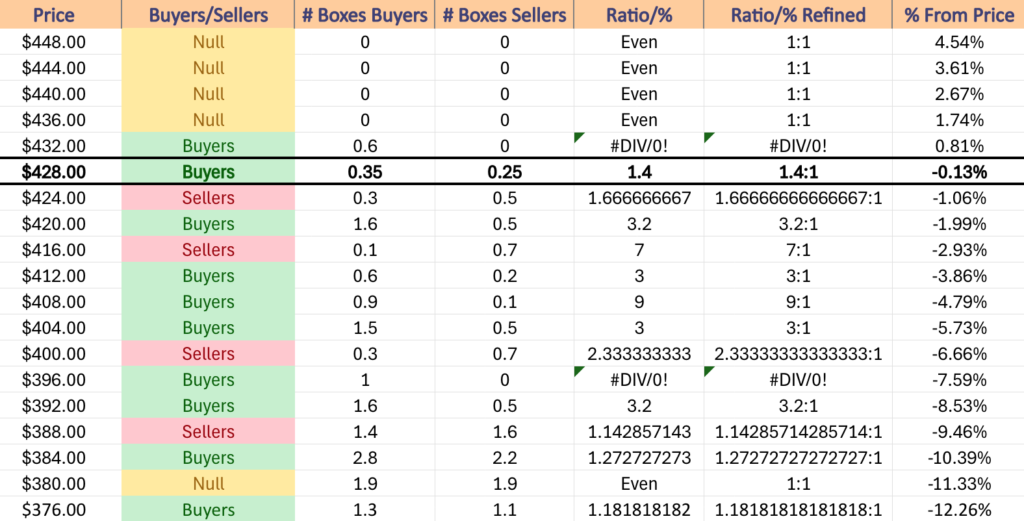
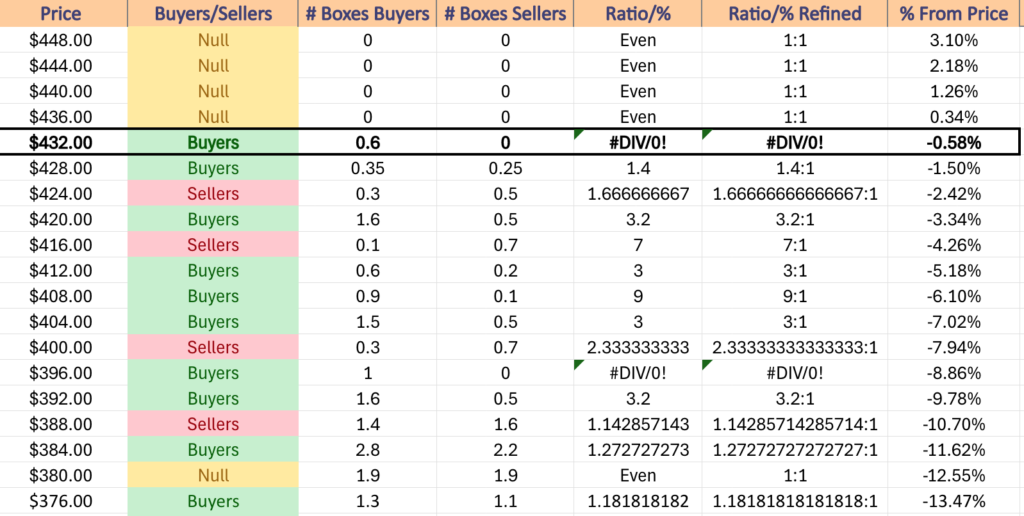
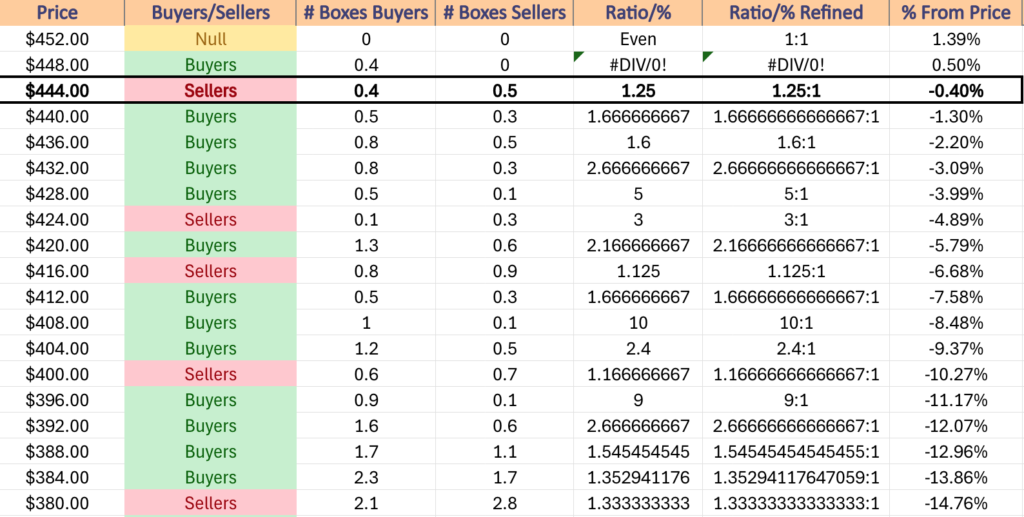
DIA has support at the $445.65 (10 Day Moving Average, Volume Sentiment: Sellers, 1.25:1), $443.51 (Volume Sentiment: Buyers, 1.67:1), $437.42 (50 Day Moving Average, Volume Sentiment: Buyers, 1.6:1) & $433.51/share (Volume Sentiment: Buyers, 2.67:1) price levels, with resistance at the $450.08 (Volume Sentiment: Buyers, 0.4:0*) & $450.36/share (All-Time High, Volume Sentiment: Buyers, 0.4:0*) price levels.
The Week Ahead
Monday the market will be closed for President’s Day, but Fed President Harker speaks at 9:30, Feg Governor Bowman speaks at 10:20 am & Fed Governor Waller speaks at 6 pm & there will be no earnings reports.
The Empire State Manufacturing Survey data is released Tuesday at 8:30 am, followed by Home Builder Confidence Index data at 10 am, Fed President Daly speaking at 10:20 am & Fed Vice Chair for Supervision Barr speaking at 1 pm.
Tuesday morning’s before the bell earnings reports include Allegion, Blackbaud, Chemours, Donnelly Financial, Expeditors International of Washington, Fluor, Franklin Electric, GeneDx, Genuine Parts, Hillman Solutions, Medtronic, NeoGenomics, Sapiens International, TRI Pointe Homes, Valmont Industries, Viking Holdings, Visteon, Vulcan Materials, Watsco & Waystar Holdings, with Andersons, Arista Networks, Bumble, Cadence Design, Celanese, Community Health, Comstock, CoStar Group, CVR Energy, Devon Energy, Element Solutions, EQT Corp., Flowserve, Halozyme Therapeutics, Ingevity, Innospec, International Flavors & Fragrances, James Hardie, La-Z-Boy, Magnolia Oil & Gas, Matador Resources, Occidental Petroleum, Penumbra, Perdoceo Education, RB Global, Rush Enterprises, Select Water Solutions, Shift4 Payments, Sonoco Products, Ternium, Toll Brothers & Unisys due to report after the closing bell.
Wednesday morning brings us Housing Starts & Building Permits data at 8:30 am, followed by the January FOMC Minutes at 2pm & Fed Vice Chair Jefferson speaking at 5 pm.
Amicus Therapeutics, Analog Devices, Appian, Bausch + Lomb, Centuri Holdings, Charles River, Cinemark, Clarivate, Clean Harbors, Enlight Renewable Energy, Enpro, Etsy, First Majestic Silver, Fiverr, Garmin, Gentherm, Gibraltar Industries, Gildan Activewear, Global-E Online, Healthcare Realty, Hudbay Minerals, Ionis Pharmaceuticals, Ionis Pharmaceuticals, KinderCare Learning, Krystal Biotech, Loar Holdings, Louisiana-Pacific, Materion, OGE Energy, OneSpaWorld, Parsons, PROG Holdings, ProPetro, StandardAero, Stepan, Travel + Leisure, Trimble, Wingstop, Wix.com & Wolverine World Wide report earnings before Wednesday’s opening bell, followed by Klaviyo, ACV Auctions, Alamos Gold, American States Water, American Water Works, Amplitude, ANSYS, B2Gold, Bausch Health, BioMarin Pharmaceutical, Carvana, CF Industries, Cheesecake Factory, Churchill Downs, Clearwater Analytics, Coeur Mining, Enovix, Equinox Gold, Exact Sciences, Genco Shipping & Trading, Grand Canyon Education, Herbalife Nutrition, Host Hotels, ICON plc, IMAX, Innovative Industrial Properties, Innovex International, Jackson Financial, Kaiser Aluminum, Manulife Financial, McGrath RentCorp, Mister Car Wash, NerdWallet, Nordson, Northern Oil & Gas, Oceaneering International, ONE Gas, OPENLANE, Orion Engineered Carbons, Pan Am Silver, Park Hotels & Resorts, PRA Group, Remitly Global, Sabra Health Care REIT, SM Energy, SolarEdge Technologies, Sturm Ruger, Tanger Factory, Toast, Trupanion, Vimeo, Vital Energy & Wheaton Precious Metals.
Initial Jobless Claims & Philadelphia Fed Manufacturing Survey data are all released Thursday at 8:30 am, followed by Fed President Goolsbee speaking at 9:35 am, U.S. Leading Economic Indicators data at 10 am, Fed Vice Chair for Supervision Barr speaking at 2:30 pm & Fed Governor Kugler speaking at 5 pm.
Thursday morning kicks off with earnings from Walmart, Alight, Americold Realty Trust, Ardelyx, Autohome, Bandwidth, BigCommerce, Bilibili, Birkenstock Holding, Builders FirstSource, Cameco, Cenovus Energy, CenterPoint, Cheniere Energy, Choice Hotels, Constellium, Core Natural Resources, Cushman & Wakefield, Dana, DigitalBridge, Dun & Bradstreet, Endava, Enviri Corp, EPAM Systems, ESAB, Freshpet, FTI Consulting, Hasbro, IdaCorp, Insmed, Integer Holdings, Lamar Advertising, Laureate Education, Leonardo DRS, LKQ, Nutrien, Pediatrix Medical Group, Pool, Primo Brands Corp, Quanta Services, Reliance, Repligen, Sabre, Shake Shack, Southern, SpringWorks Therapeutics, Teck Resources, Tempur Sealy International, Trinity Industries, TripAdvisor, Unity Software, Upbound Group, Utz Brands & Wayfair before the opening bell, with Booking Holdings, ACCO Brands, Akamai Technologies, Alarm.com, Alliant Energy, American Homes 4 Rent, AMN Healthcare, Barings BDC, BJ Restaurants, Block, Boise Cascade, CarGurus, Con Edison, Dropbox, Employers Holdings, Evolent Health, eXp World Holdings, Fidelity National, Five9, Floor & Decor, Frontier Communications, Gaming and Leisure Properties, Glaukos, Globus Medical, Grid Dynamics, Guardant Health, indie Semiconductor, Insulet, iRhythm, Live Nation, MP Materials, Newmont Corp, NV5 Global, Rackspace Technology, Resideo, RingCentral, Rivian Automotive, Ryan Specialty Group, Ryman Hospitality, Select Medical, Sprouts Farmers Market, Texas Roadhouse, Universal Display, VICI Properties, Vicor & World Kinect all due to report after the session’s close.
Friday the week winds down with S&P Flash U.S. Services PMI & S&P Flash U.S. Manufacturing PMI data at 9:35 am, followed by Consumer Sentiment (final) & Existing Home Sales at 10 am, and Fed Vice Chairman Jefferson & Fed President Daly speaking at 11:30 am.
Atmus Filtration Technologies, Balchem, Brady, Oil States, Sunstone Hotel, Telephone & Data, TXNM Energy & Uniti Group are all due to report earnings on Friday morning before the session’s open.
See you back here next week!
*** I DO NOT OWN SHARES OR OPTIONS CONTRACT POSITIONS IN SPY, QQQ, IWM OR DIA AT THE TIME OF PUBLISHING THIS ARTICLE ***