It’s been about two months since the last check in of the major index ETF’s price level:volume sentiment & a lot has happened in that time.
Markets have continued to grind higher though in the face of the US Presidential Election, bad weather events causing widespread damage & today’s PPI print coming in hotter than expected after two straight consecutive rate cuts & all of the major index ETFs sit near their all-time highs.
The VIX is currently at 14.13 after remaining elevated for the month of October & now shows an implied one day move of +/-0.89% & an implied one month move of +/-4.08%.
With the election results seeming to have calmed the market’s nerves quite a bit it is time to run through the Buyer:Seller sentiment at each price level that the major indexes have traded at over the past few years.
This may shed light into how market participants will behave if the same price levels are entered/re-tested again in the near future.
As noted in the last note, due to the markets being near all-time highs there are many price levels that lack enough information to make a reading on, but that have been traded at, which will be denoted as “NULL”, most of which occur near the extreme highs & lows of the listed ranges below.
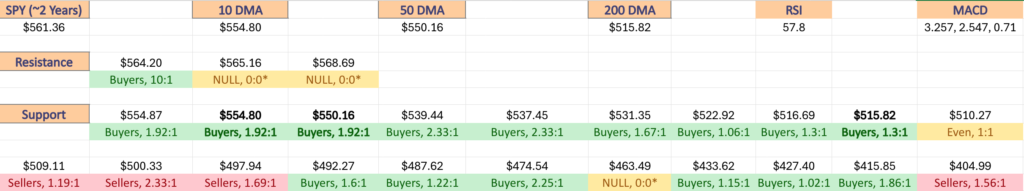
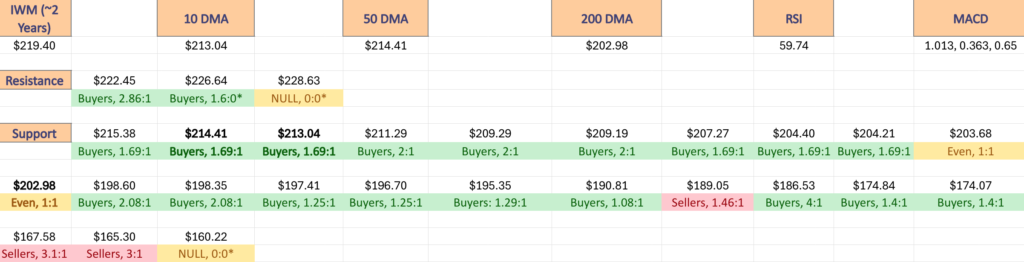
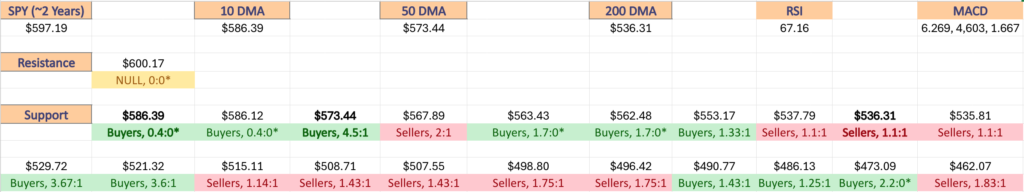
Each section below contains a view of each index ETF’s chart (for a technical breakdown of each ETF’s chart please see this past weekend’s market review note), as well as a list of their current one year support & resistance levels with the volume sentiment noted beneath it on the table.
There is an additional table beneath this table with each price level’s sentiment, as well as a typed text version below that is able to be copied & pasted.
Note that “NULL, 0:0*” values denote areas that each name has traded at but with limited volume data to work with from a comparison standpoint in terms of creating a ratio of buyers:sellers (or vice versa).
Also, prices that do have a ratio of Buyers:Sellers (Sellers:Buyers) where the denominator is 0 are denoted with an asterisk “*” as well.
In the written lists of the price levels & volume sentiments the price levels that contain support & resistance levels are marked in BOLD.
Recall that at price extremes such as the highs that we have recently hit there will tend to be skewed data due to the small sample size & factor that into how you interpret each price level’s reported sentiment.
This is intended to serve as an additional tool, similar to a barometer to use during your due diligence process & is not meant to replace doing your own research & is not financial advice.
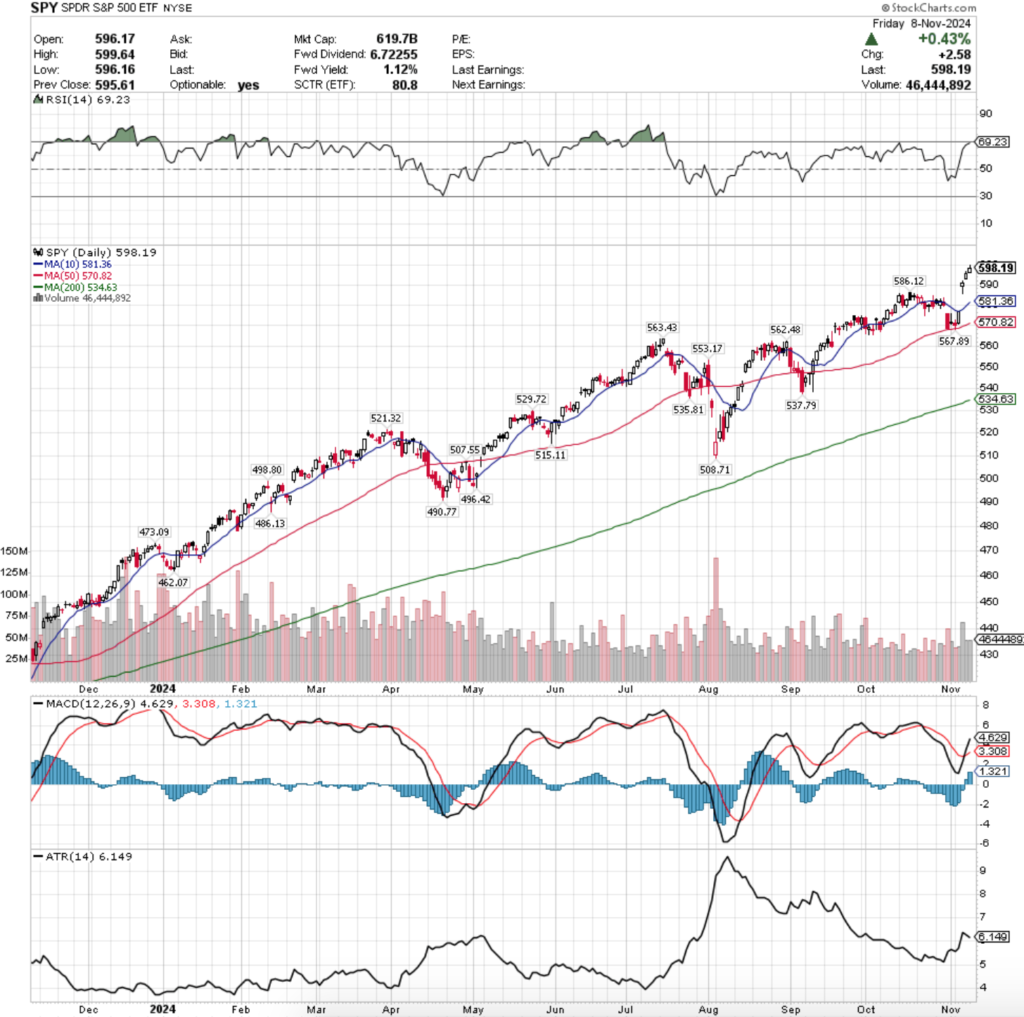
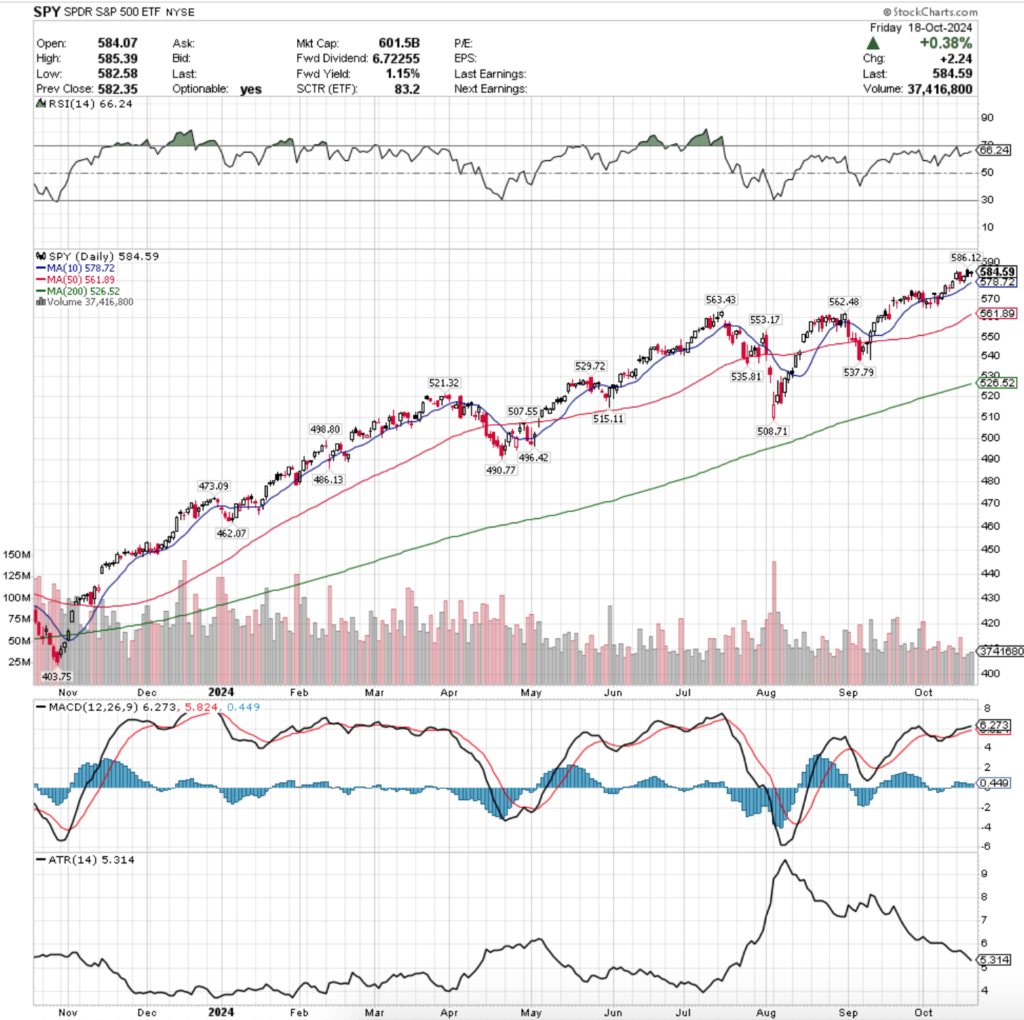
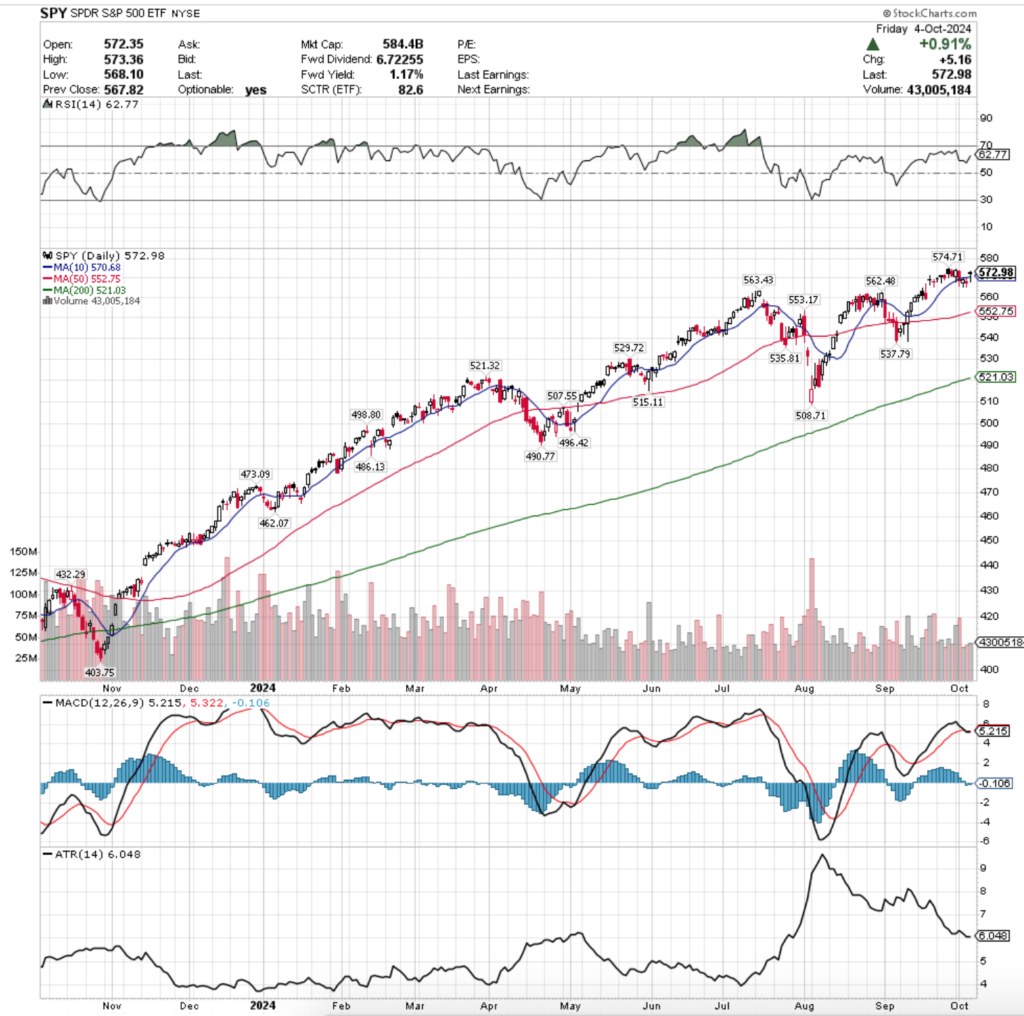
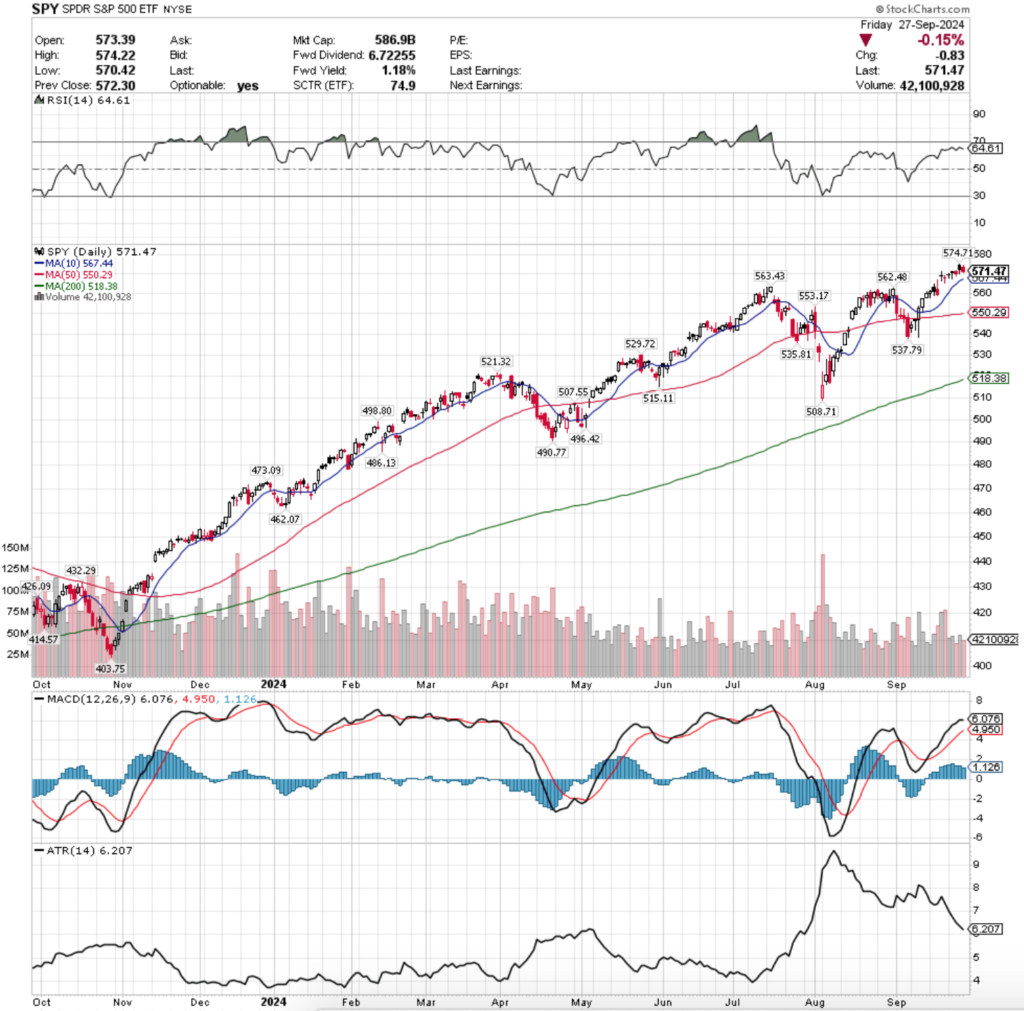
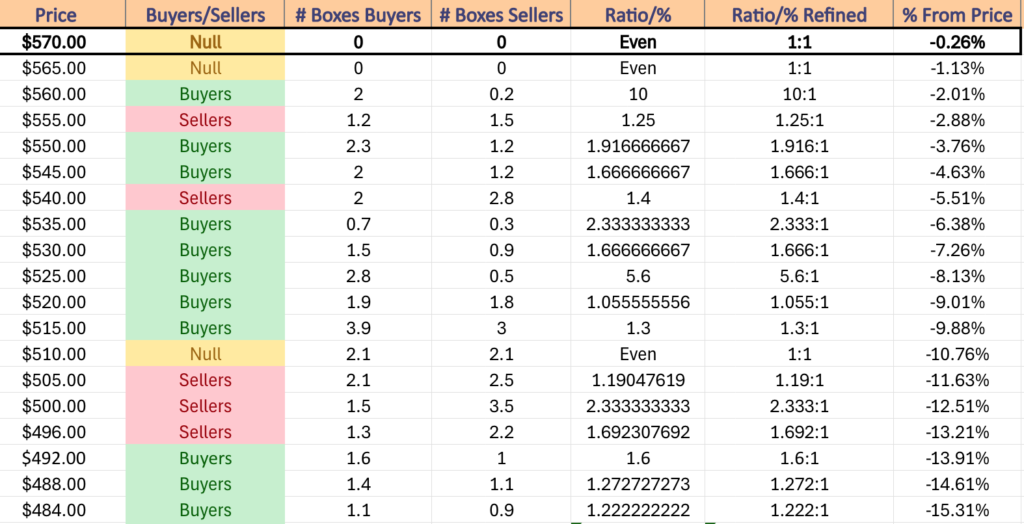
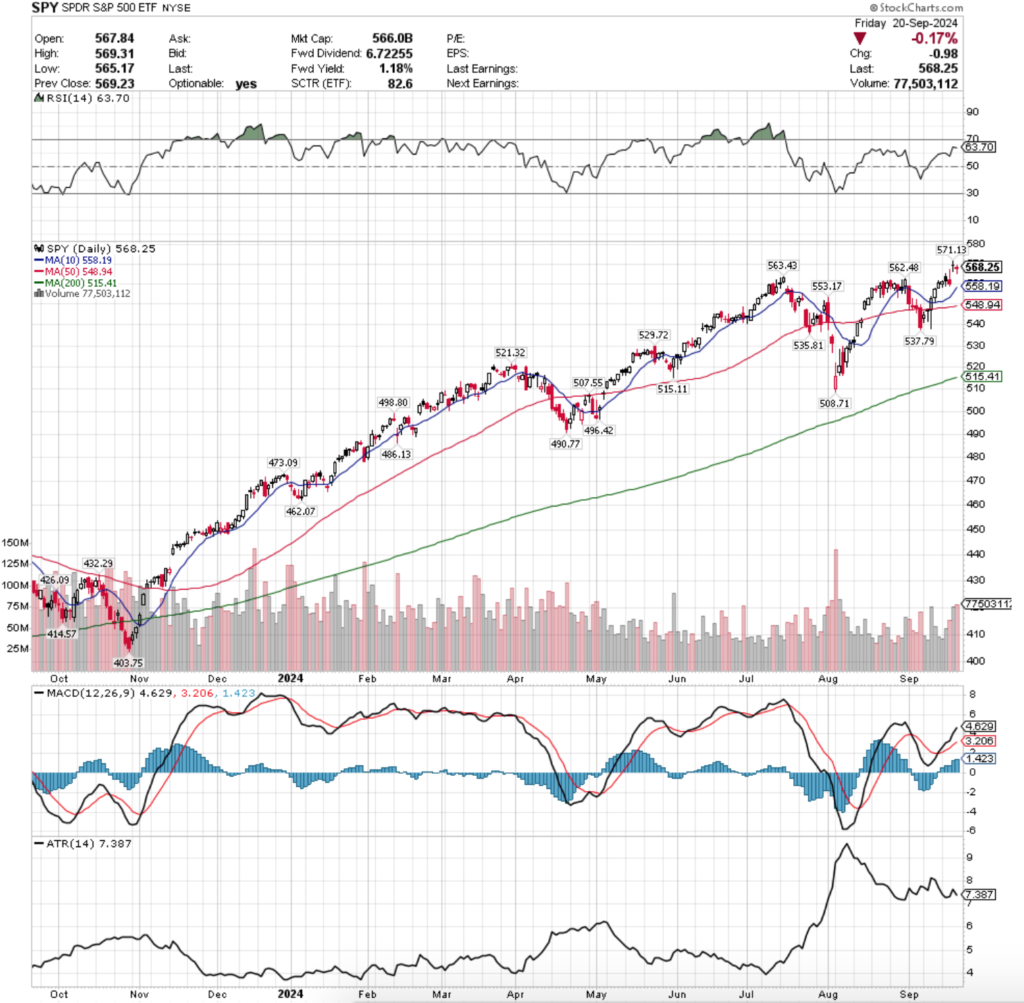
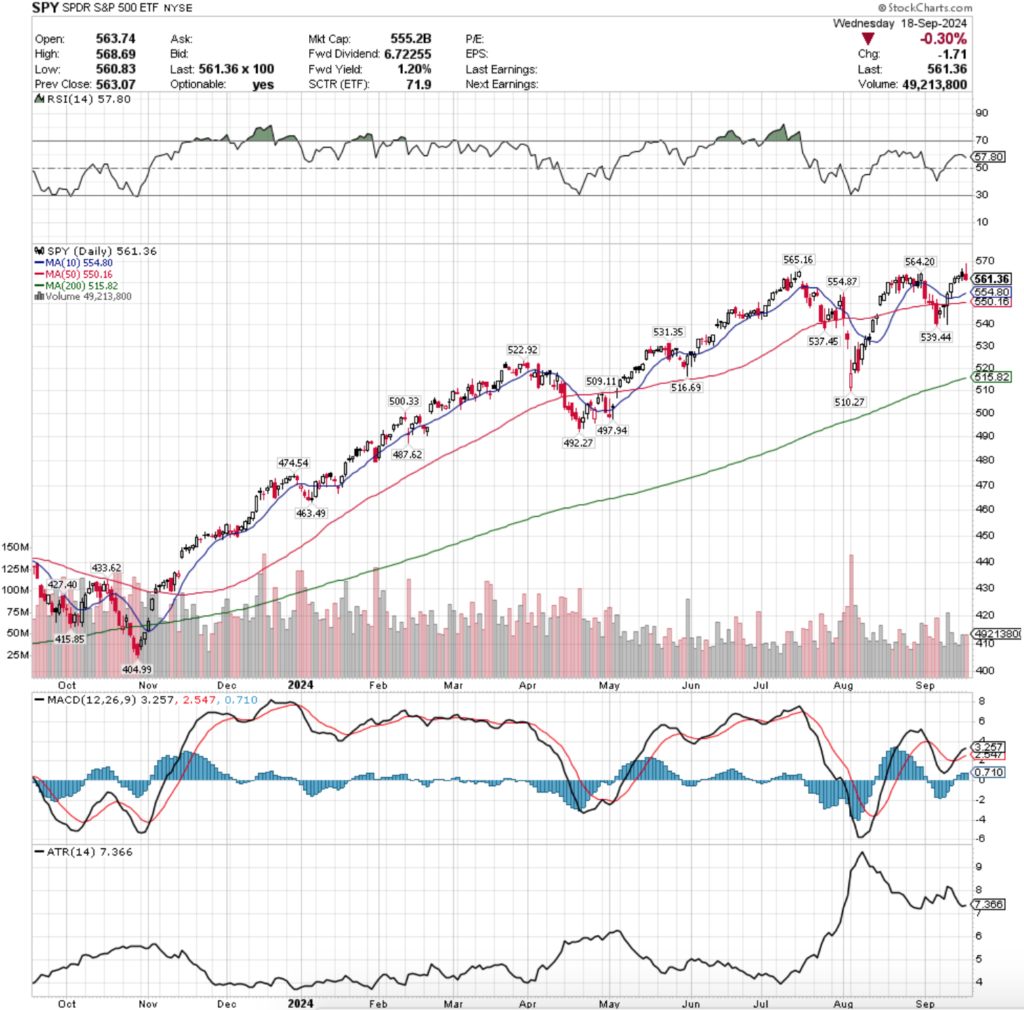
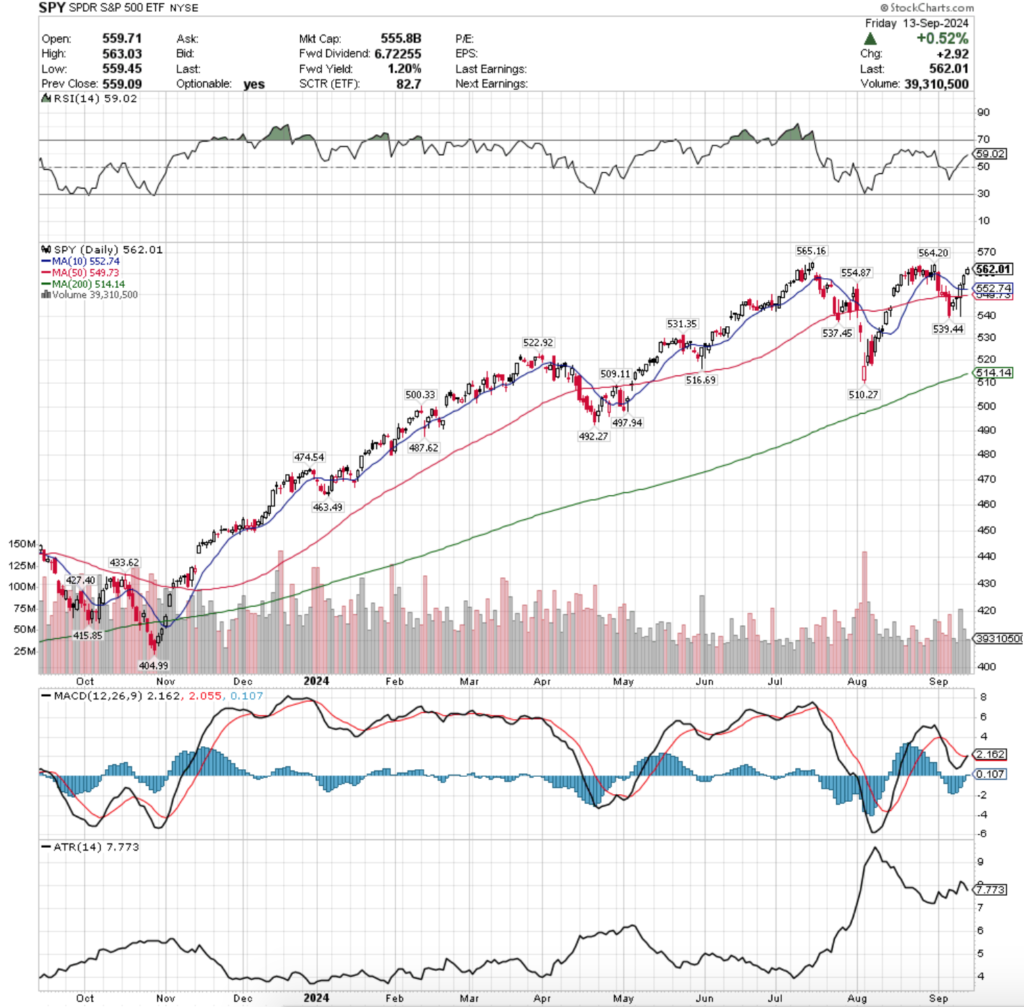
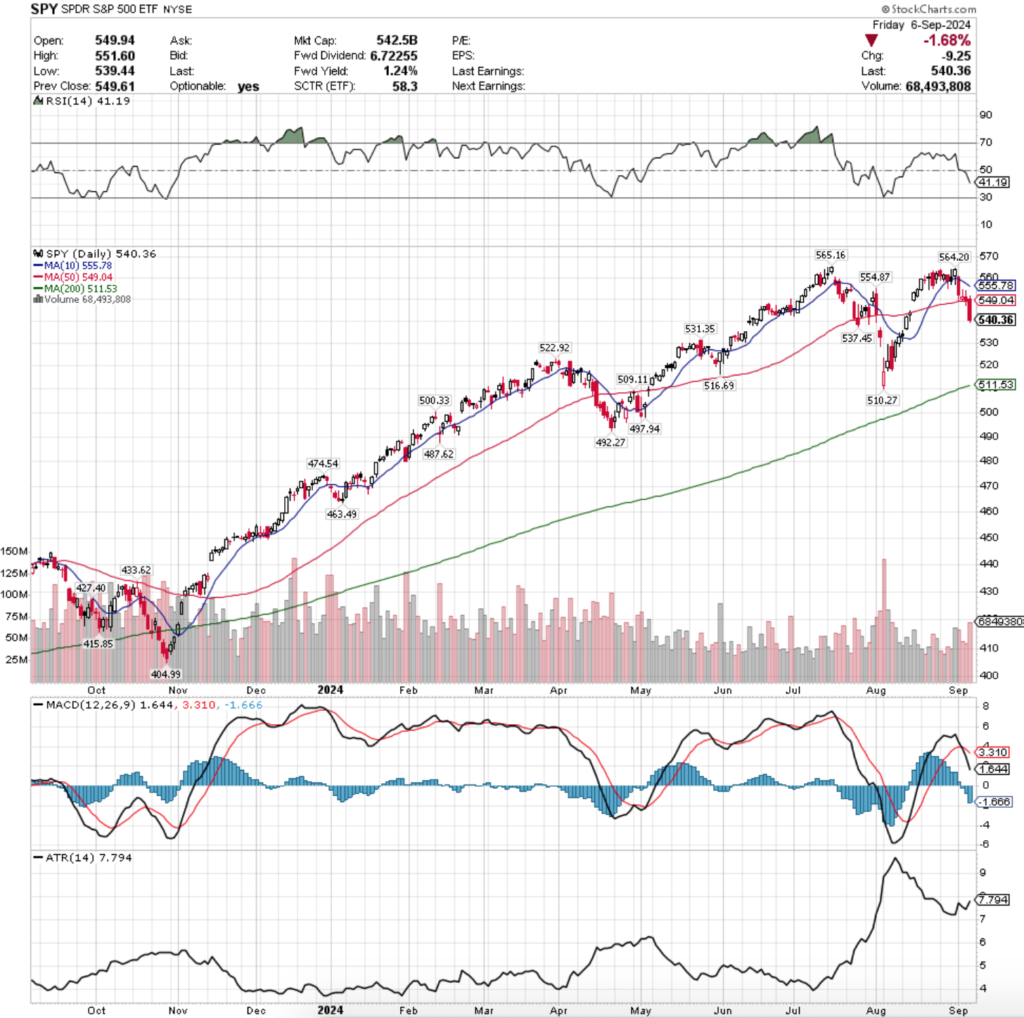
Price Level:Volume Sentiment Analysis For SPY, The SPDR S&P 500 ETF
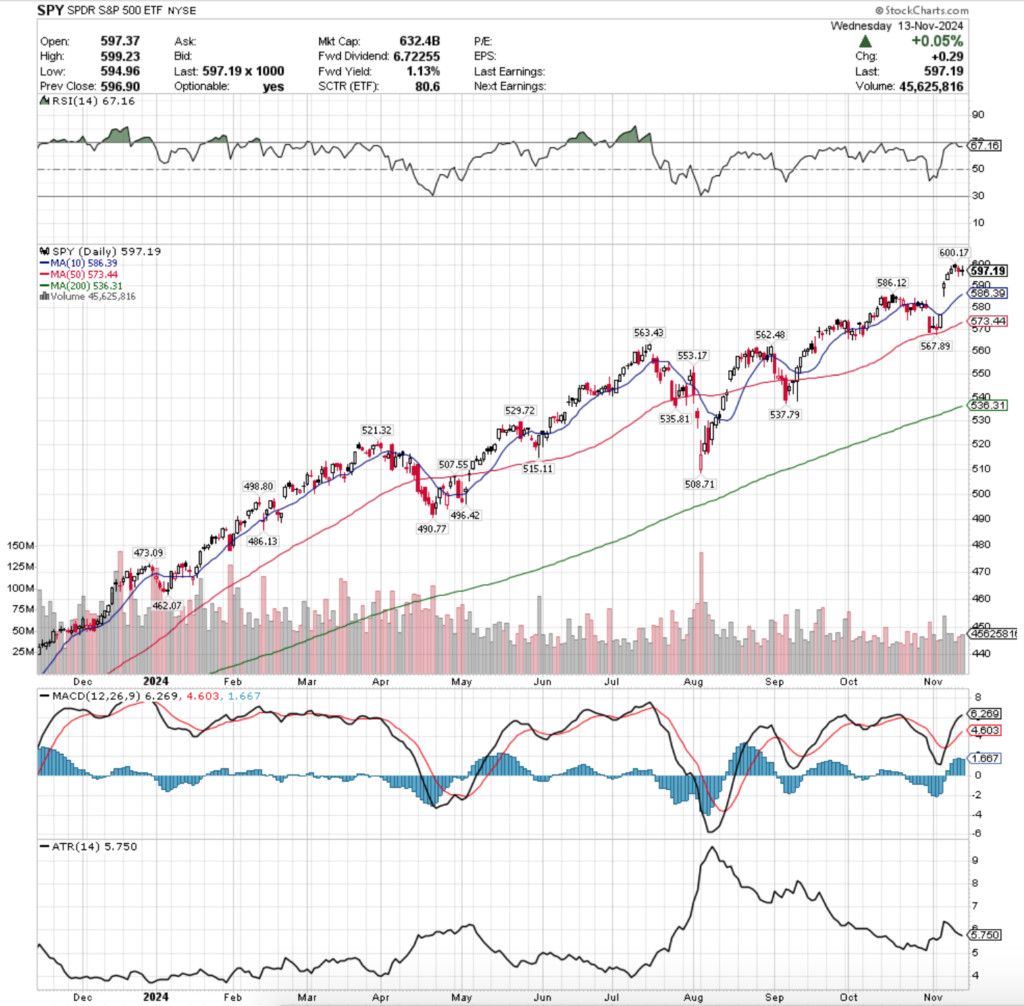
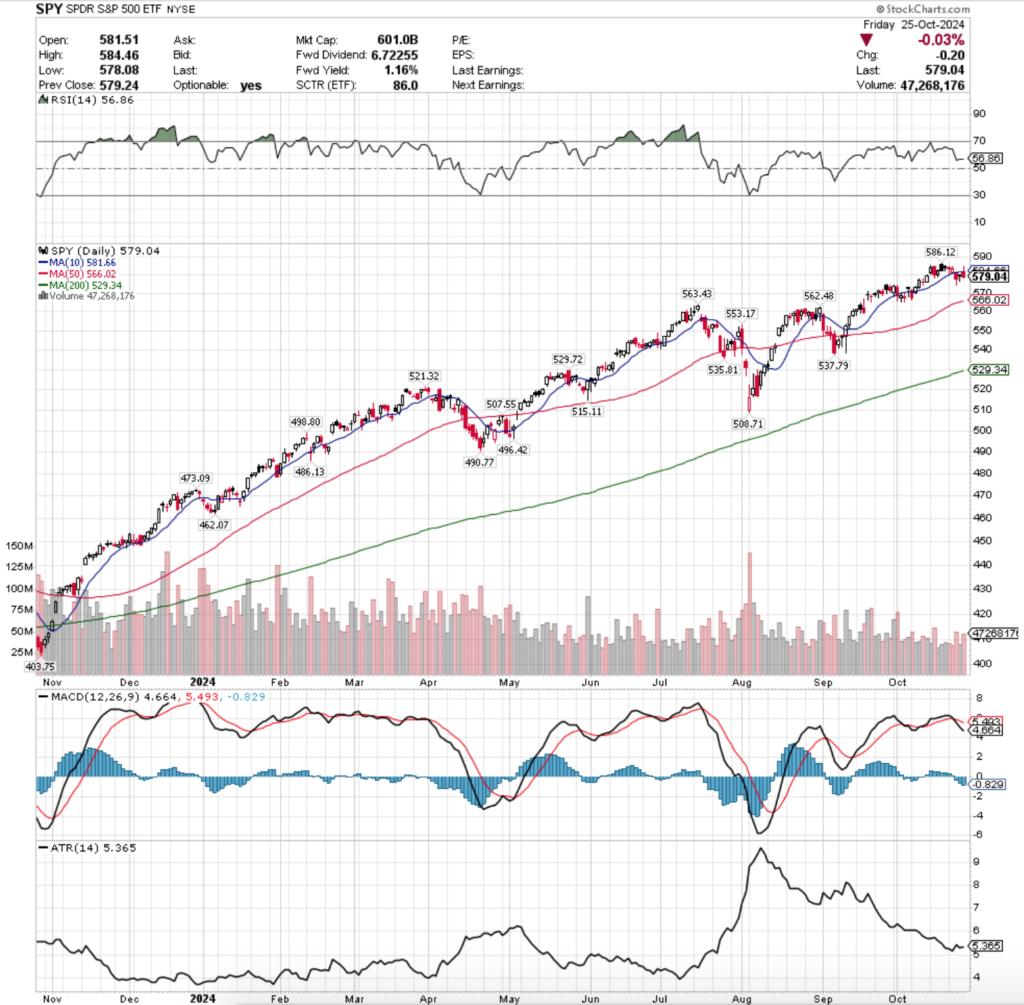
SPY, the SPDR S&P 500 ETF enjoyed a massive gap up following the election after spending most of October straddling its 10 day moving average.
Since Tuesday it has shown that folks are beginning to take profits following the move upward, which has all eyes looking at the window created by the post-election gap up.
There are two support levels near the lower end of the gap, one of which being the 10 day moving average which continues higher on a daily basis.
While this may help slow any declines, should the support & the $586-level be broken the next stop is the 50 DMA’s support.
With this in mind, it is worth looking at how investors have behaved over the past few years at each price level to see if it lends clues into how they may choose to behave again in the near-future.
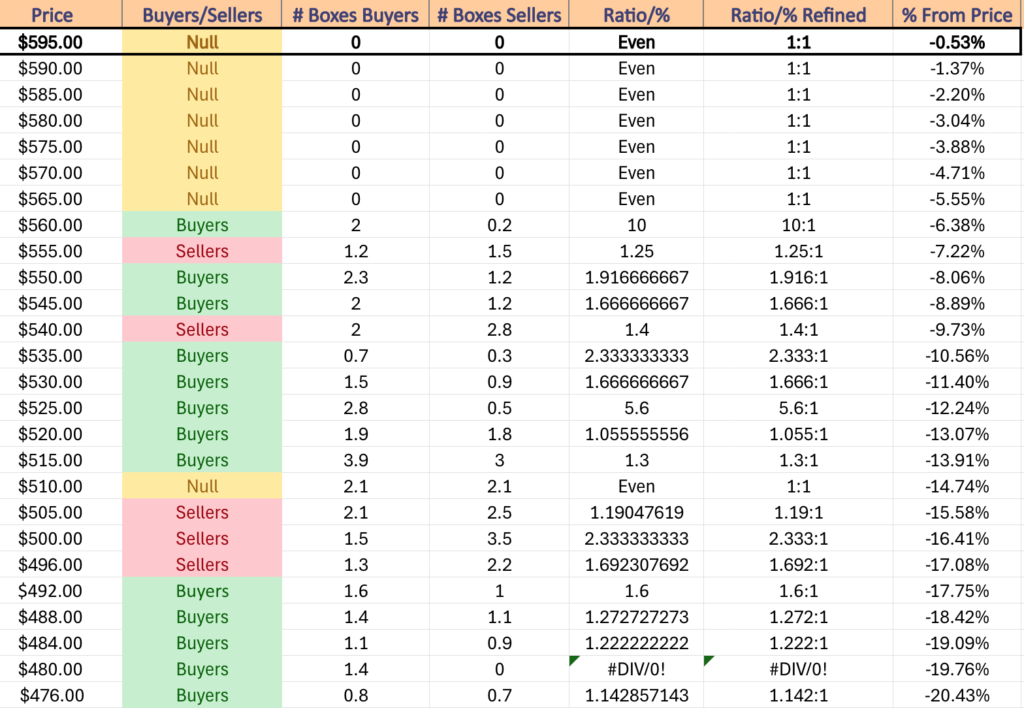
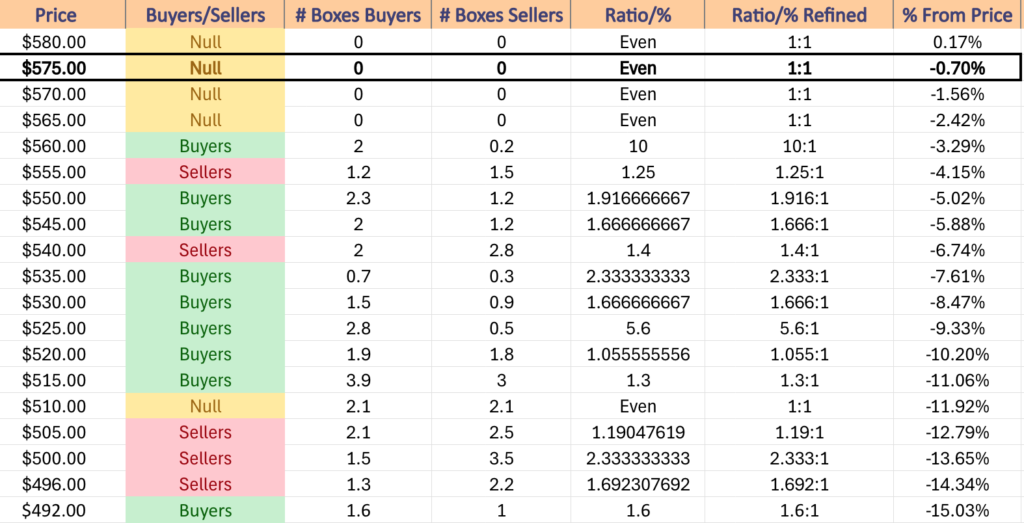
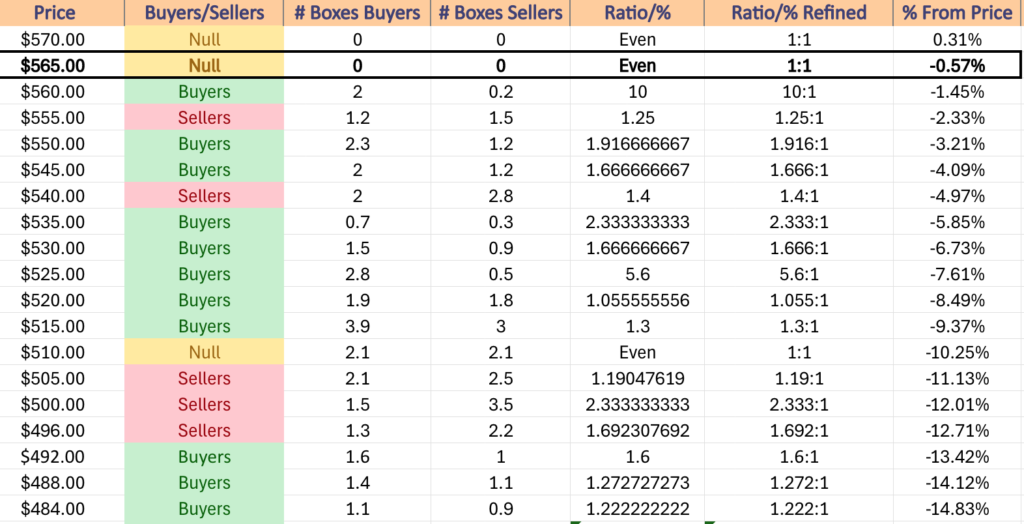
Below is a list of the volume sentiments at each price level SPY has traded at over the past 2-3 years.
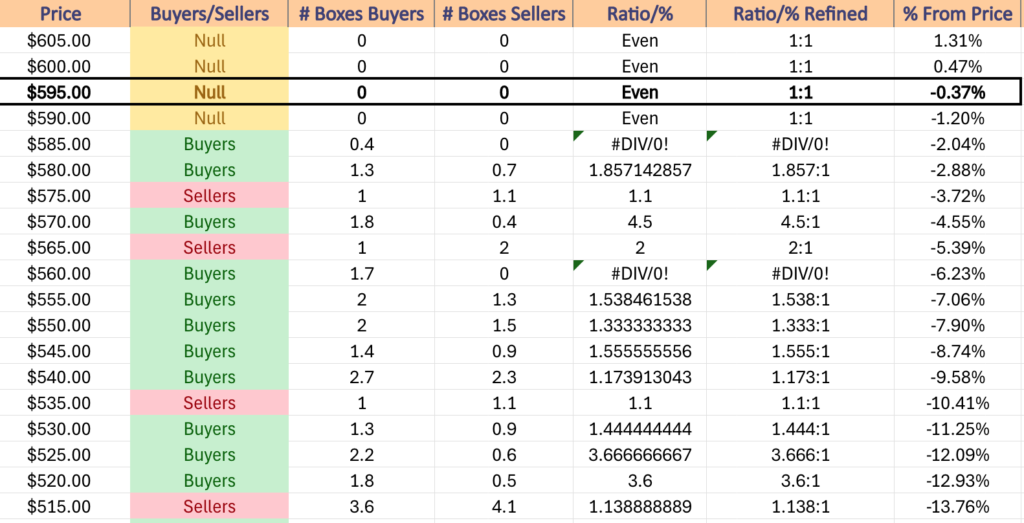
$605 -NULL – 0:0*, +1.31% From Current Price Level
$600 – NULL – 0:0*, +0.47% From Current Price Level – All-Time High*
$595 – NULL – 0:0*, -0.37% From Current Price Level – Current Price Level*
$590 – NULL – 0:0*, -1.2% From Current Price Level
$585 – Buyers – 0.4:0*, -2.04% From Current Price Level – 10 Day Moving Average*
$580 – Buyers – 1.86:1, -2.88% From Current Price Level
$575 – Sellers – 1.1:1, -3.72% From Current Price Level
$570 – Buyers – 4.5:1, -4.55% From Current Price Level – 50 Day Moving Average*
$565 – Sellers – 2:1, -5.39% From Current Price Level
$560 – Buyers – 1.7:0*, -6.23% From Current Price Level
$555 – Buyers – 1.54:1, -7.06% From Current Price Level
$550 – Buyers – 1.33:1, -7.9% From Current Price Level
$545 – Buyers – 1.56:1, -8.74% From Current Price Level
$540 – Buyers – 1.17:1, -9.58% From Current Price Level
$535 – Sellers – 1.1:1, -10.41% From Current Price Level – 200 Day Moving Average*
$530 – Buyers – 1.44:1, -11.25% From Current Price Level
$525 – Buyers – 3.67:1, -12.09% From Current Price Level
$520 – Buyers – 3.6:1, -12.93% From Current Price Level
$515 – Sellers – 1.14:1, -13.76% From Current Price Level
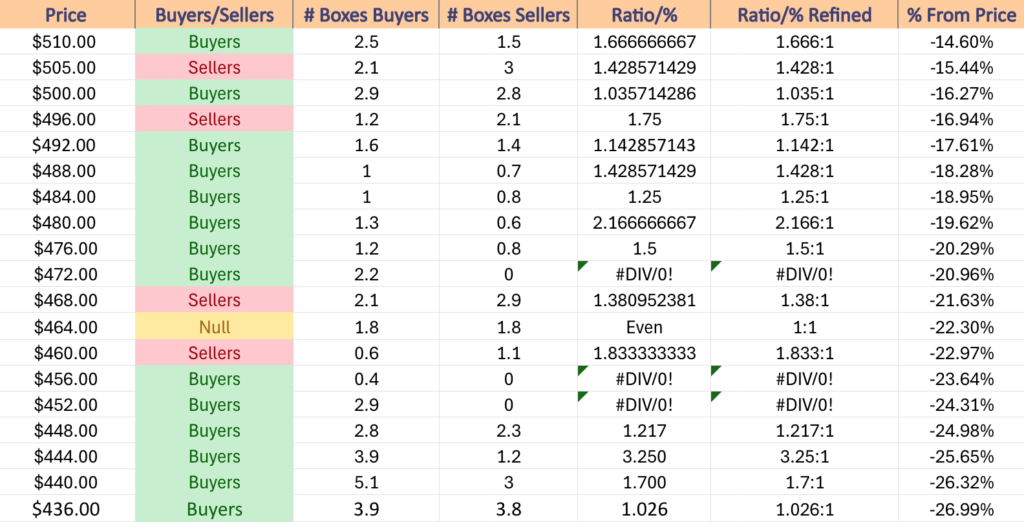
$510 – Buyers – 1.67:1, -14.6% From Current Price Level
$505 – Sellers – 1.43:1, -15.44% From Current Price Level
$500 – Buyers – 1.04:1, -16.27% From Current Price Level
$496 – Sellers – 1.75:1, -16.94% From Current Price Level
$492 – Buyers – 1.14:1, -17.61% From Current Price Level
$488 – Buyers – 1.43:1, -18.28% From Current Price Level
$484 – Buyers – 1.25:1, -18.95% From Current Price Level
$480 -Buyers – 2.17:1, -19.62% From Current Price Level
$476 – Buyers – 1.5:1, -20.29% From Current Price Level
$472 – Buyers – 2.2:0*, -20.96% From Current Price Level
$468 – Sellers – 1.38:1, -21.63% From Current Price Level
$464 – Even – 1:1, -22.3% From Current Price Level
$460 – Sellers – 1.83:1, -22.97% From Current Price Level
$456 – Buyers – 0.4:0*, -23.64% From Current Price Level
$452 – Buyers – 2.9:0*, -24.31% From Current Price Level
$448 – Buyers – 1.22:1, -24.98% From Current Price Level
$444 – Buyers – 3.25:1, -25.65% From Current Price Level
$440 – Buyers – 1.7:1, -26.32% From Current Price Level
$436 – Buyers 1.03:1, -26.99% From Current Price Level
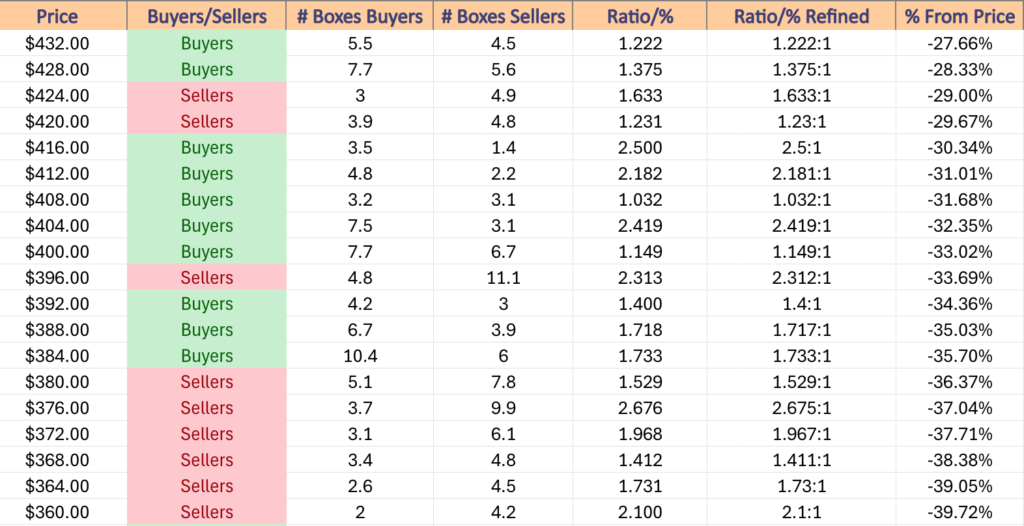
$432 – Buyers – 1.22:1, -27.66% From Current Price Level
$428 – Buyers – 1.38:1, -28.33% From Current Price Level% From Current Price Level
$424 – Sellers – 1.63:1, -29% From Current Price Level
$420 – Sellers – 1.23:1, -29.67% From Current Price Level
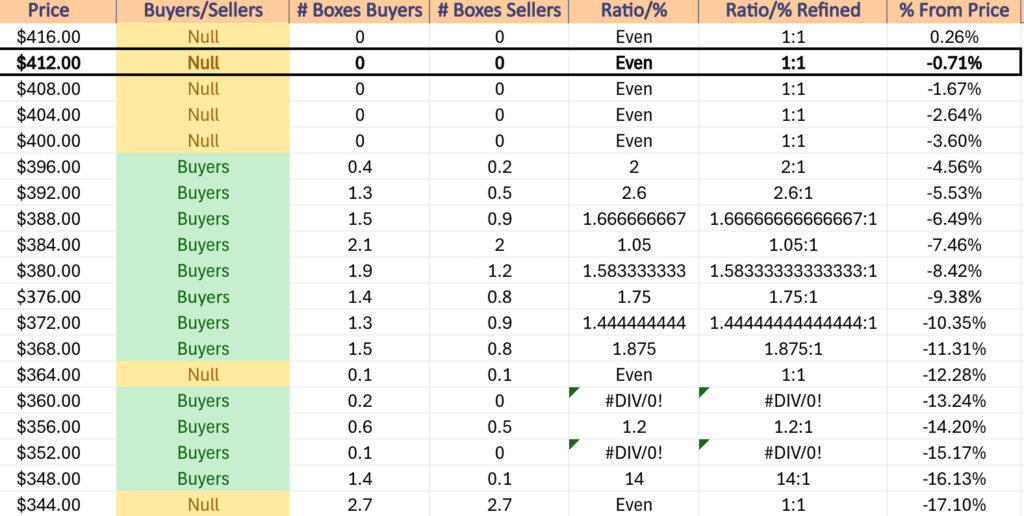
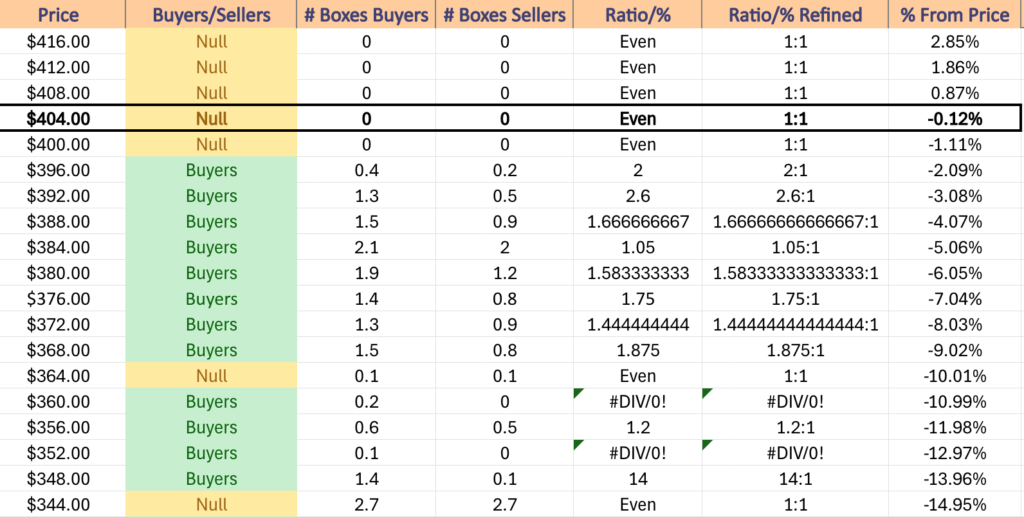
$416 – Buyers – 2.5:1, -30.34% From Current Price Level
$412 – Buyers – 2.18:1, -31.01% From Current Price Level
$408 – Buyers – 1.03:1, -31.68% From Current Price Level
$404 – Buyers – 2.42:1, -32.35% From Current Price Level
$400 – Buyers – 1.15:1, -33.02% From Current Price Level
$396 – Sellers – 2.31:1, -33.69% From Current Price Level
$392 – Buyers – 1.4:1, -34.36% From Current Price Level
$388 – Buyers – 1.72:1, -35.03% From Current Price Level
$384 – Buyers – 1.73:1, -35.7% From Current Price Level
$380 – Sellers – 1.53:1, -36.37% From Current Price Level
$376 – Sellers – 2.68:1, -37.04% From Current Price Level
$372 – Sellers – 1.97:1, -37.71% From Current Price Level
$368 – Sellers – 1.41:1, -38.38% From Current Price Level
$364 – Sellers – 1.73:1, -39.05% From Current Price Level
$360 – Sellers – 2.1:1, -39.72% From Current Price Level
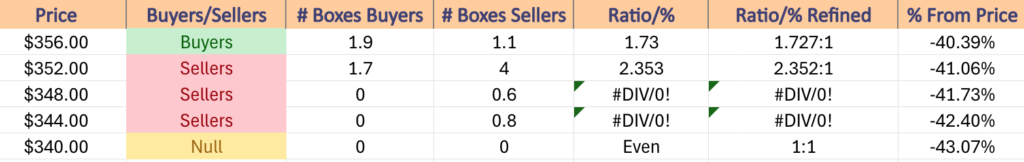
$356 – Buyers – 1.73:1, -40.39% From Current Price Level
$352 – Sellers – 2.35:1, -41.06% From Current Price Level
$348 – Sellers – 0.6:0*, -41.73% From Current Price Level
$344 – Sellers – 0.8:0*, -42.4% From Current Price Level
$340 – NULL – 0:0*, -43.07% From Current Price Level
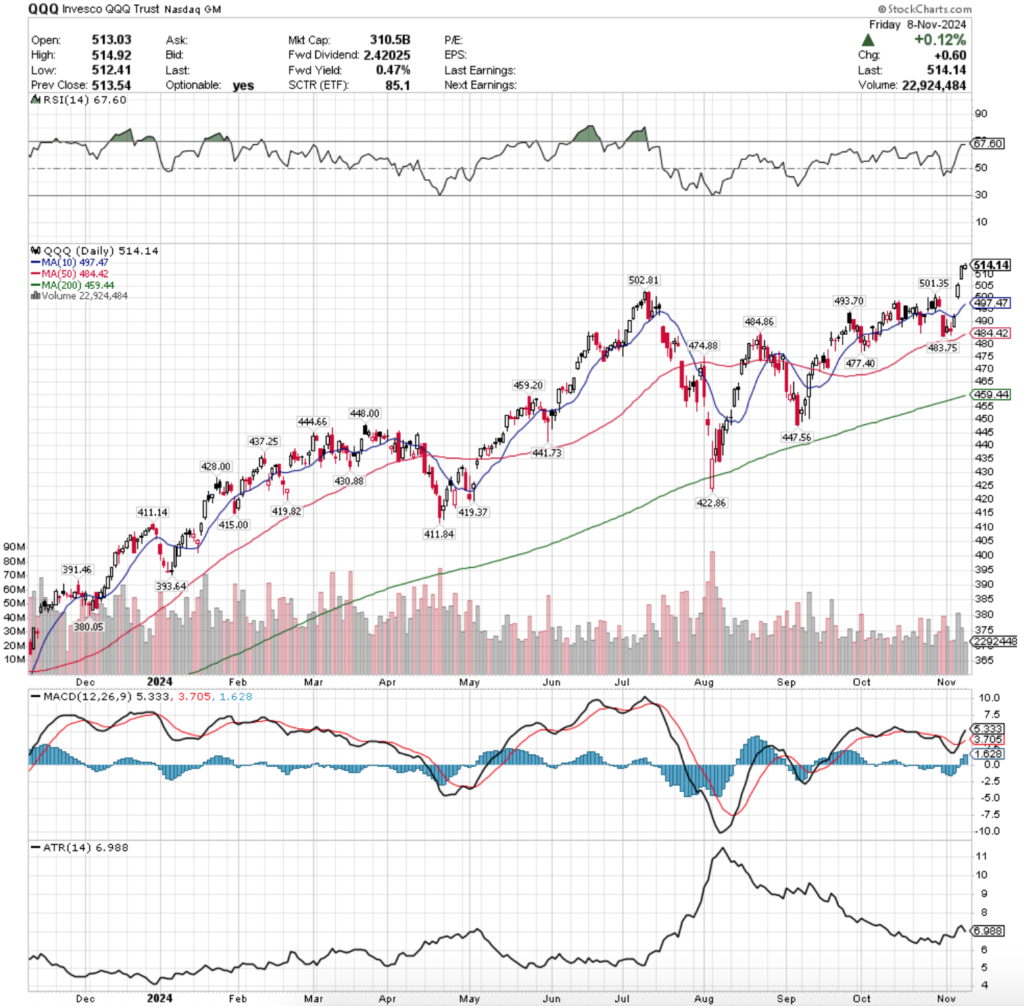
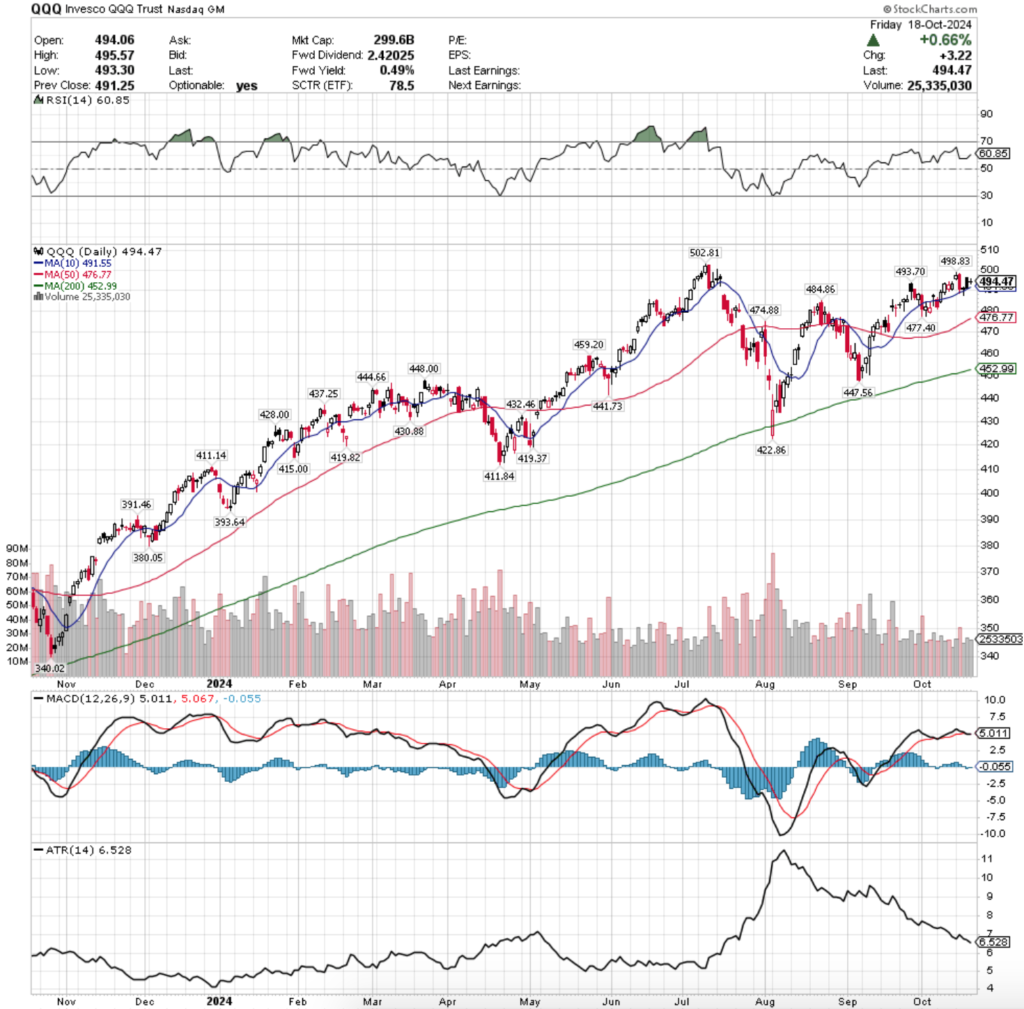
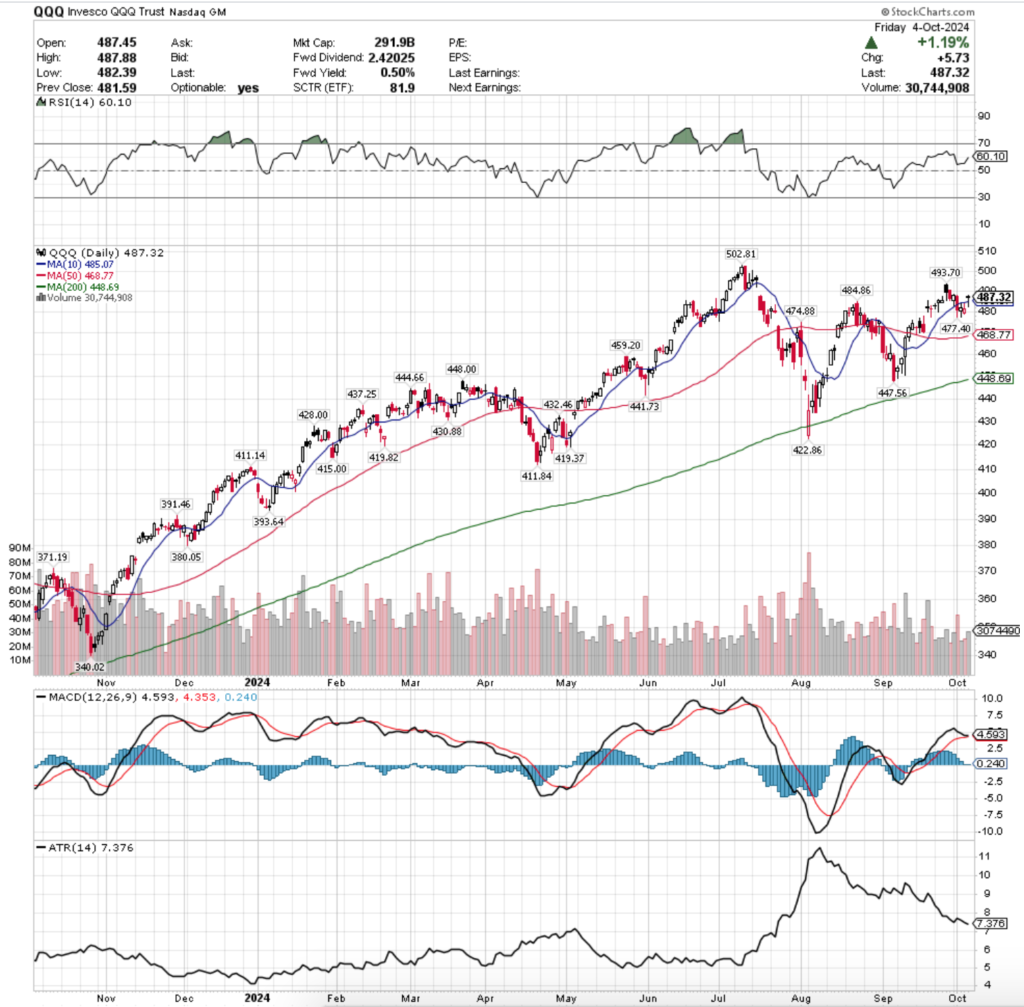
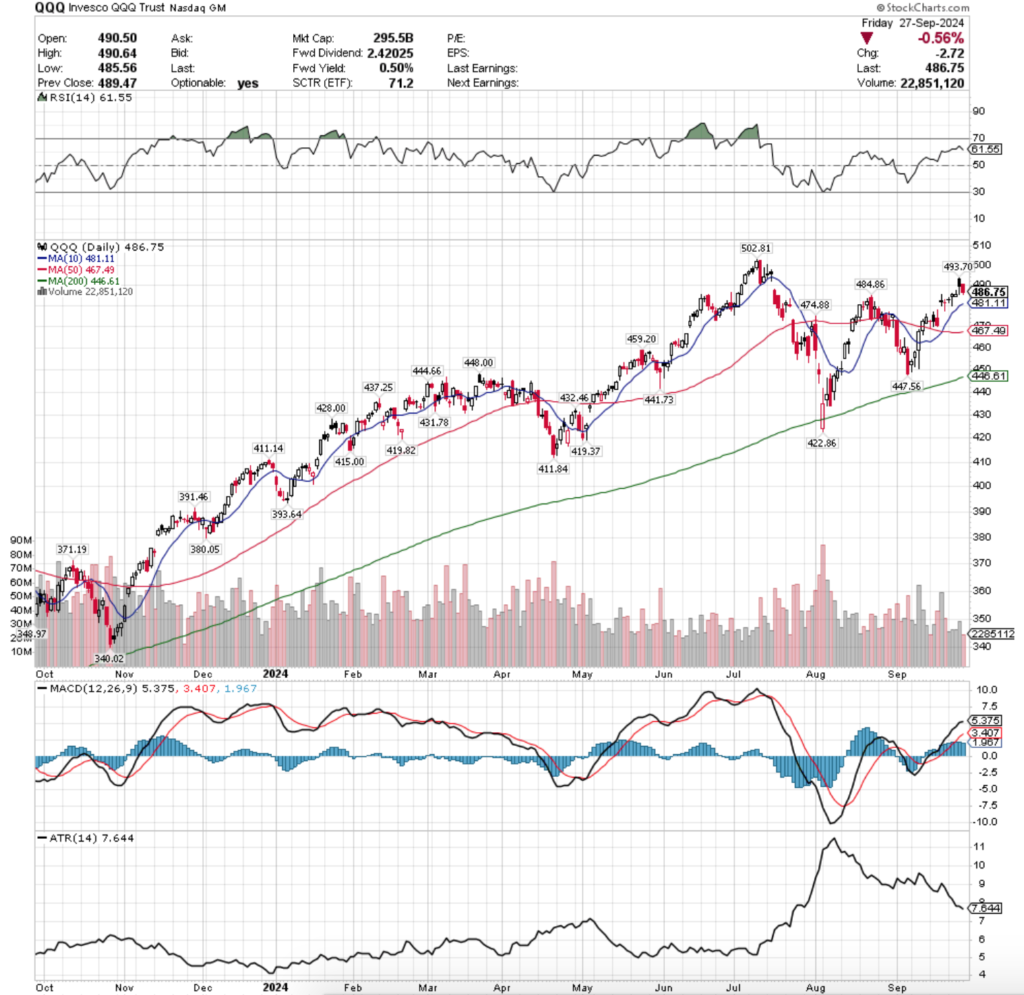
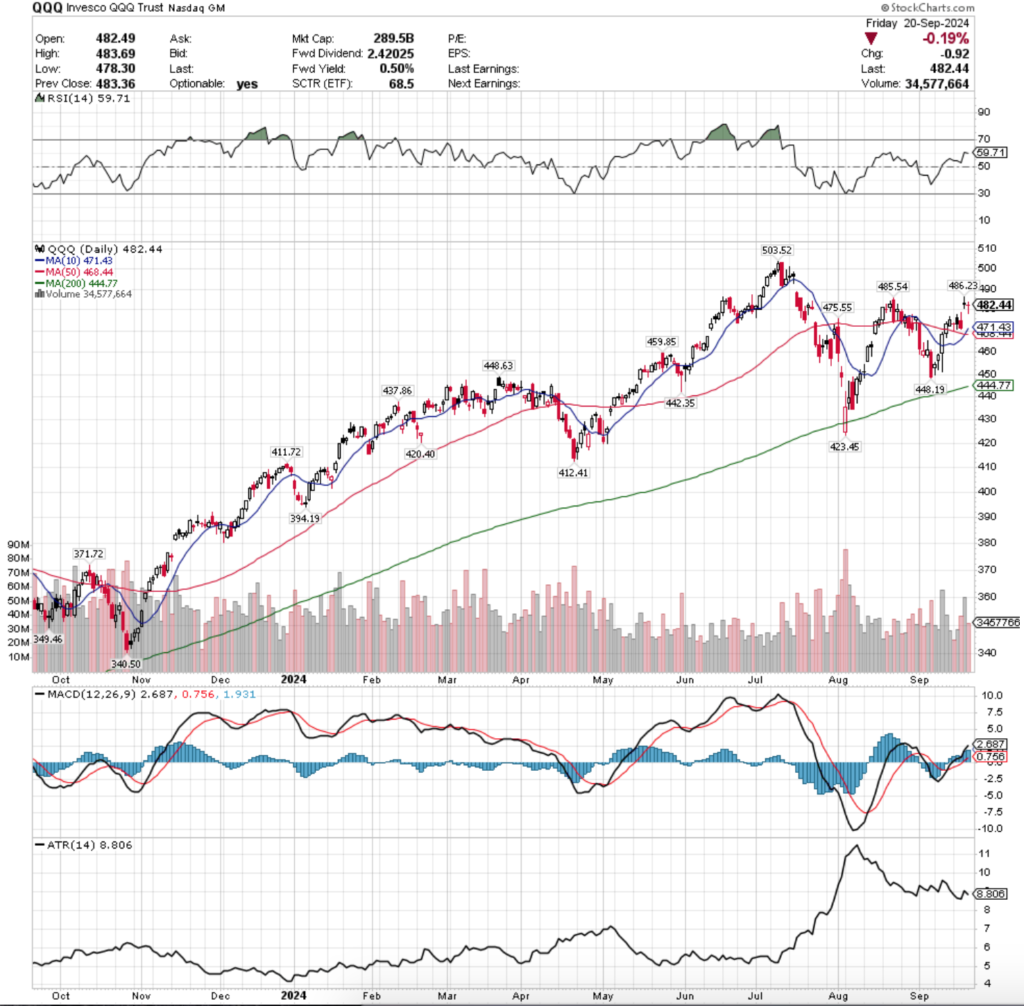
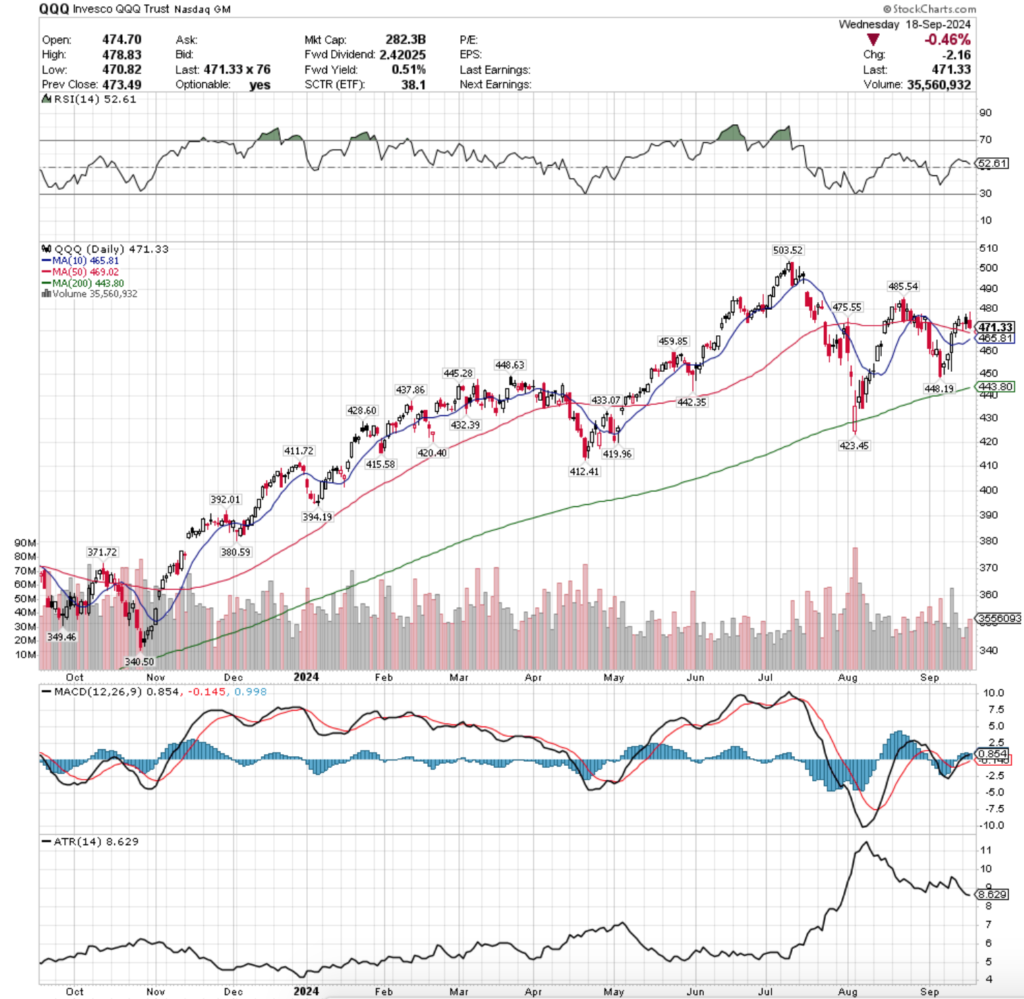
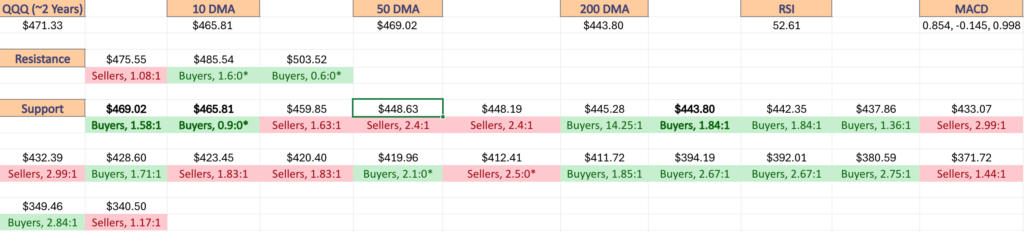
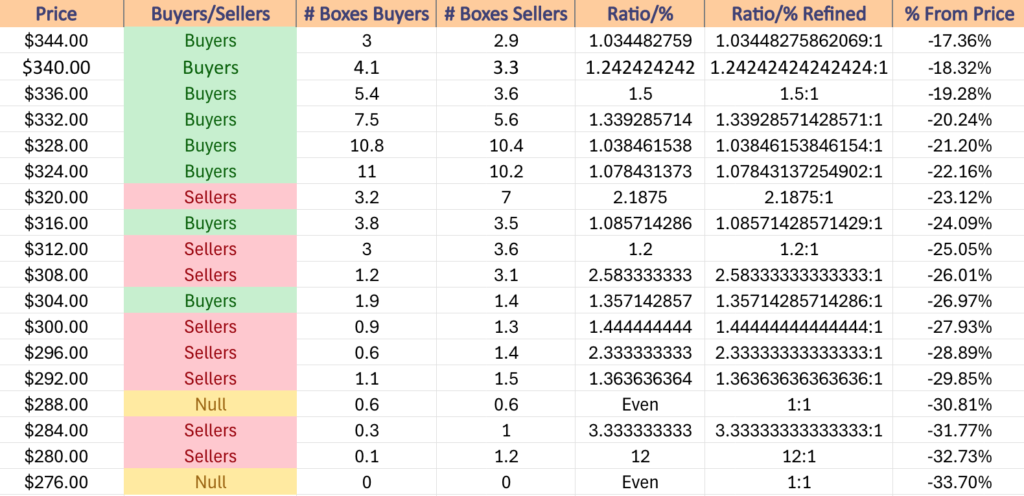
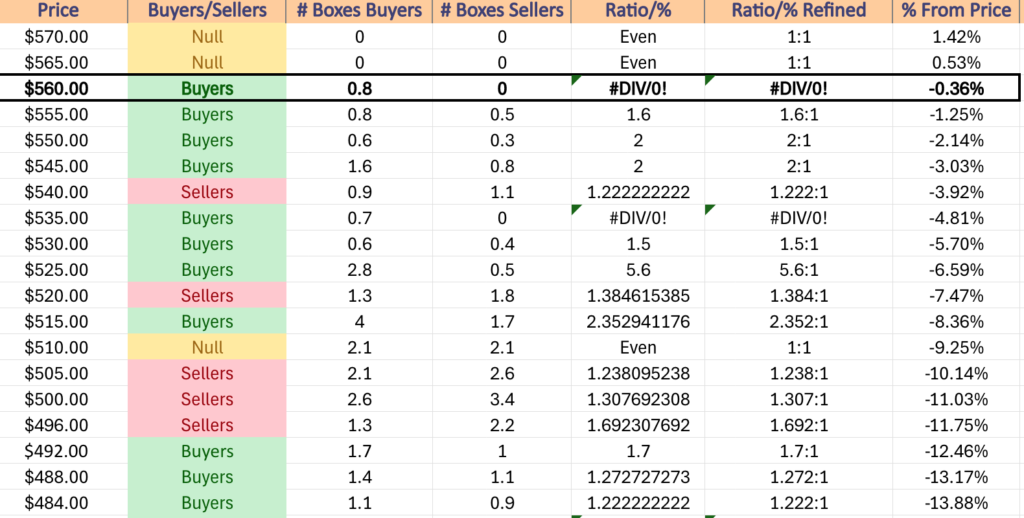
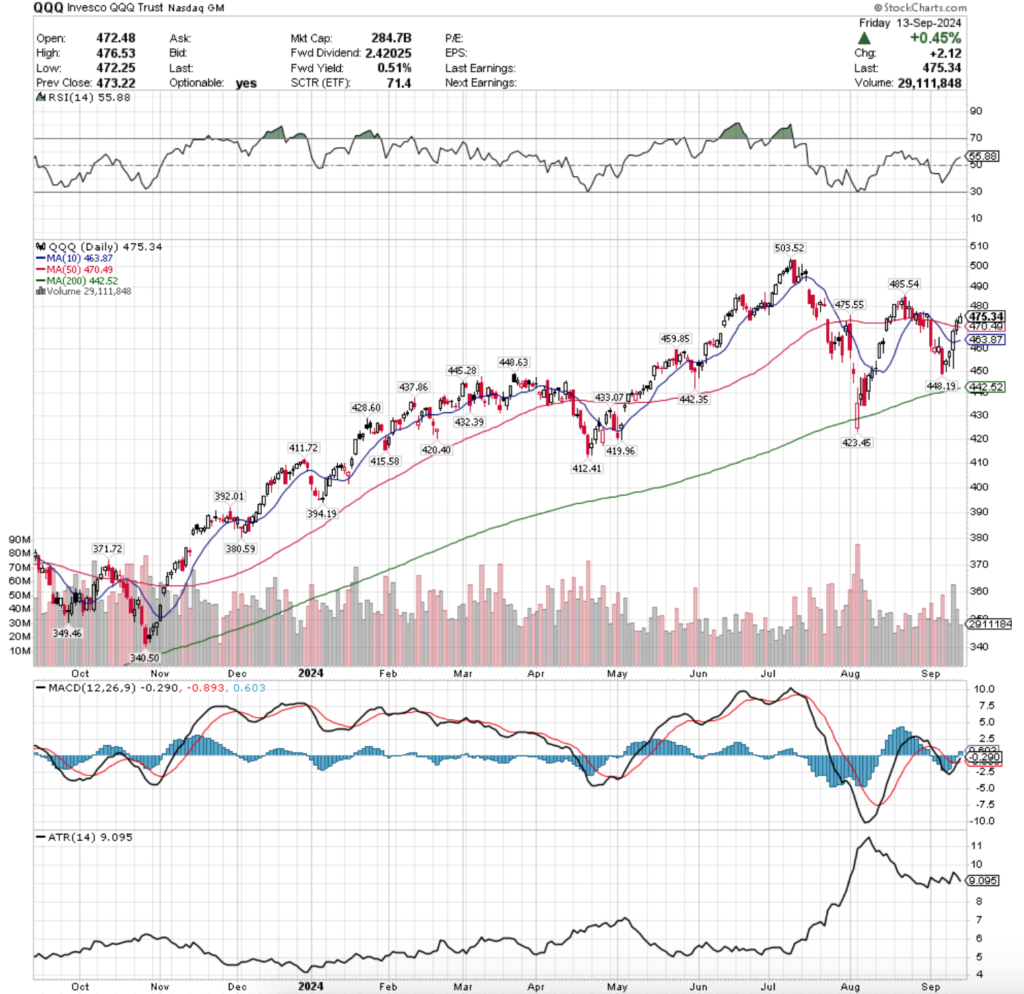
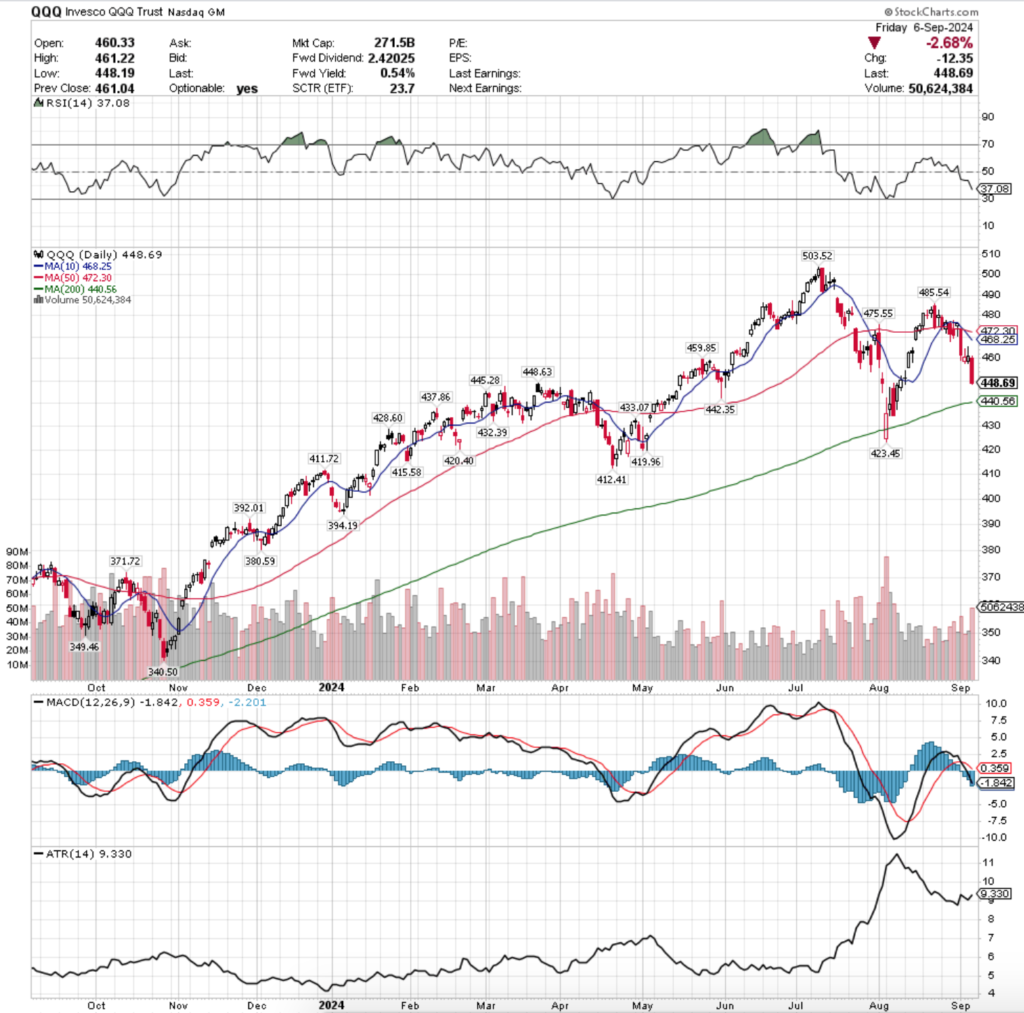
Price Level:Volume Sentiment Analysis For QQQ, The Invesco QQQ Trust ETF
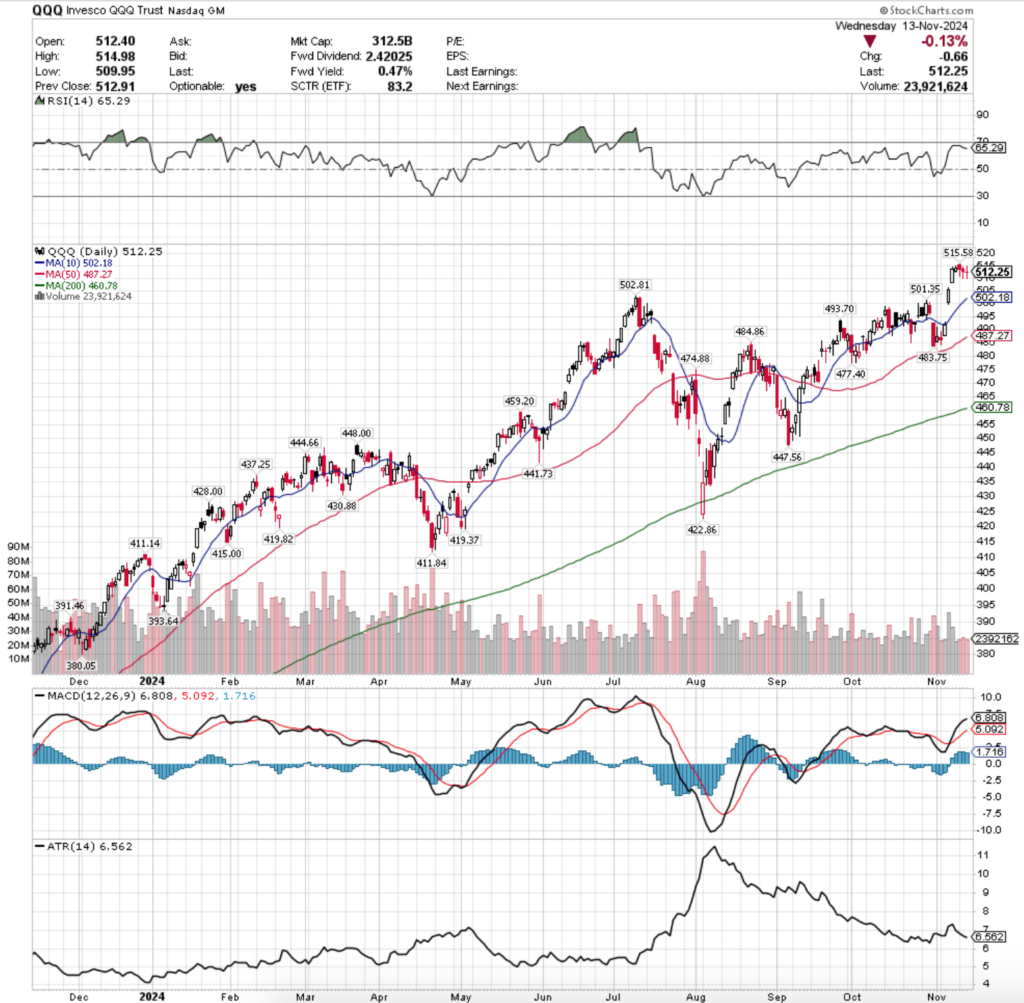
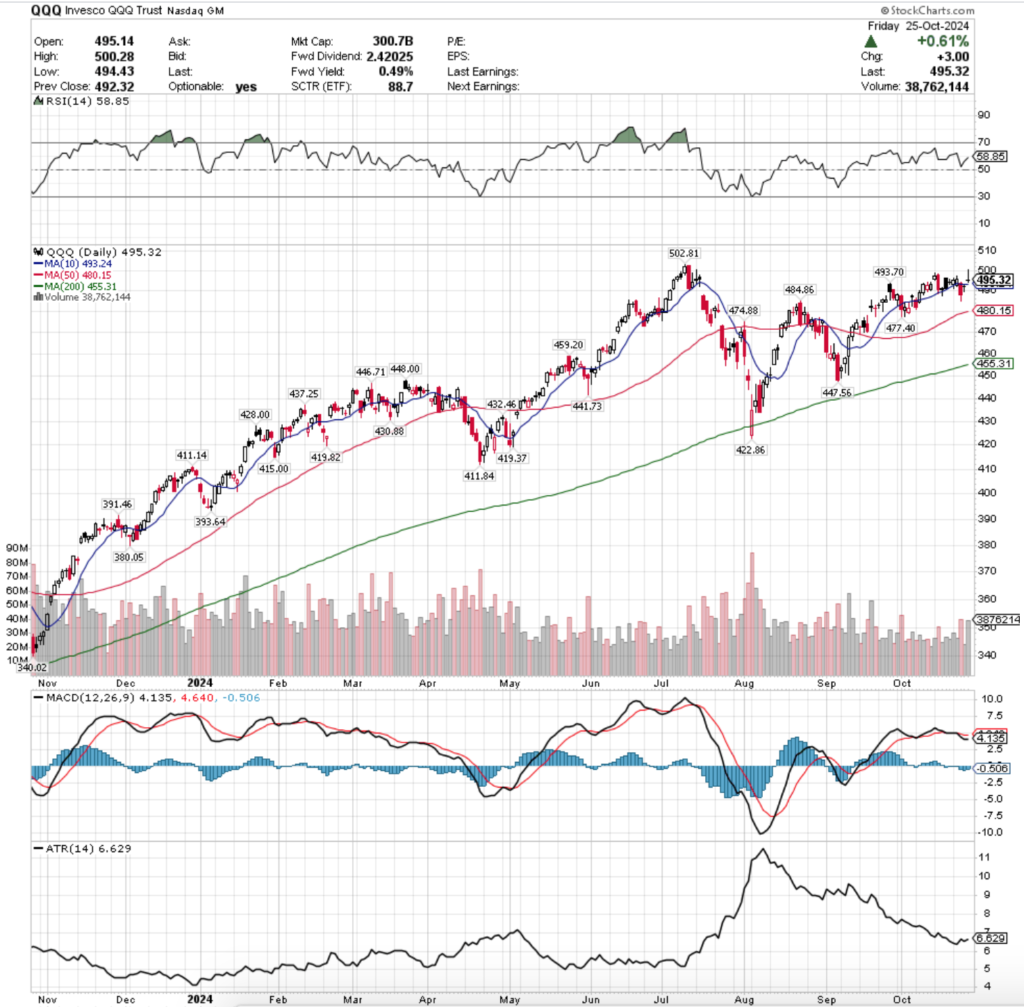
QQQ, the Invesco QQQ Trust ETF that tracks the NASDAQ 100 has enjoyed a similar post-election jump to SPY & also sits just off of all-time highs that were set on Monday.
Much like SPY they have also traded on weak volume recently, as there is indeed a bit of hesitancy among market participants to dive into the pool near such high price levels.
QQQ has more local support levels than SPY after the declines of July forced a slower recovery & consolidations that created more support/resistance touch-points.
Still, it is important to understand how they’ve traded historically at the price levels of the past few years, especially given the two gap ups that created two windows last week.
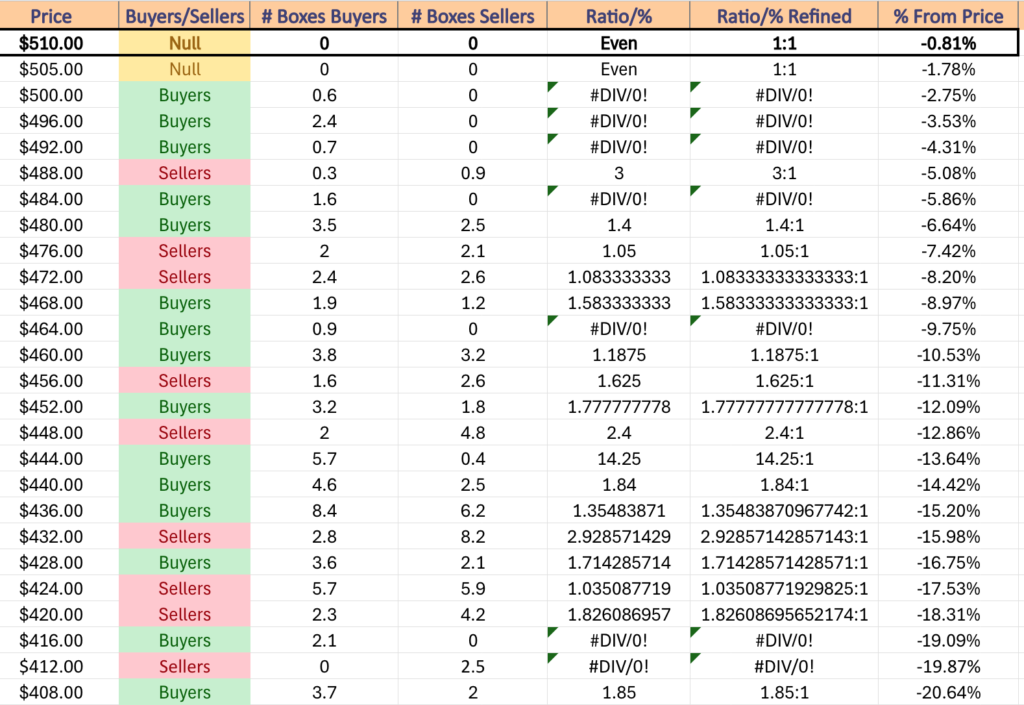
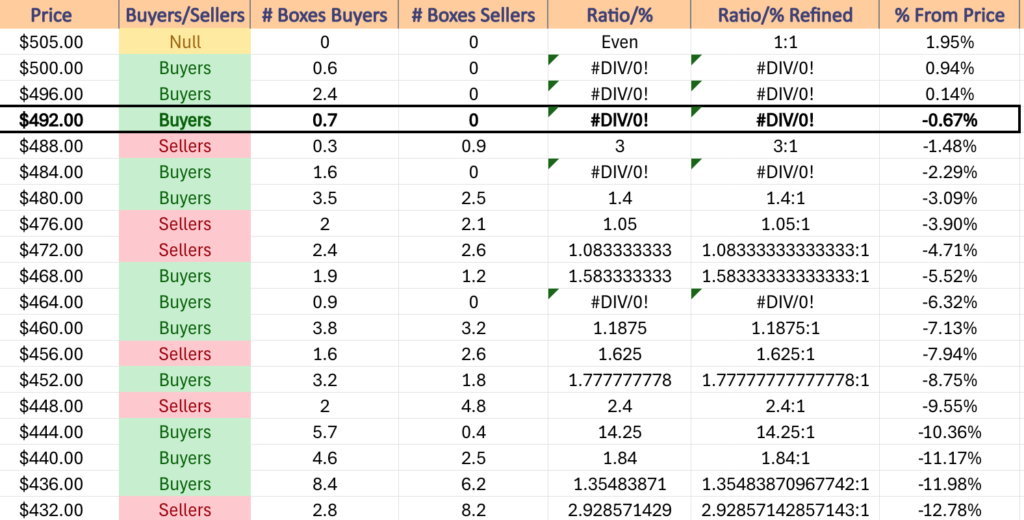
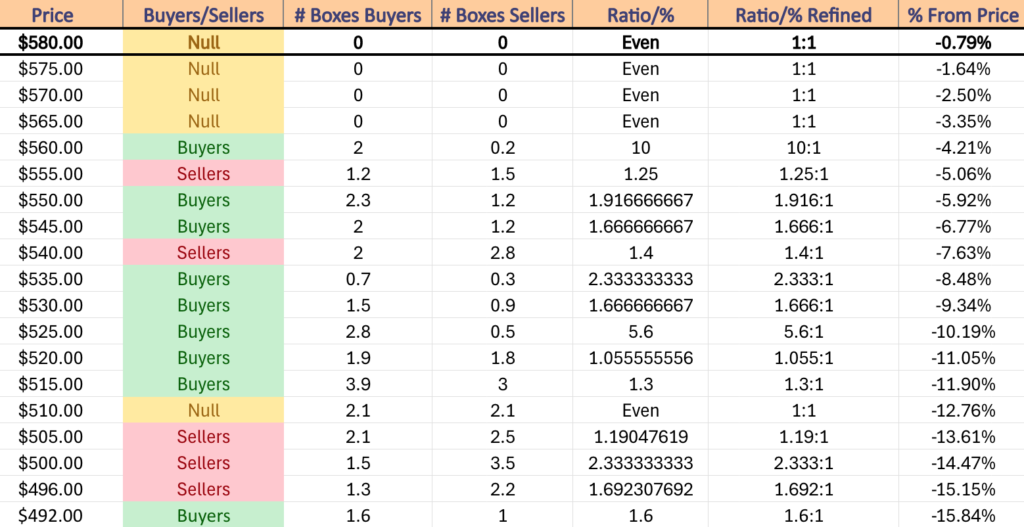
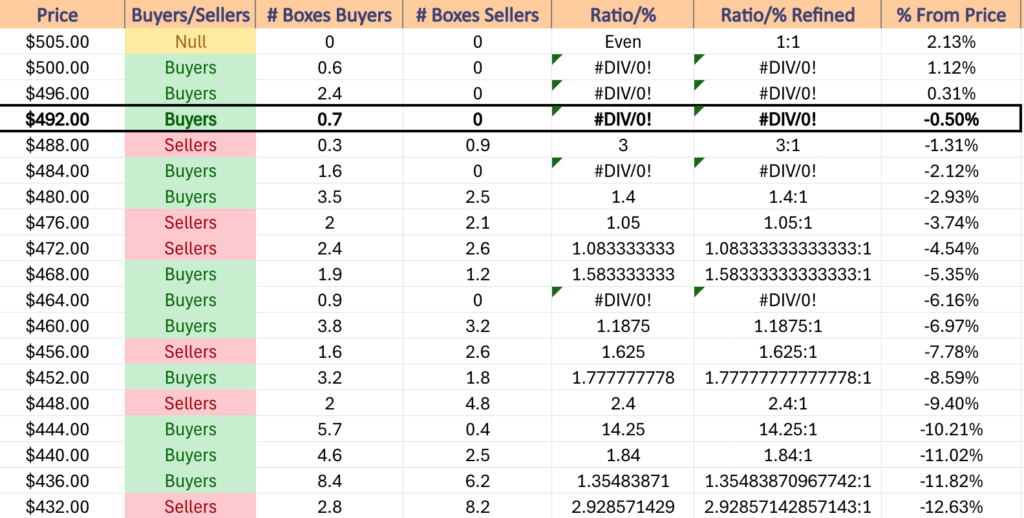
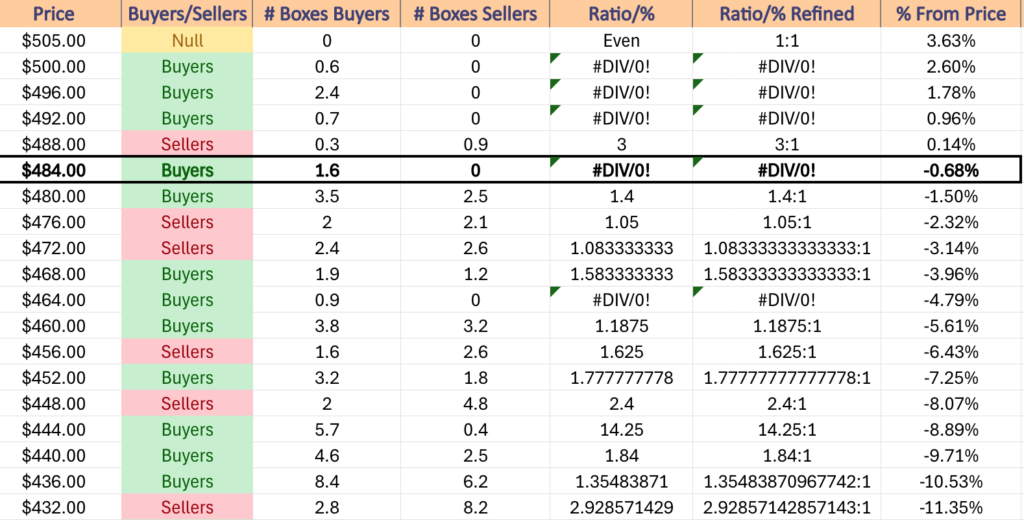
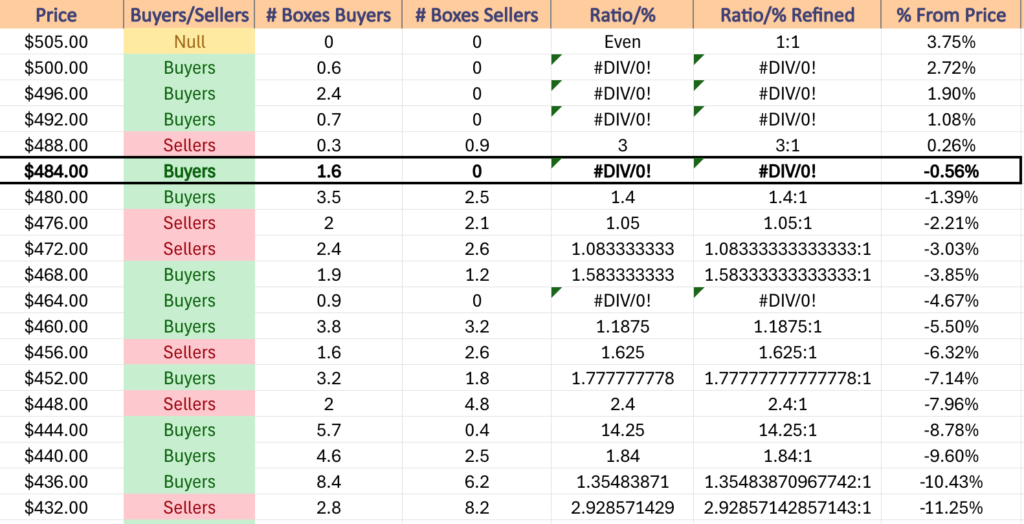
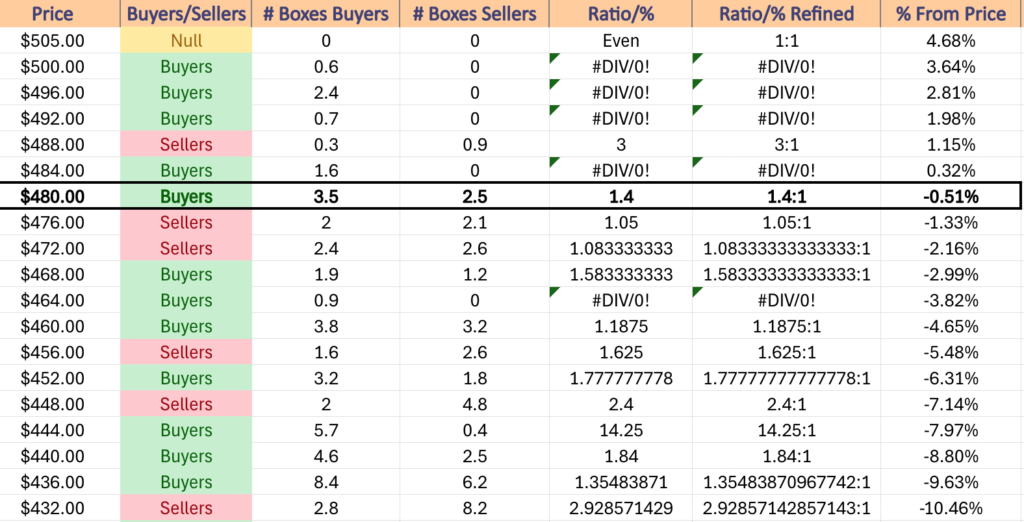
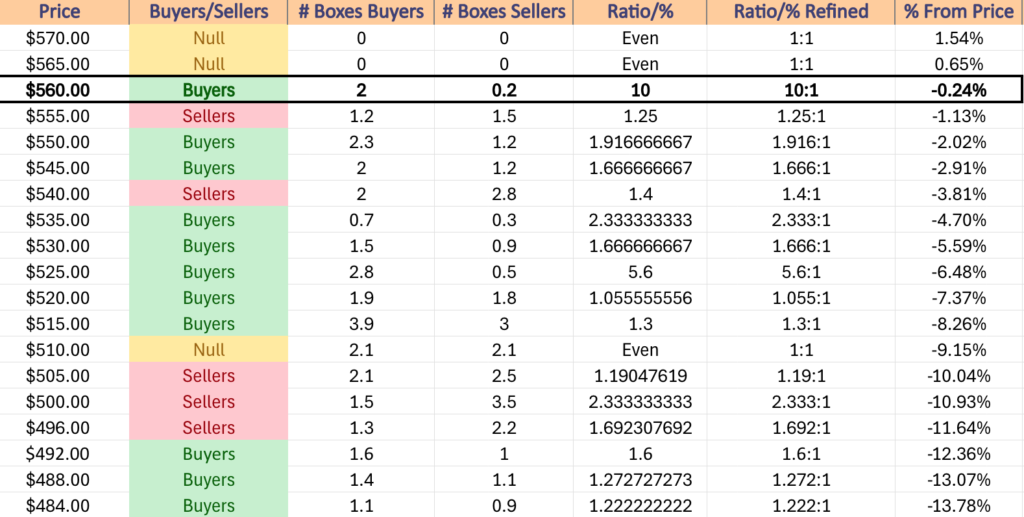
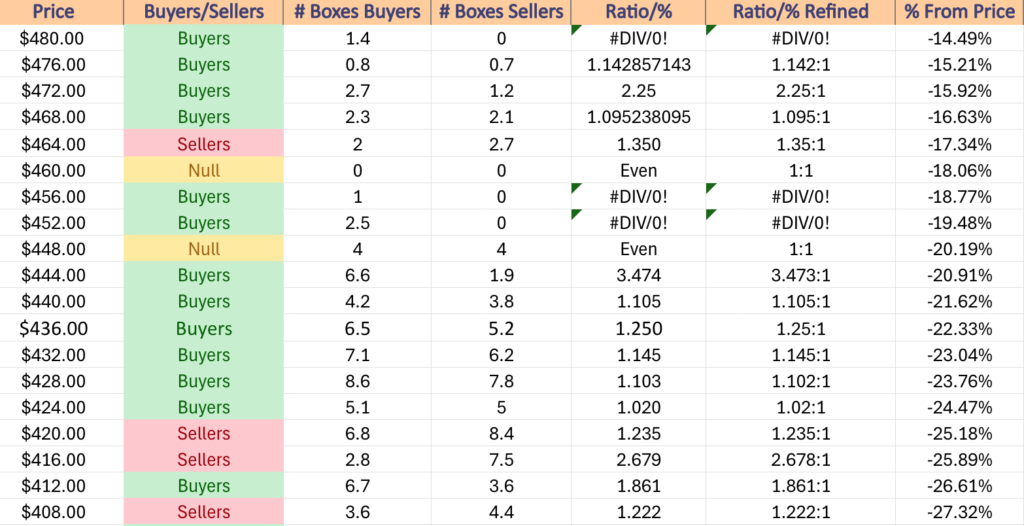
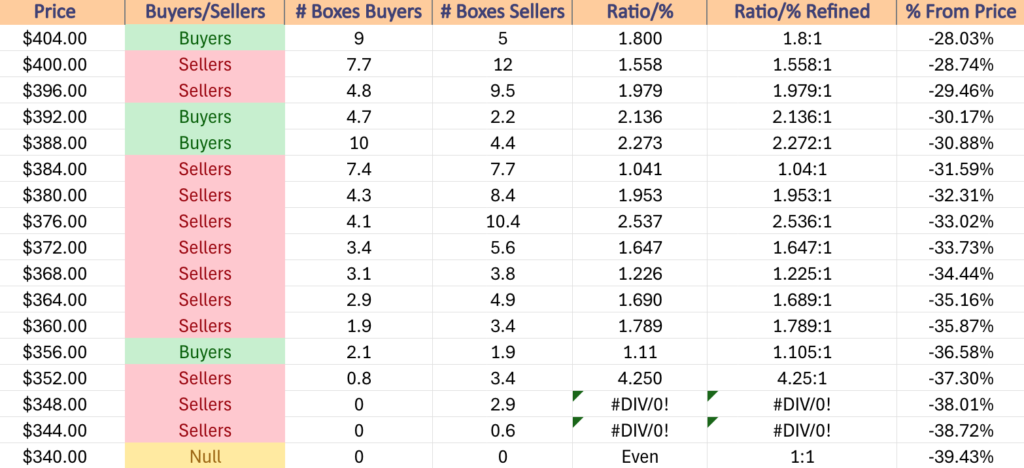
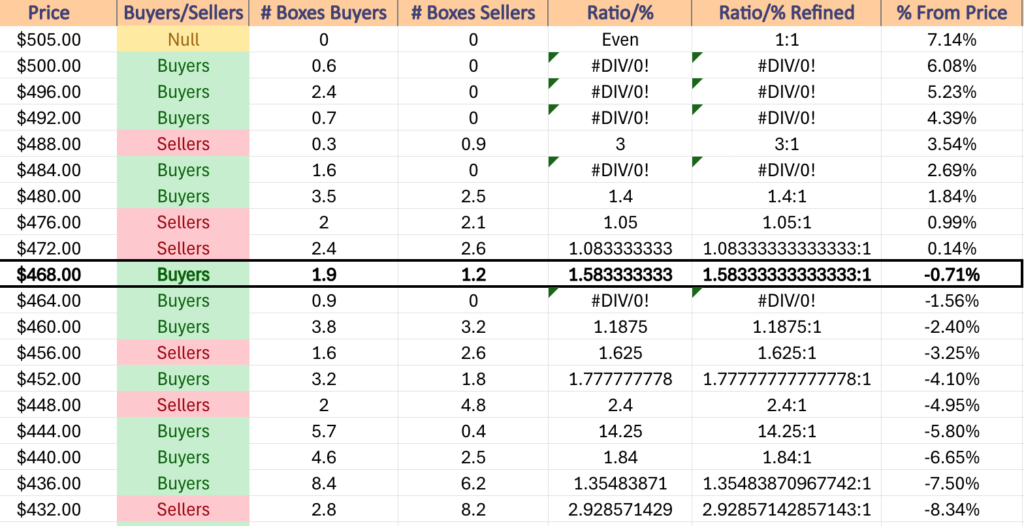
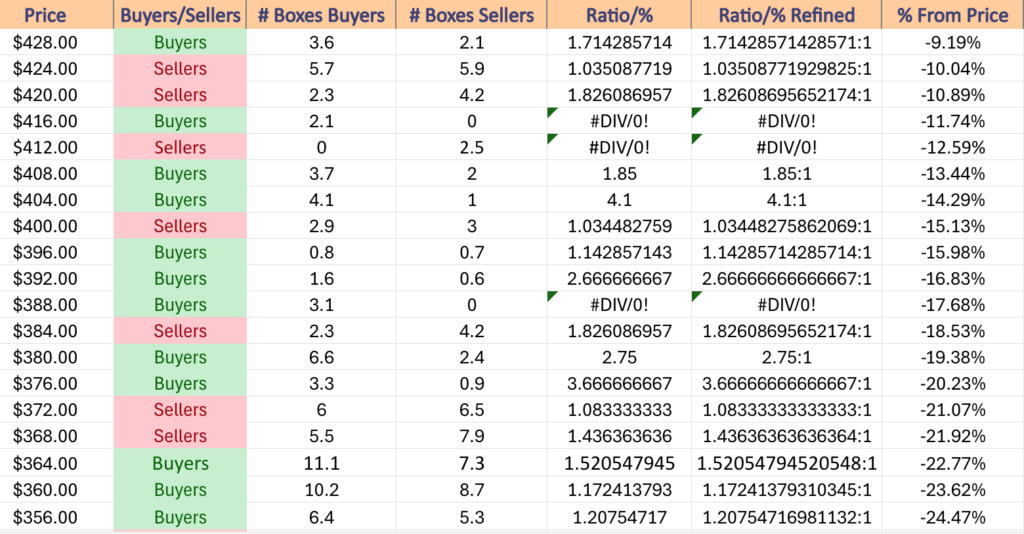
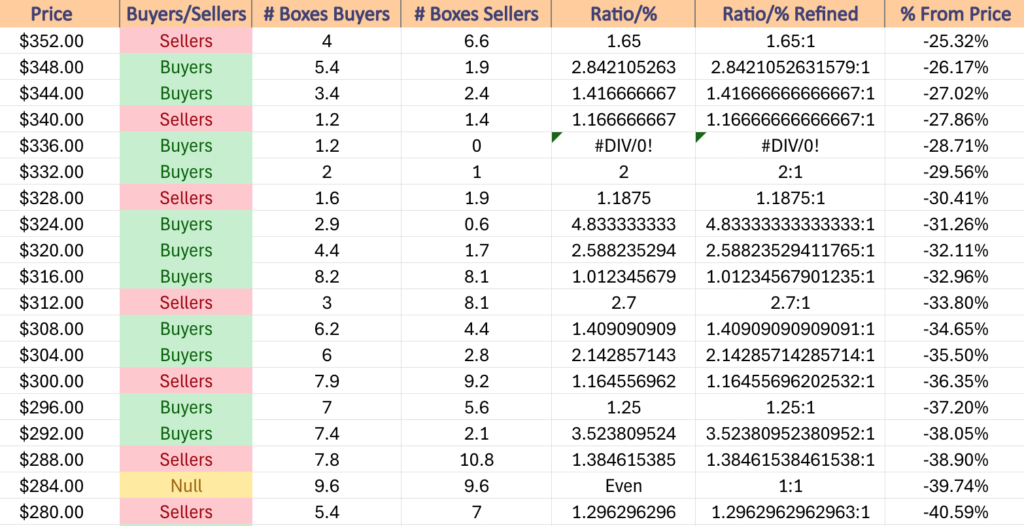
Below is QQQ’s volume sentiment at each price level it has traded at for the past 2-3 years, as well as their support & resistance levels with the sentiments noted.
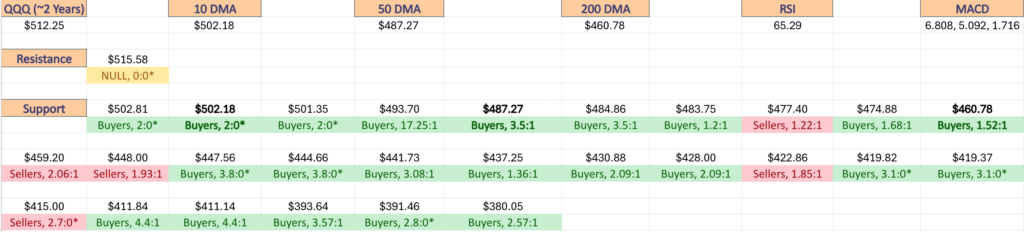
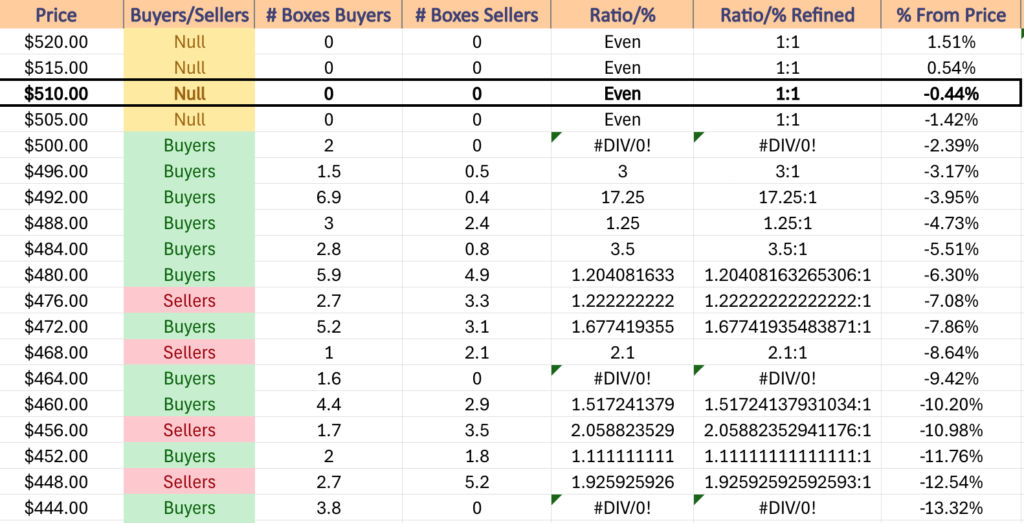
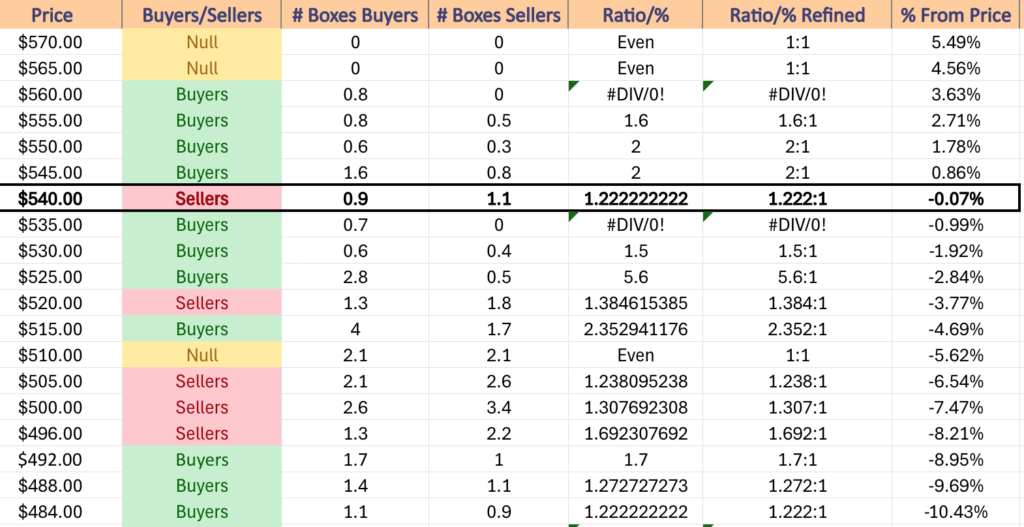
$520 – NULL – 0:0*, +1.51% From Current Price Level
$515 – NULL – 0:0*, +0.54% From Current Price Level – All-Time High*
$510 – NULL – 0:0*, -0.44% From Current Price Level – Current Price Level*
$505 – NULL – 0:0*, -1.42% From Current Price Level
$500 – Buyers – 2:0*, -2.39% From Current Price Level – 10 Day Moving Average*
$496 – Buyers – 3:1, -3.17% From Current Price Level
$492 – Buyers – 17.25:1, -3.95% From Current Price Level
$488 – Buyers – 1.25:1, -4.73% From Current Price Level
$484 – Buyers – 3.5:1, -5.51% From Current Price Level – 50 Day Moving Average*
$480 – Buyers – 1.2:1, -6.3% From Current Price Level
$476 – Sellers – 1.22:1, -7.08% From Current Price Level
$472 – Buyers – 1.68:1, -7.86% From Current Price Level
$468 – Sellers – 2.1:1, -8.64% From Current Price Level
$464 – Buyers – 1.6:0*, -9.42% From Current Price Level
$460 – Buyers – 1.52:1, -10.2% From Current Price Level – 200 Day Moving Average*
$456 – Sellers – 2.06:1, -10.98% From Current Price Level
$452 – Buyers – 1.11:1, -11.76% From Current Price Level
$448 – Sellers – 1.93:1, -12.54% From Current Price Level
$444 – Buyers – 3.8:0*, -13.32% From Current Price Level
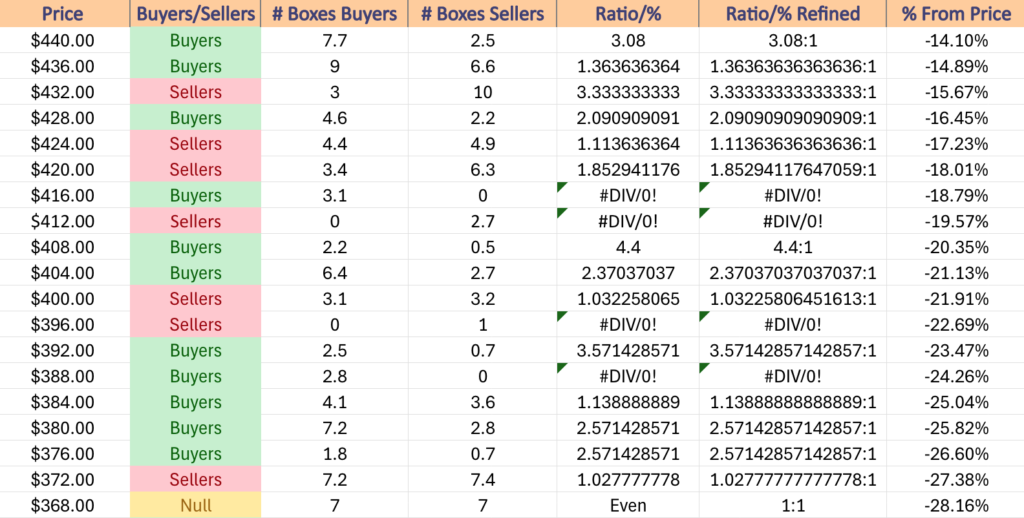
$440 – Buyers – 3.08:1, -14.1% From Current Price Level
$436 – Buyers – 1.36:1, -14.89% From Current Price Level
$432 – Sellers – 3.33:1, -15.67% From Current Price Level
$428 – Buyers – 2.09:1, -16.45% From Current Price Level
$424 – Sellers – 1.11:1, -17.23% From Current Price Level
$420 – Sellers – 1.85:1, -18.01% From Current Price Level
$416 – Buyers – 3.1:0*, -18.79% From Current Price Level
$412 – Sellers – 2.7:0*, -19.57% From Current Price Level
$408 – Buyers – 4.4:1, -20.35% From Current Price Level
$404 – Buyers – 2.37:1, -21.13% From Current Price Level
$400 – Sellers – 1.03:1, -21.91% From Current Price Level
$396 – Sellers – 1:0*, -22.69% From Current Price Level
$392 – Buyers – 3.57:1, -23.47% From Current Price Level
$388 – Buyers – 2.8:0*, -24.26% From Current Price Level
$384 – Buyers – 1.14:1, -25.04% From Current Price Level
$380 – Buyers – 2.57:1, -25.82% From Current Price Level
$376 – Buyers – 2.57:1, -26.6% From Current Price Level
$372 – Sellers – 1.03:1, -27.38% From Current Price Level
$368 – Even – 1:1, -28.16% From Current Price Level
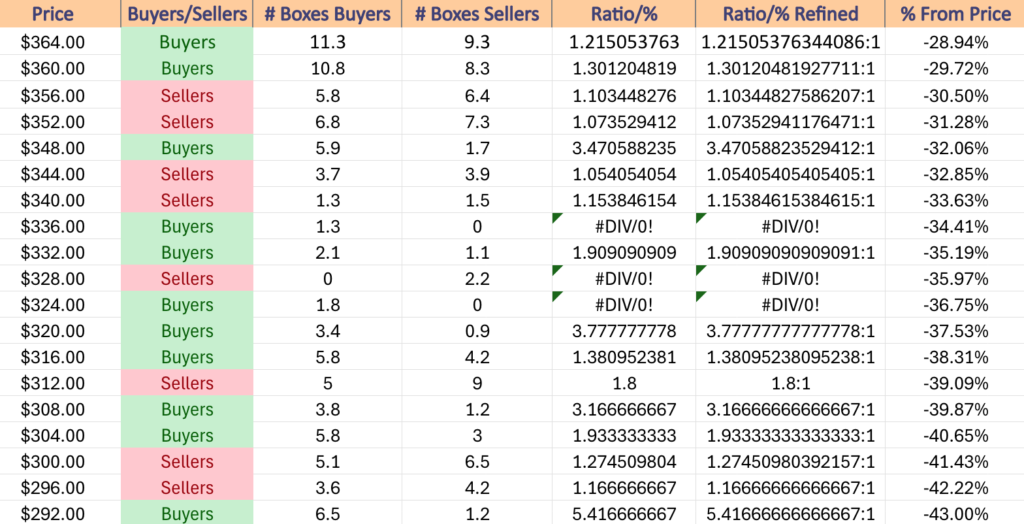
$364 – Buyers – 1.22:1, -28.94% From Current Price Level
$360 – Buyers – 1.3:1, -29.72% From Current Price Level
$356 – Sellers – 1.1:1, -30.5% From Current Price Level
$352 – Sellers – 1.07:1, -31.28% From Current Price Level
$348 – Buyers – 3.47:1, -32.06% From Current Price Level
$344 – Sellers – 1.05:1, -32.85% From Current Price Level
$340 – Sellers – 1.15:1, -33.63% From Current Price Level
$336 – Buyers – 1.3:0*, -34.41% From Current Price Level
$332 – Buyers – 1.91:1, -35.19% From Current Price Level
$328 – Sellers – 2.2:0*, -35.97% From Current Price Level
$324 – Buyers – 1.8:0*, -36.75% From Current Price Level
$320 – Buyers – 3.78:1, -37.53% From Current Price Level
$316 – Buyers – 1.38:1, -38.31% From Current Price Level
$312 – Sellers – 1.8:1, -39.09% From Current Price Level
$308 – Buyers – 3.17:1, -39.87% From Current Price Level
$304 – Buyers – 1.93:1, -40.65% From Current Price Level
$300 – Sellers – 1.28:1, -41.43% From Current Price Level
$296 – Sellers – 1.17:1, -42.22% From Current Price Level
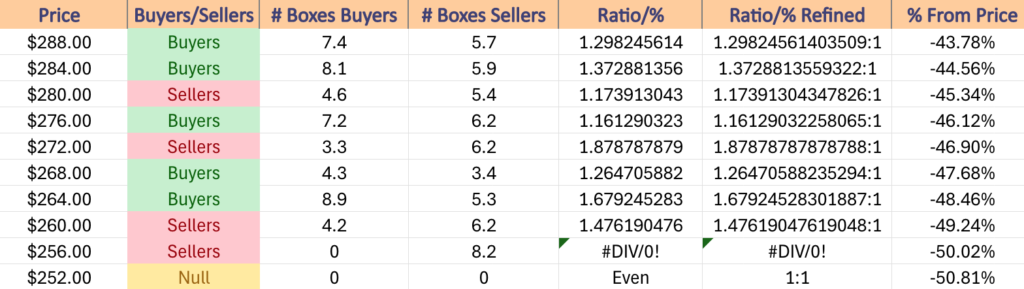
$292 – Buyers – 5.42:1, -43% From Current Price Level
$288 – Buyers – 1.3:1, -43.78% From Current Price Level
$284 – Buyers – 1.37:1, -44.56% From Current Price Level
$280 – Sellers – 1.17:1, -45.34% From Current Price Level
$276 – Buyers – 1.16:1, -46.12% From Current Price Level
$272 – Sellers – 1.88:1, -46.9% From Current Price Level
$268 – Buyers – 1.27:1, -47.68% From Current Price Level
$264 – Buyers – 1.68:1, -48.46% From Current Price Level
$260 – Sellers – 1.48:1, -49.24% From Current Price Level
$256 – Sellers – 8.2:0*, -50.02% From Current Price Level
$252 – NULL – 0:0*, -50.81% From Current Price Level
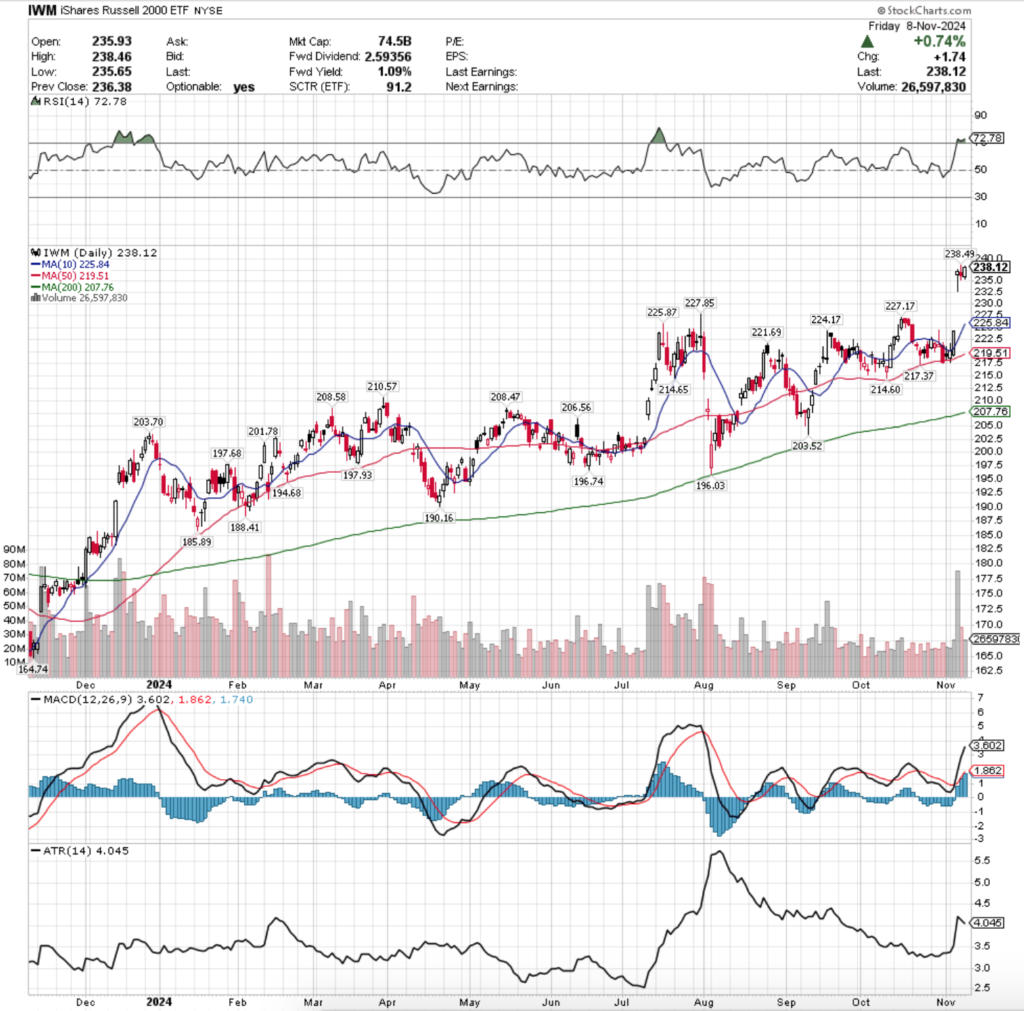
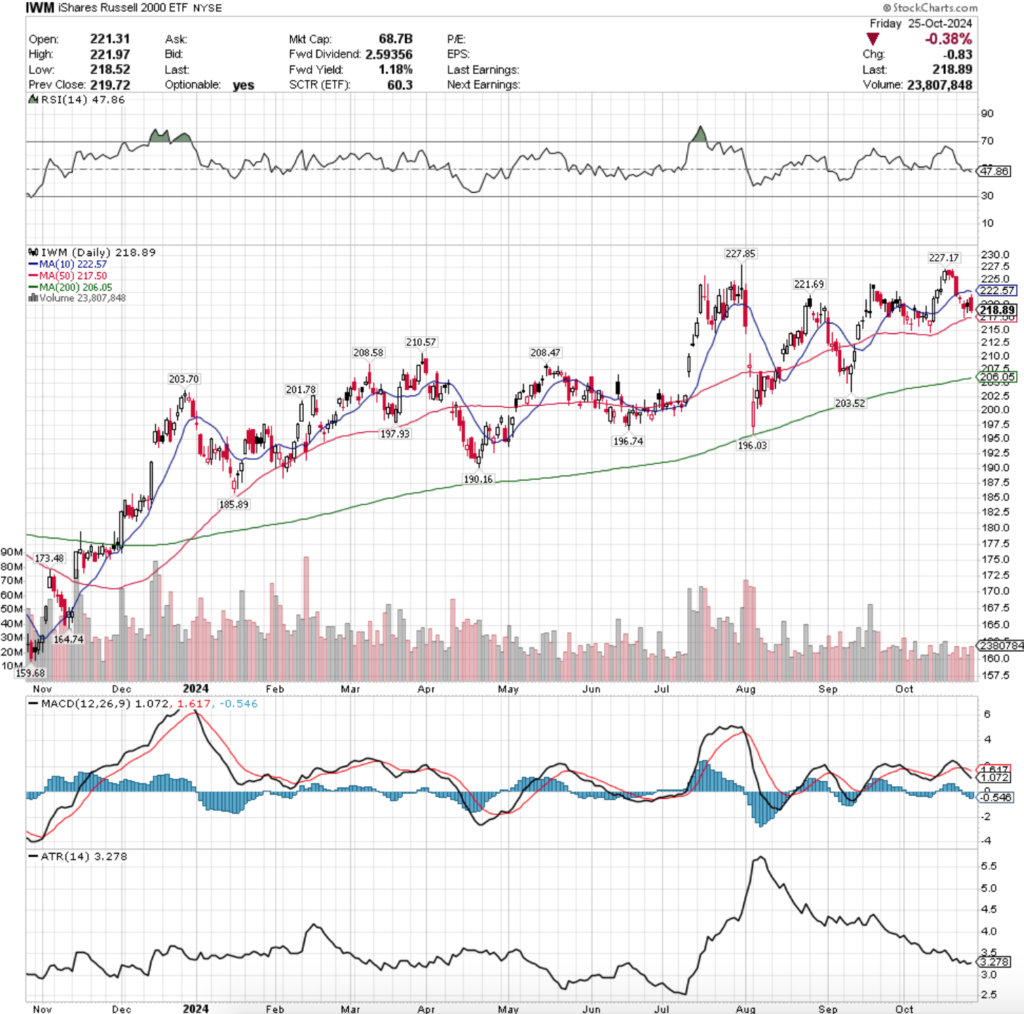
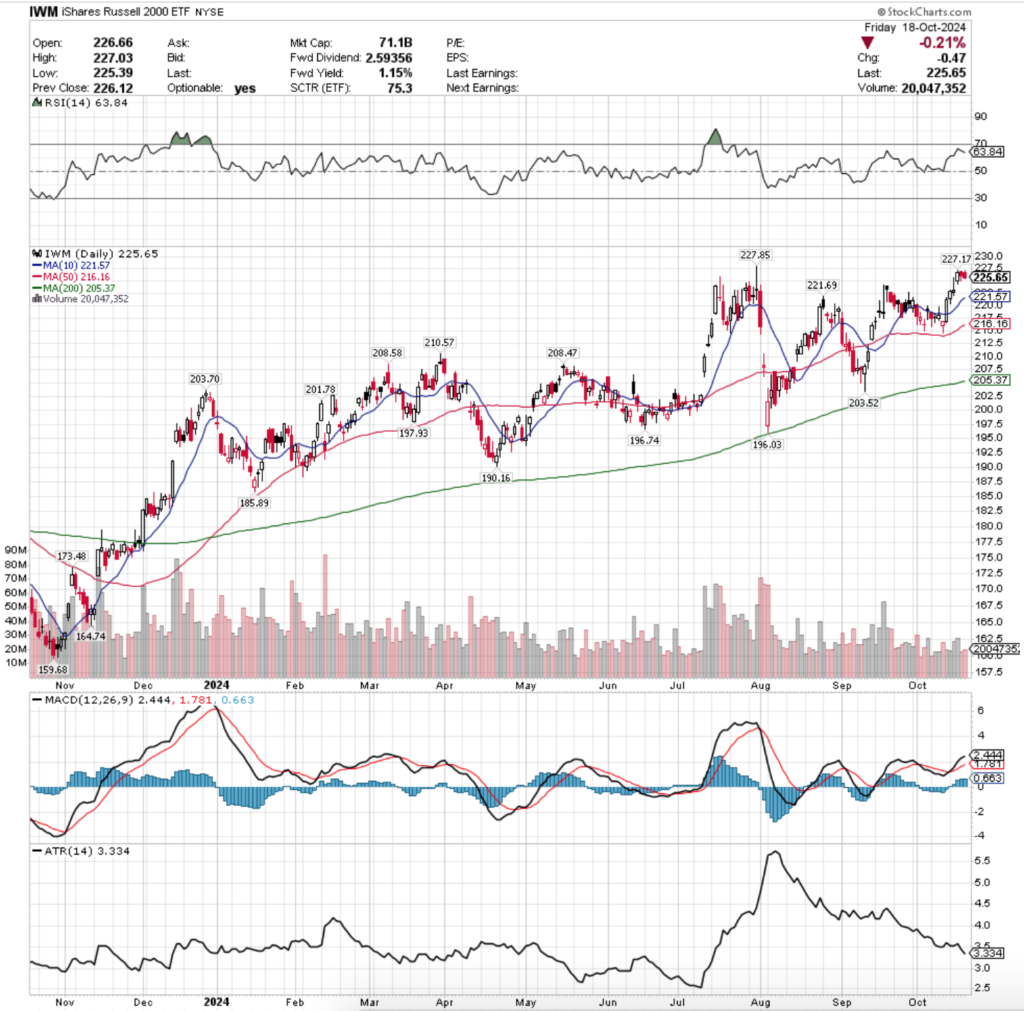
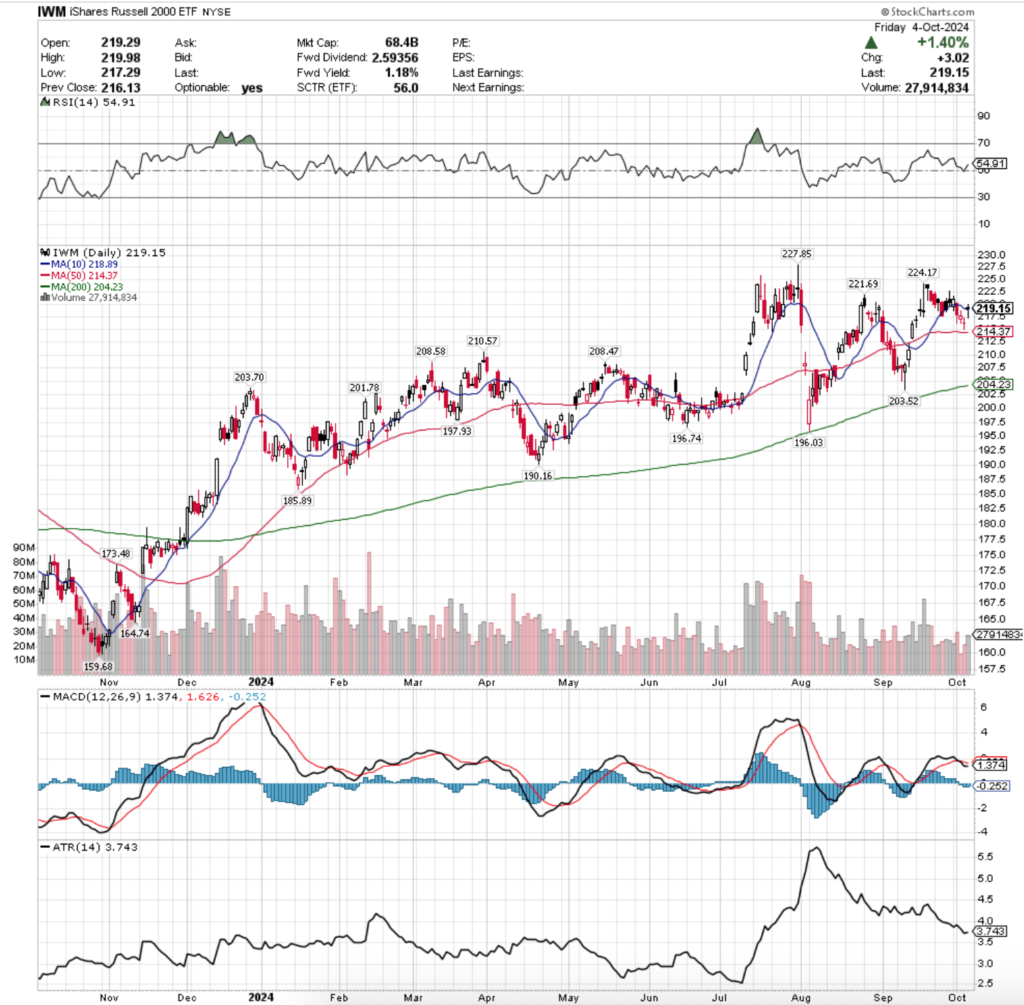
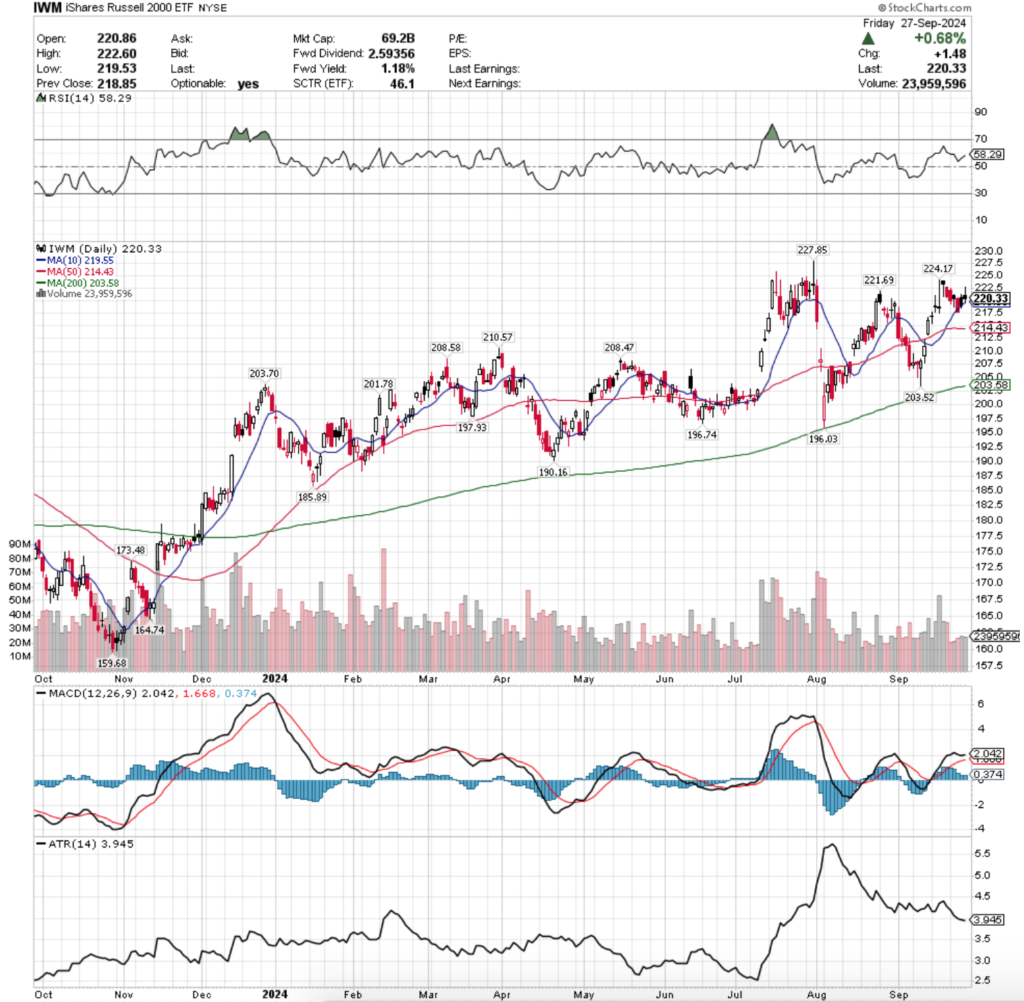
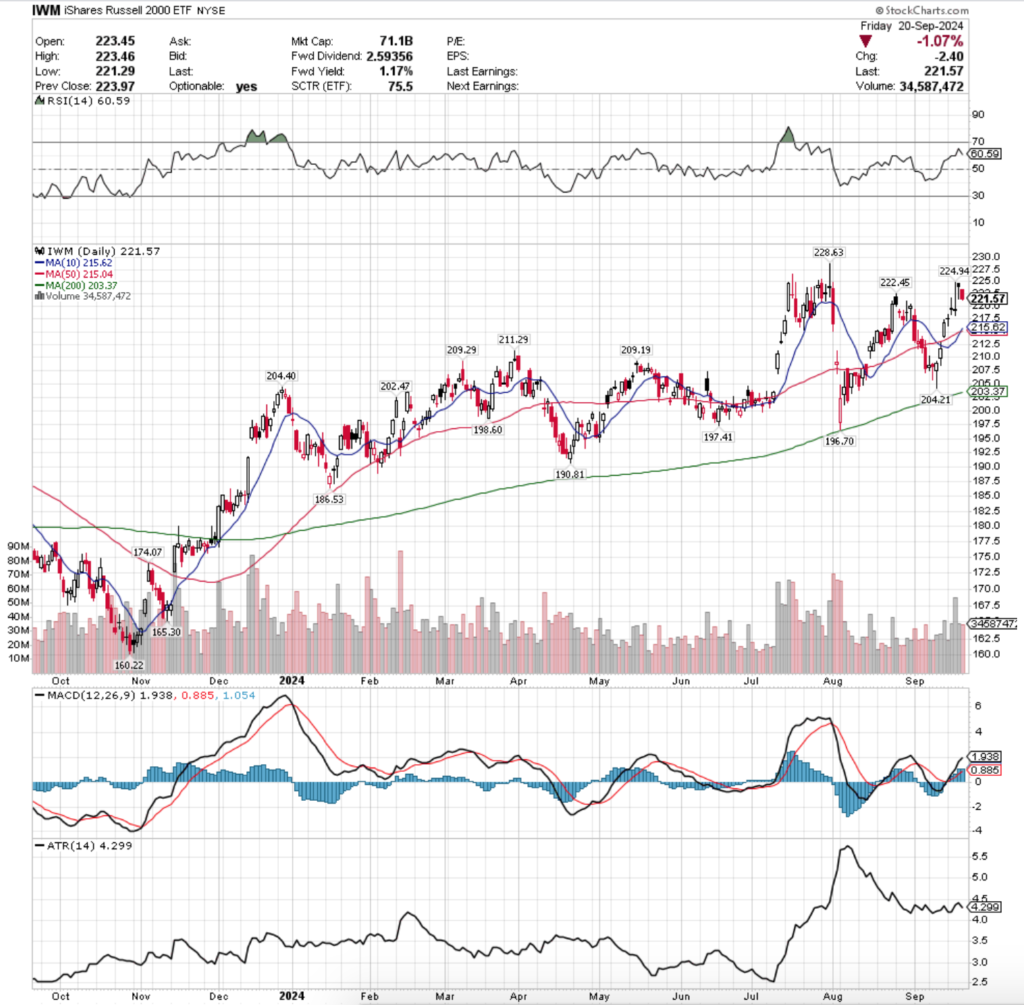
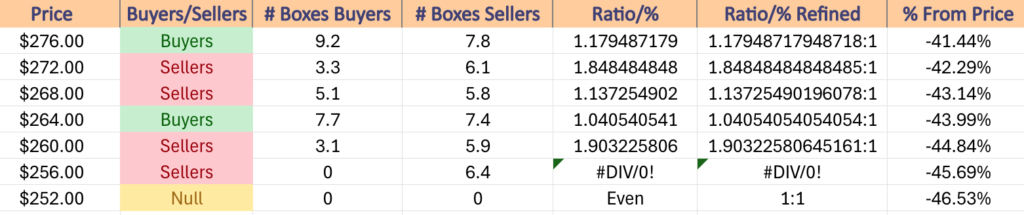
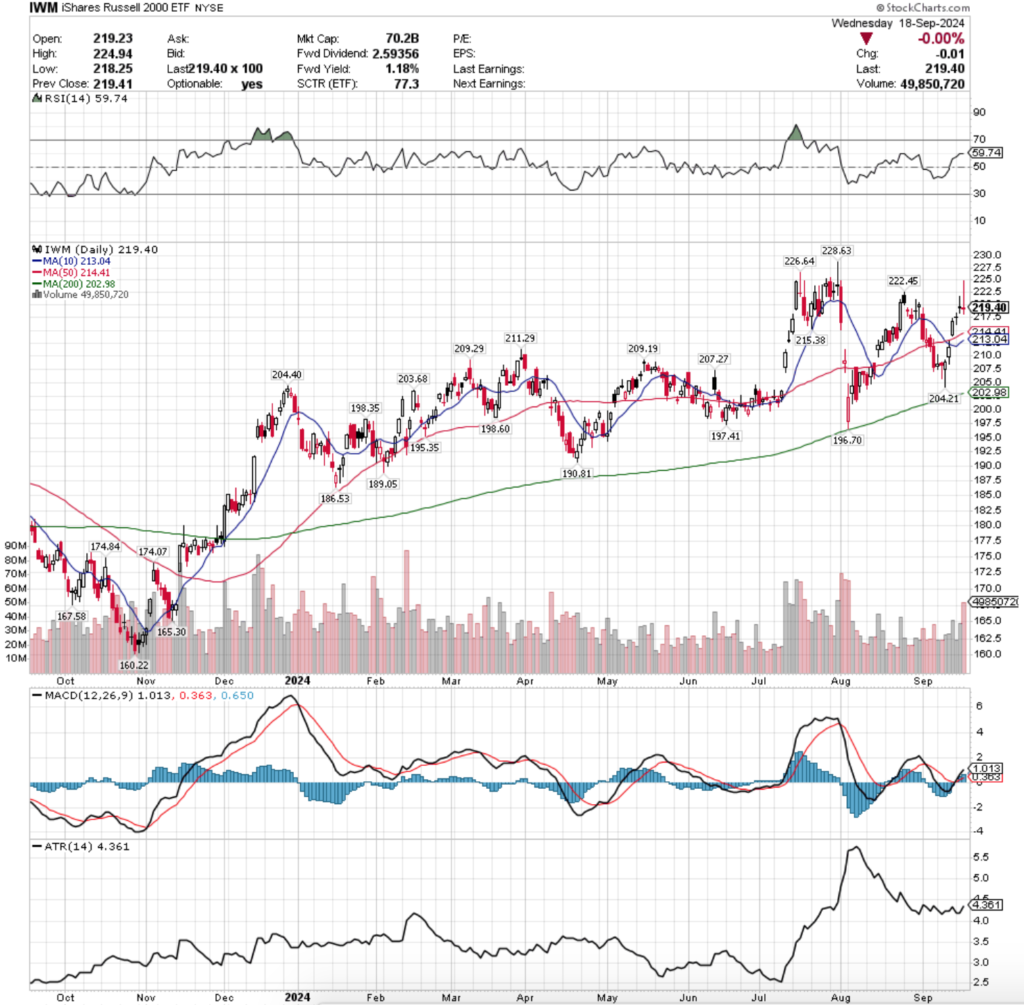
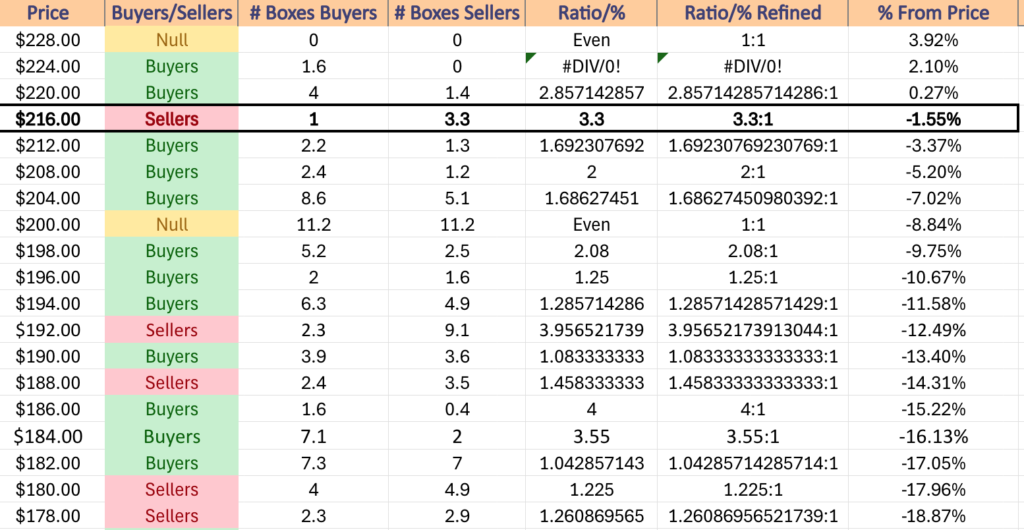
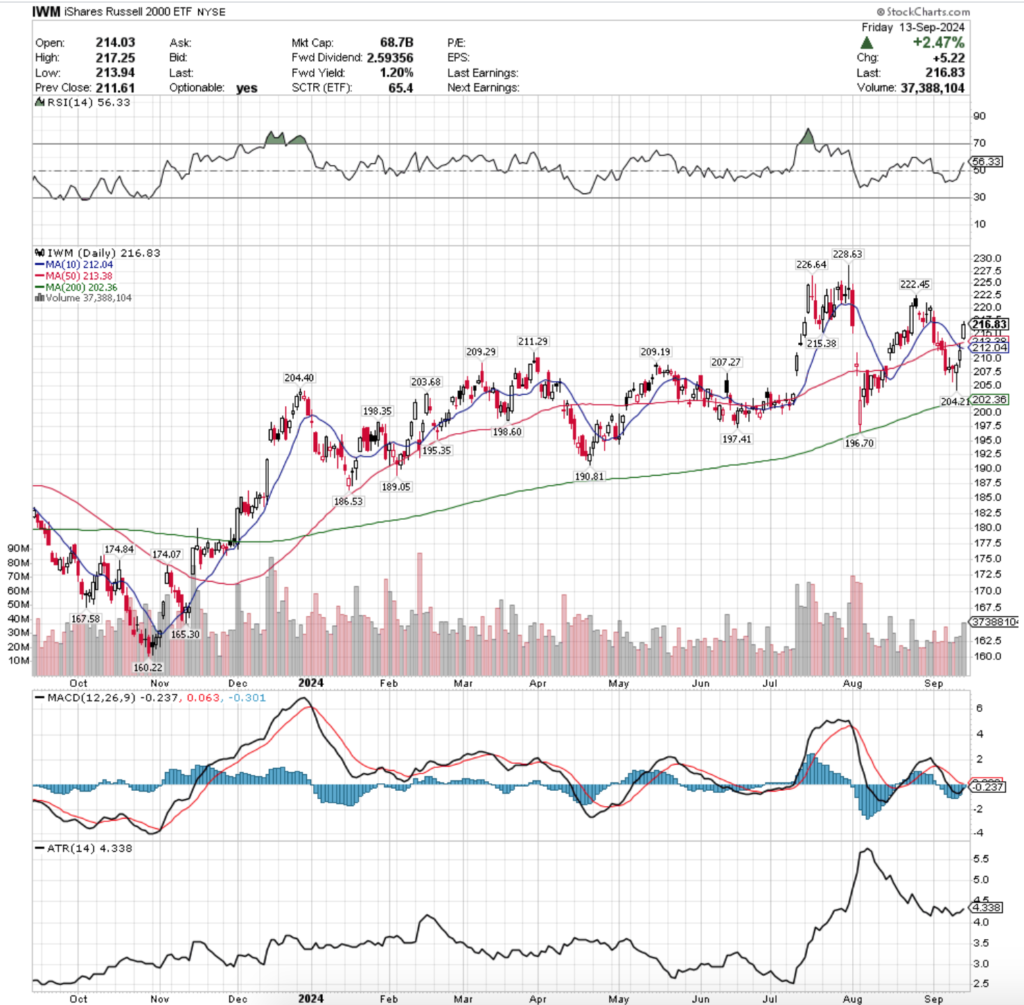
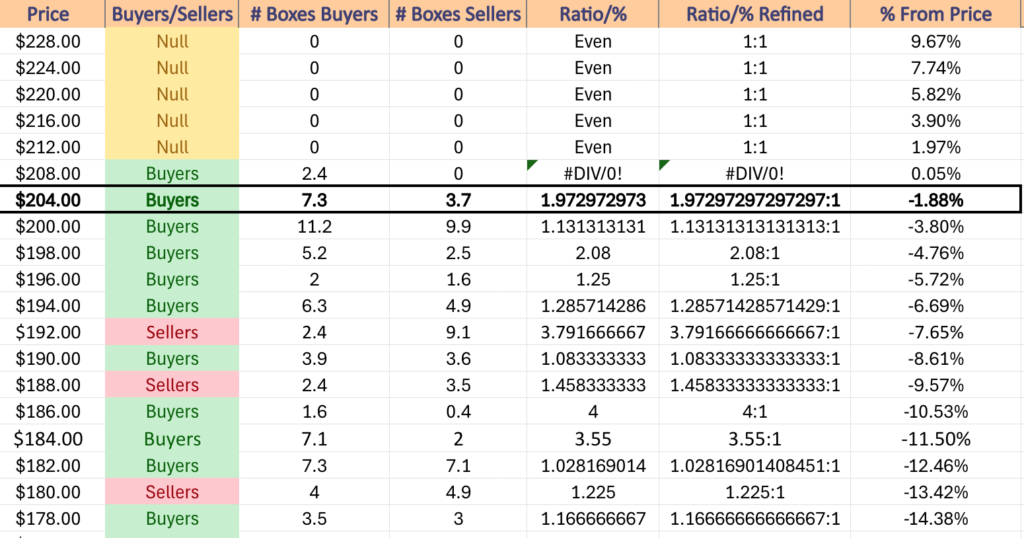
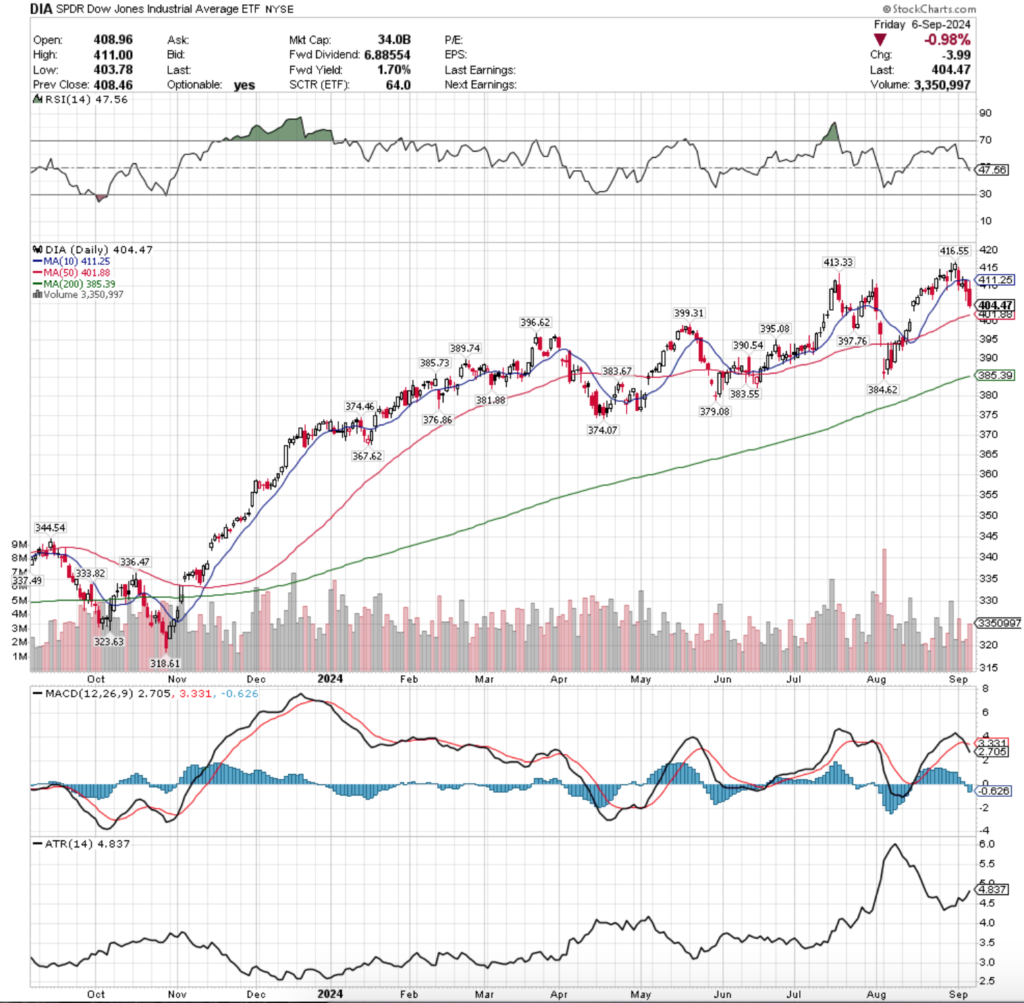
Price Level:Volume Sentiment Analysis For IWM, The iShares Russell 2000 ETF
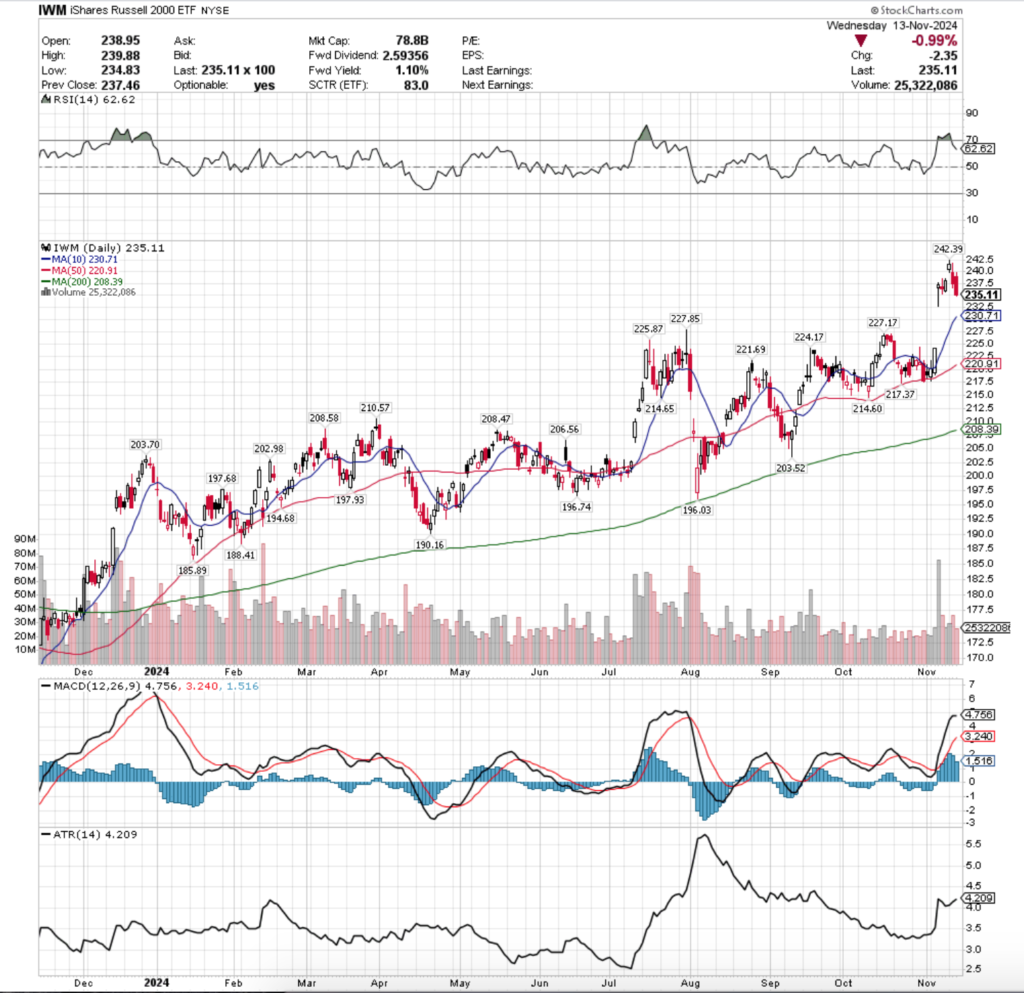
IWM, the iShares Russell 2000 ETF was the biggest winner of the major four index ETFs over the past week in terms of their post-election gap up.
They enjoy a number of support levels just below the window that was created by that gap which will benefit them in the face of a decline.
Unlike the prior two ETFs, IWM’s recently weekly volumes have been higher when compared to their prior year’s average volume vs. seven months ago when the same comparison was made, indicating that there has been a rotation towards smaller cap names vs. SPY & QQQ components.
Still, this doesn’t make them immune to any drawdowns & it is worth reviewing the tables below to understand how market participants have felt at the price levels they’ve traded at.
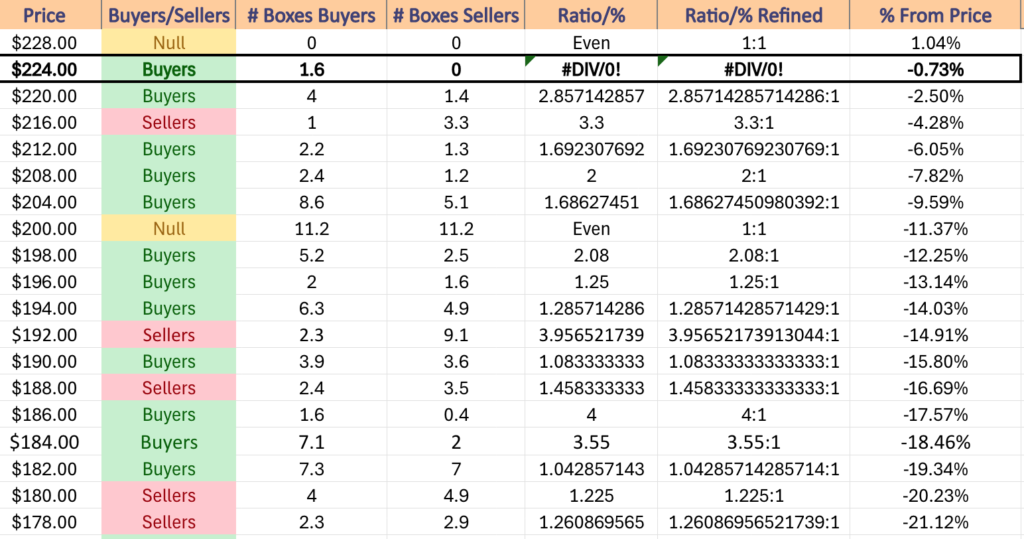
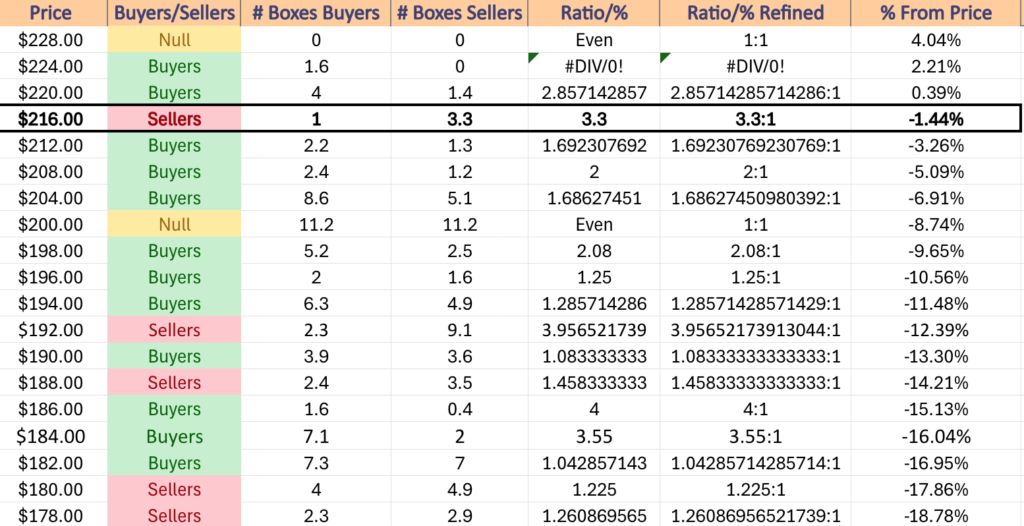
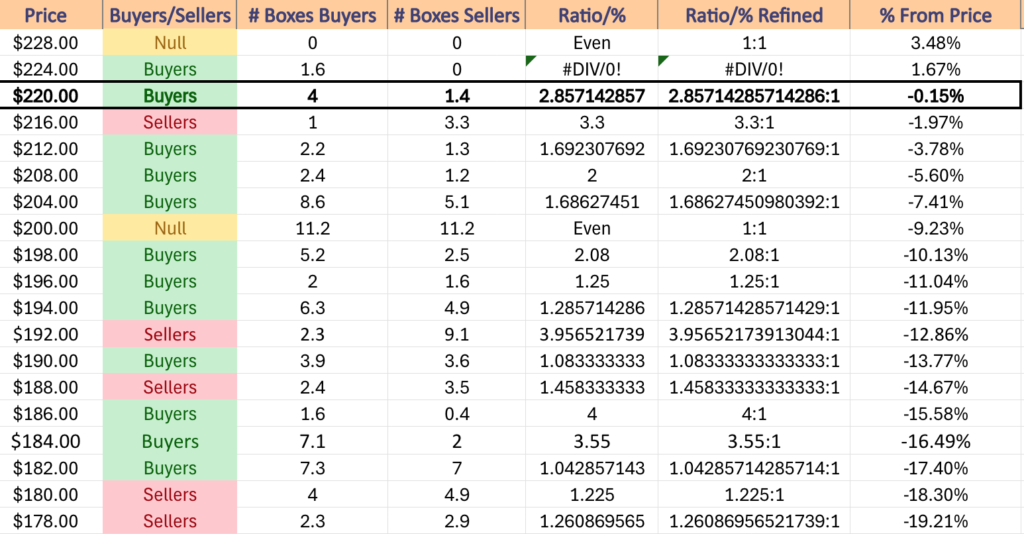
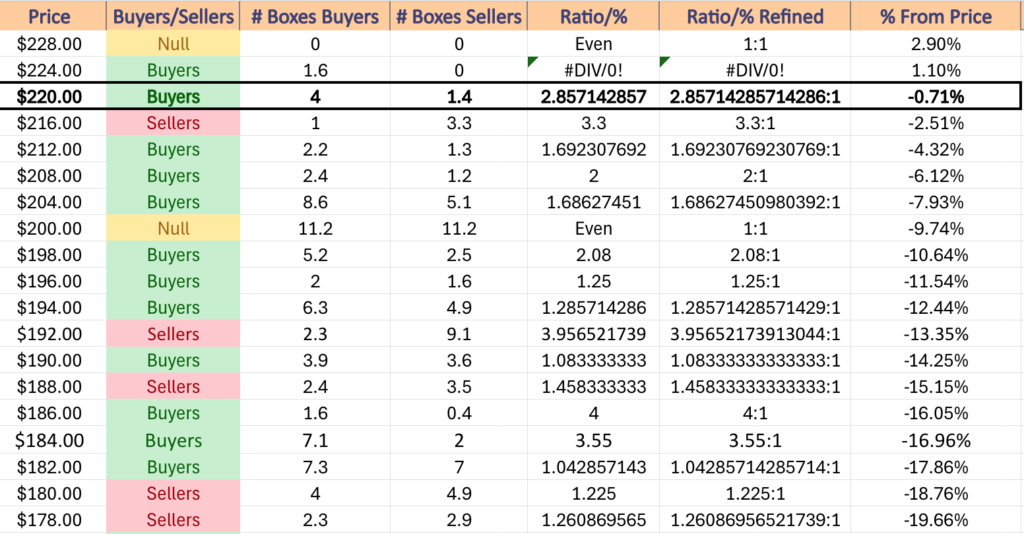
This index trades in a much more consolidated range-bound fashion & slowly advances while oscillating around a price range compared to how SPY & QQQ trade, so their list of price levels for the past 2-3 years is shorter than the previous two ETFs.
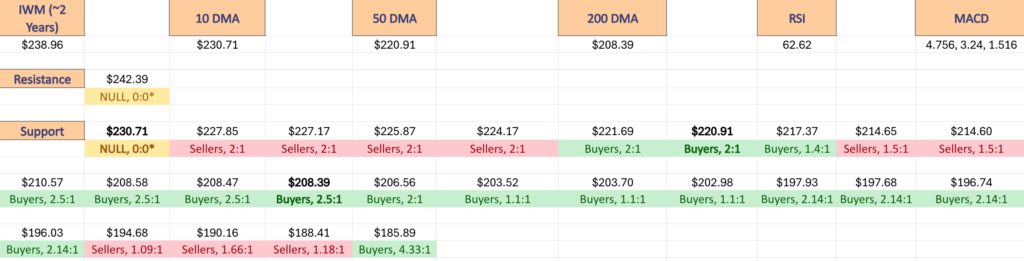
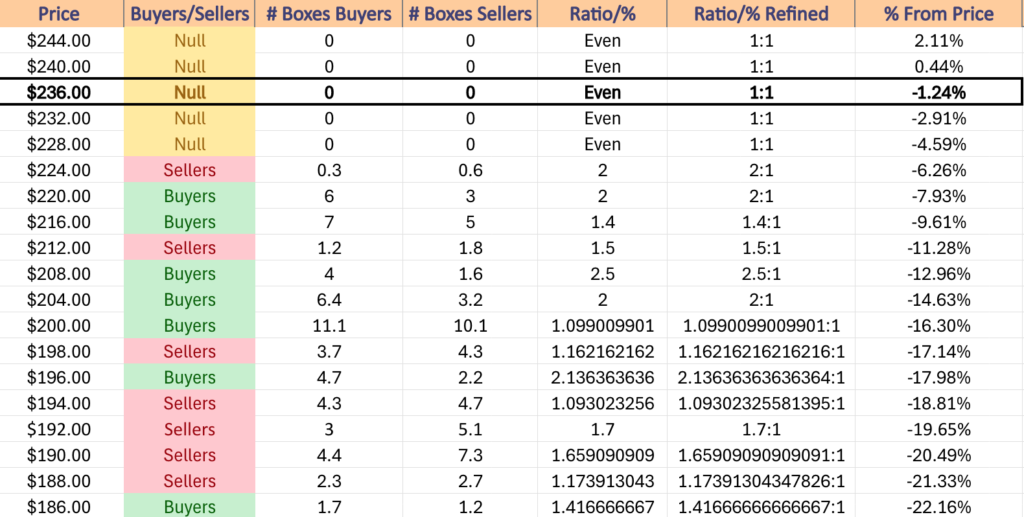
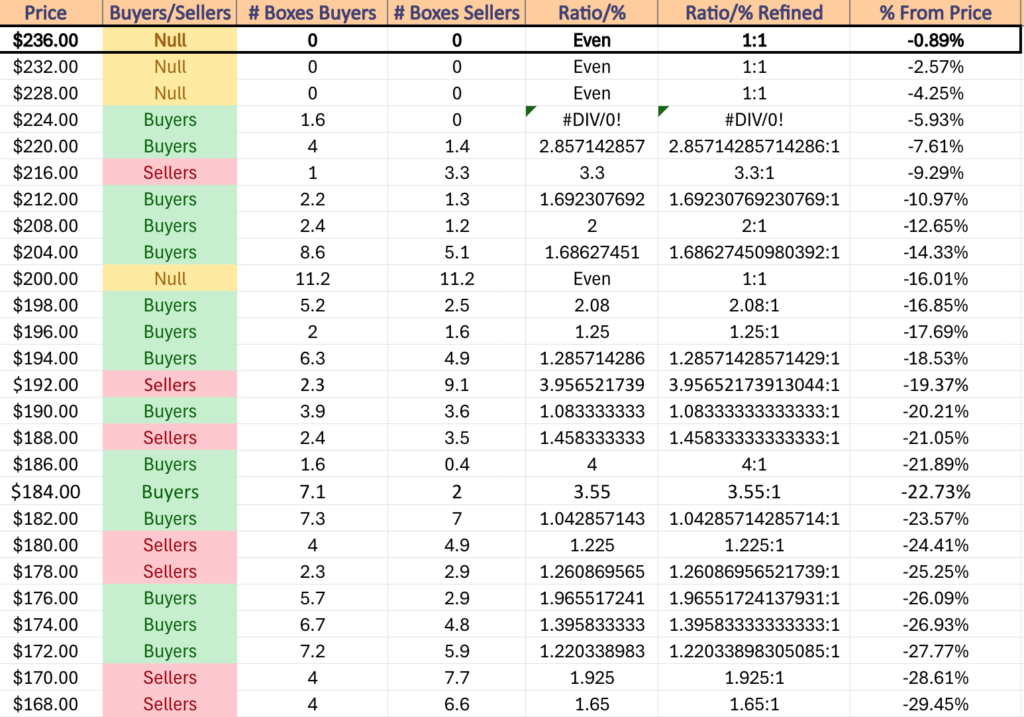
$244 – NULL – 0:0*, +2.11% From Current Price Level
$240 – NULL – 0:0*, +0.44% From Current Price Level – All Time High*
$236 – NULL – 0:0*, -1.24% From Current Price Level – Current Price Level*
$232 – NULL – 0:0*, -2.91% From Current Price Level
$228 – NULL – 0:0*, -4.59% From Current Price Level – 10 Day Moving Average*
$224 – Sellers – 2:1, -6.26% From Current Price Level
$220 – Buyers – 2:1,-7.93% From Current Price Level – 50 Day Moving Average*
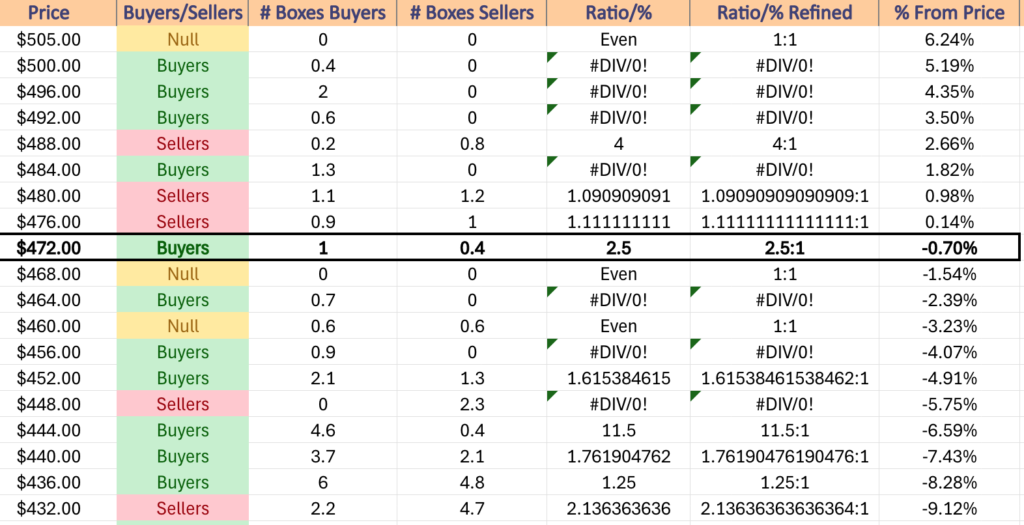
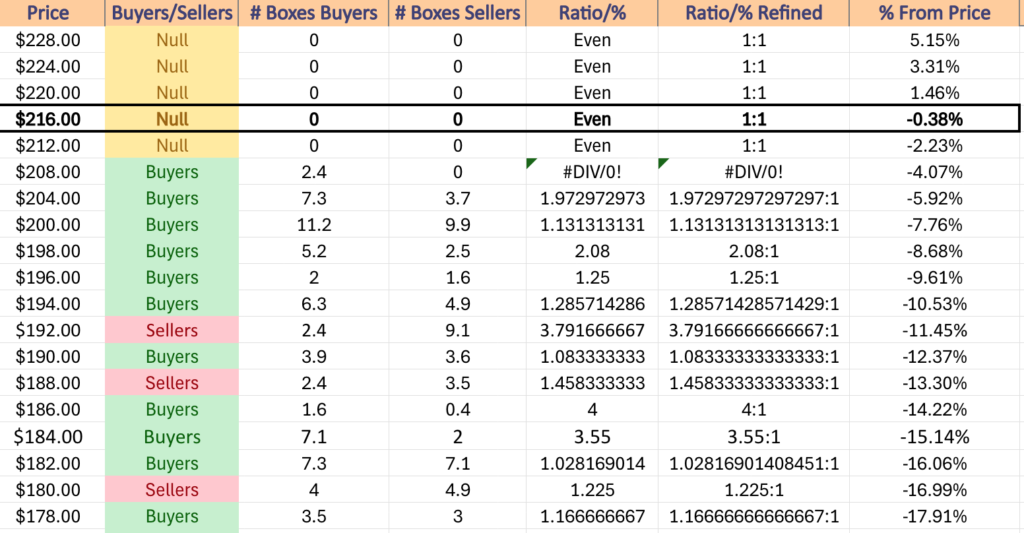
$216 – Buyers – 1.4:1, -9.61% From Current Price Level
$212 – Sellers – 1.5:1, -11.28% From Current Price Level
$208 – Buyers – 2.5:1, -12.96% From Current Price Level – 200 Day Moving Average*
$204 – Buyers – 2:1, -14.63% From Current Price Level
$200 – Buyers – 1.1:1, -16.3% From Current Price Level
$198 – Sellers – 1.16:1, -17.14% From Current Price Level
$196 – Buyers – 2.14:1, -17.98% From Current Price Level
$194 – Sellers – 1.09:1, -18.81% From Current Price Level
$192 – Sellers – 1.7:1, -19.65% From Current Price Level
$190 – Sellers – 1.66:1, -20.49% From Current Price Level
$188 – Sellers – 1.17:1, -21.33% From Current Price Level
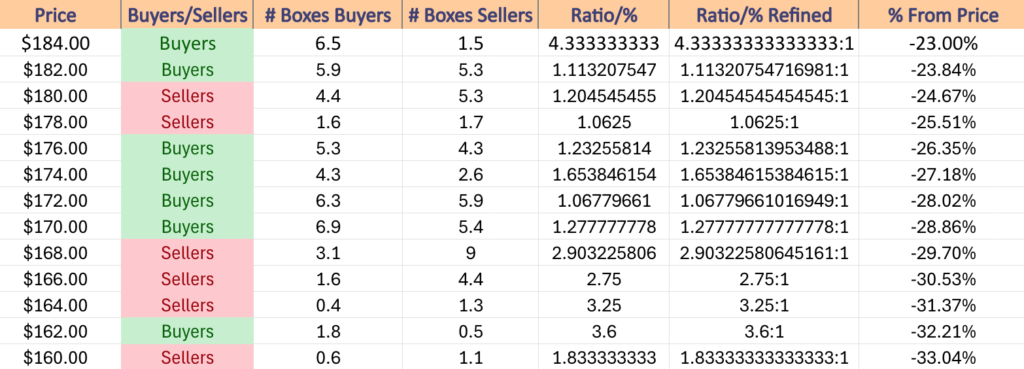
$186 – Buyers – 1.42:1, -22.16% From Current Price Level
$184 – Buyers – 4.33:1, -23% From Current Price Level
$182 – Buyers – 1.11:1, -23.84% From Current Price Level
$180 – Sellers – 1.2:1, -24.67% From Current Price Level
$178 – Sellers – 1.06:1, -25.51% From Current Price Level
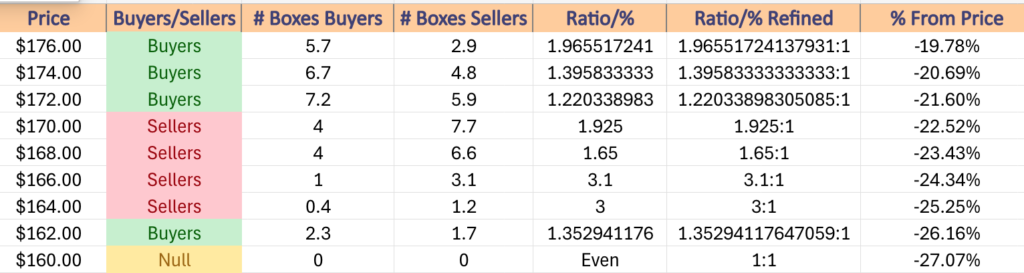
$176 – Buyers – 1.23:1, -26.35% From Current Price Level
$174 – Buyers – 1.65:1, -27.18% From Current Price Level
$172 – Buyers – 1.07:1, -28.02% From Current Price Level
$170 – Buyers – 1.28:1, -28.86% From Current Price Level
$168 – Sellers – 2.9:1, -29.7% From Current Price Level
$166 – Sellers – 2.75:1, -30.53% From Current Price Level
$164 – Sellers – 3.25:1, -31.37% From Current Price Level
$162 – Buyers – 3.6:1, -32.21% From Current Price Level
$160 – Sellers – 1.83:1, -33.04% From Current Price Level
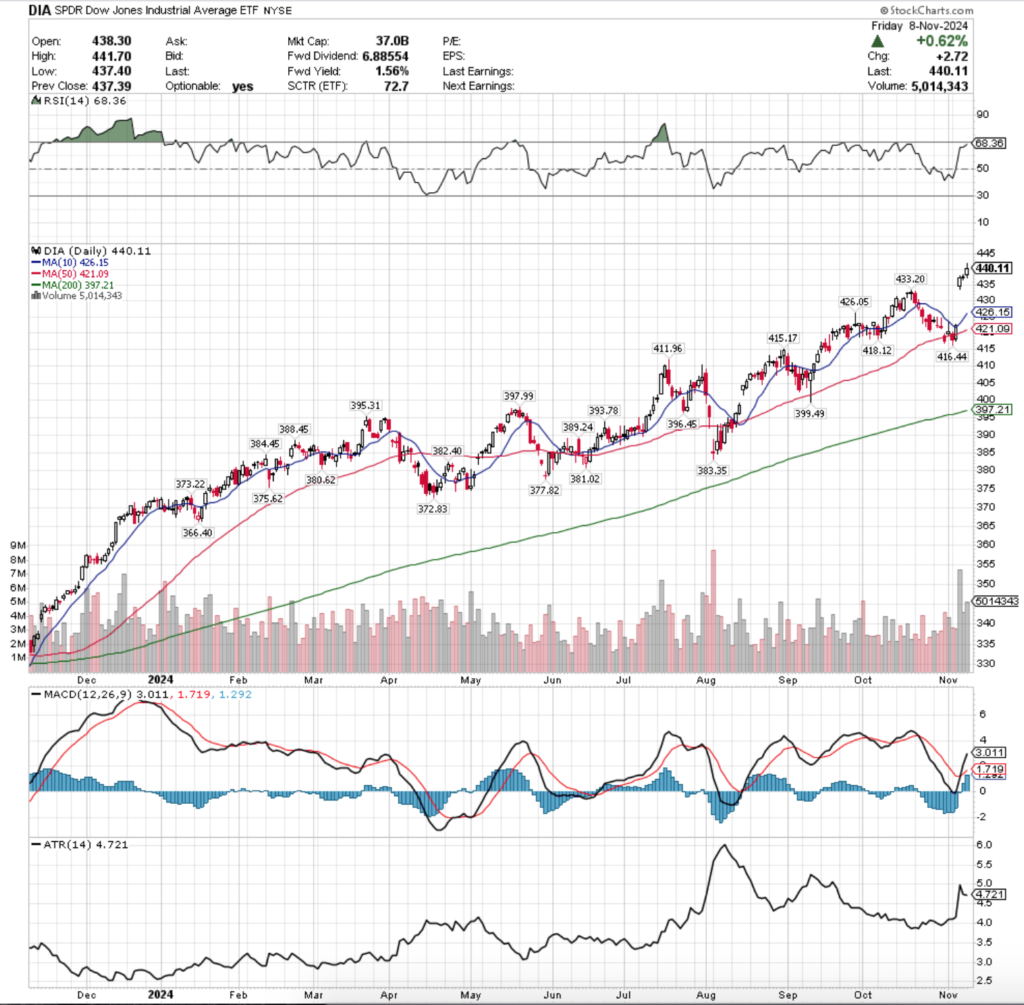
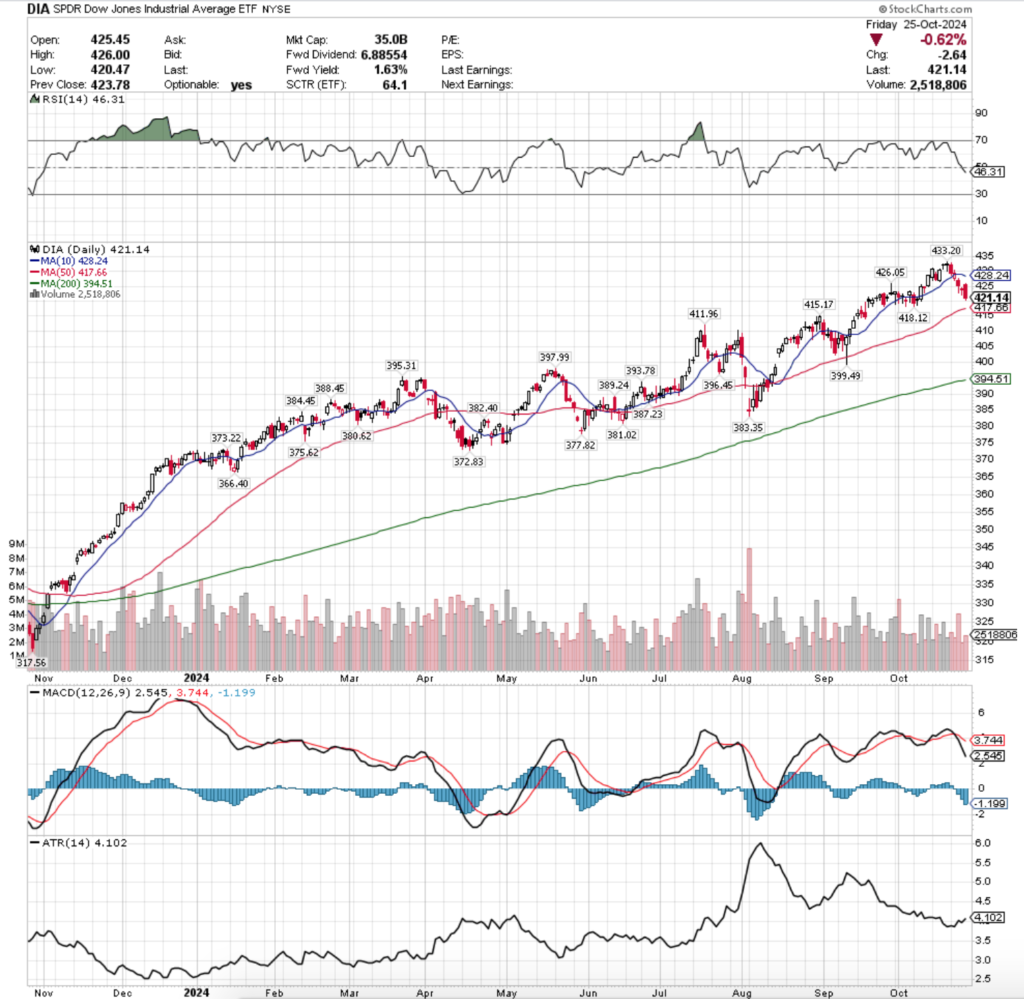
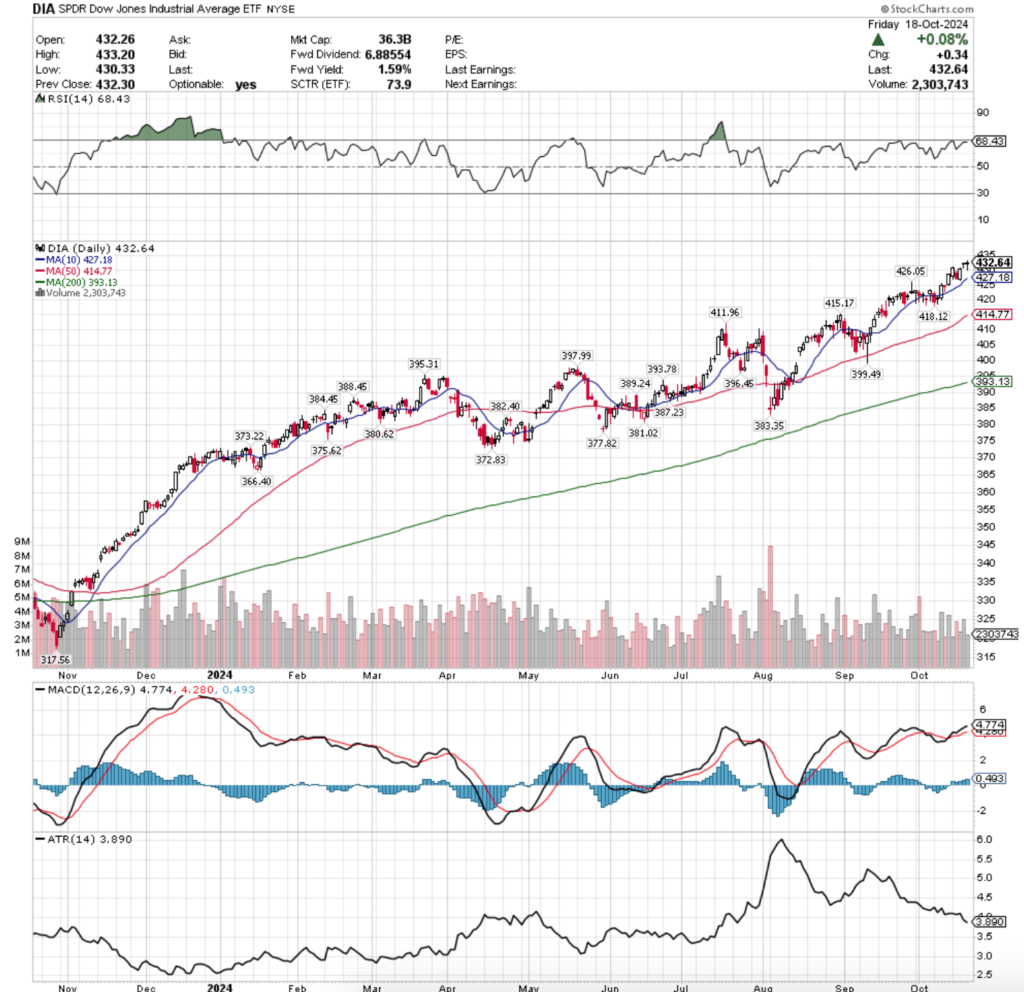
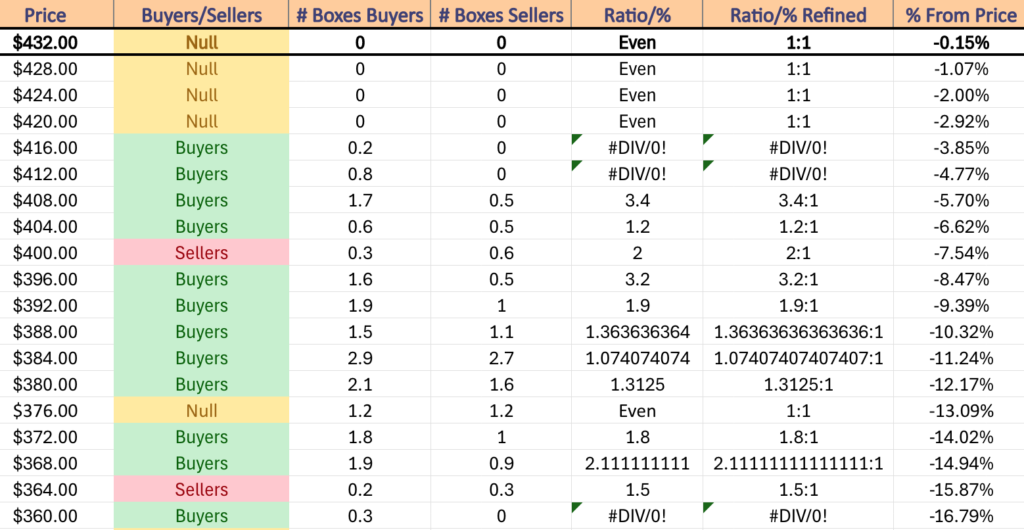
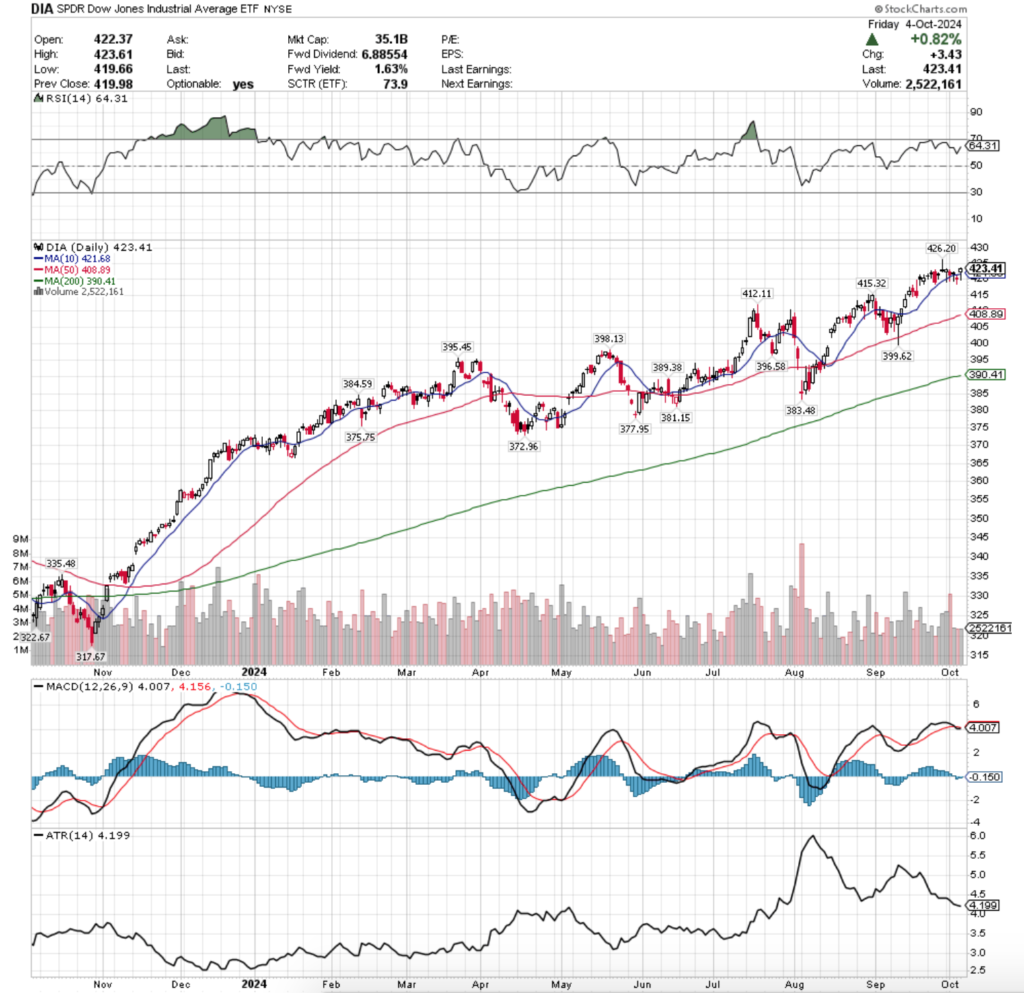
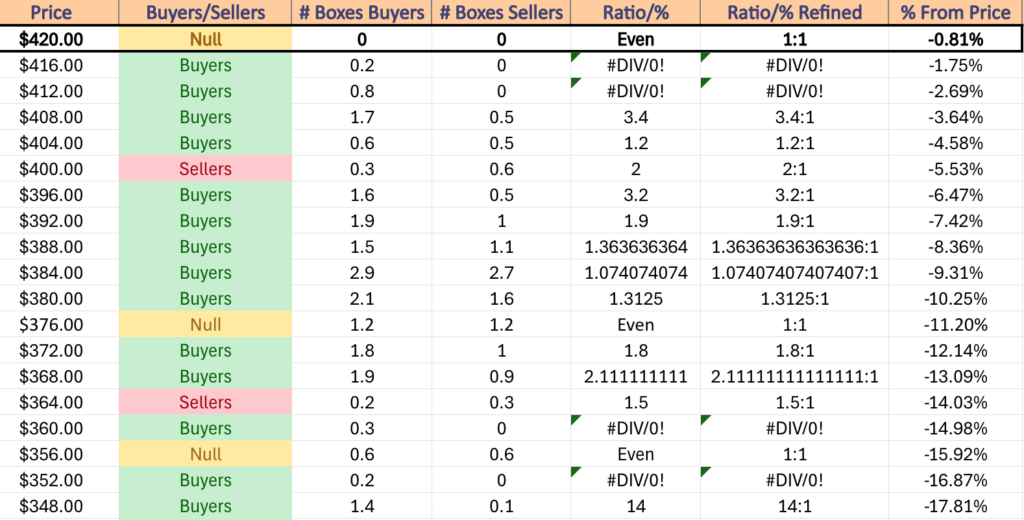
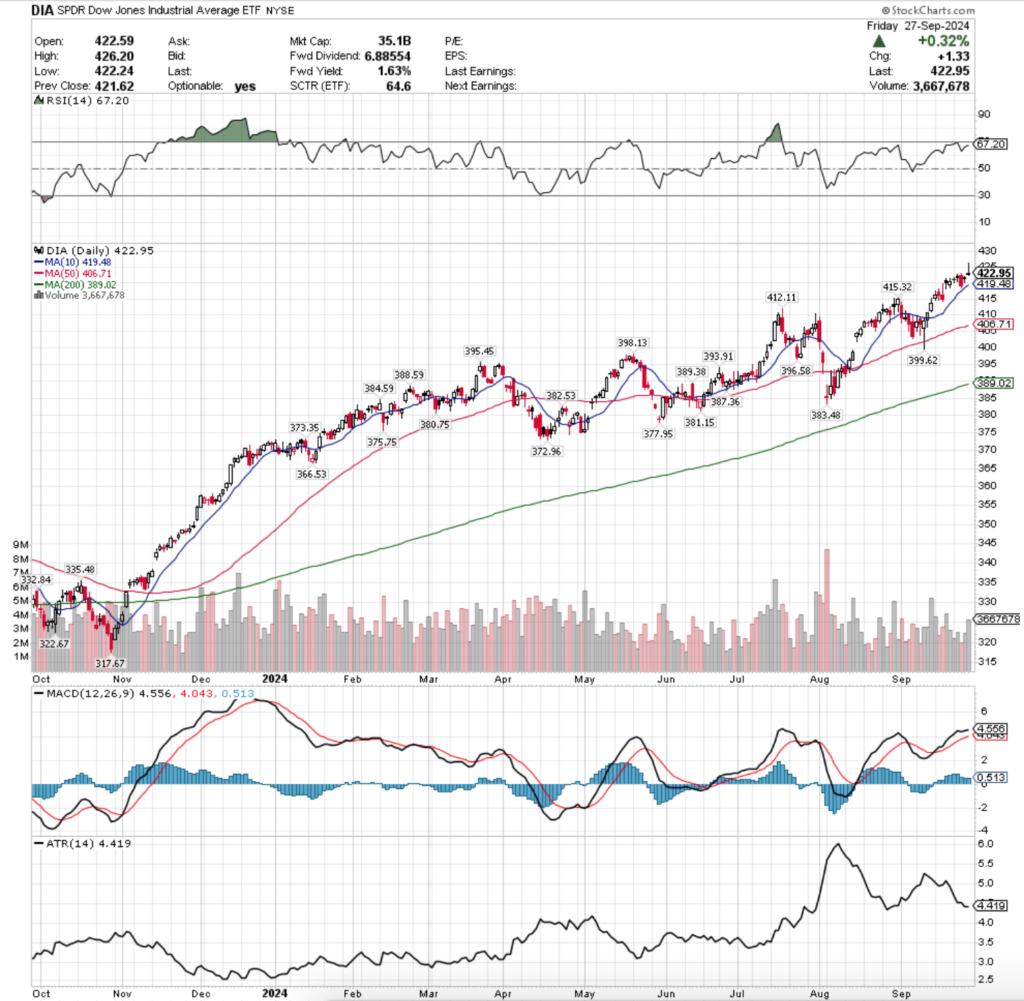
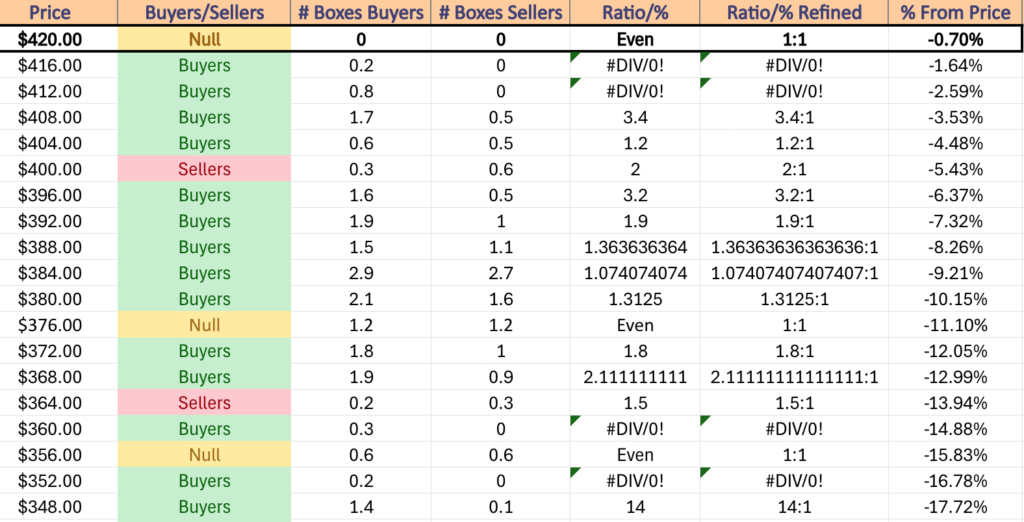
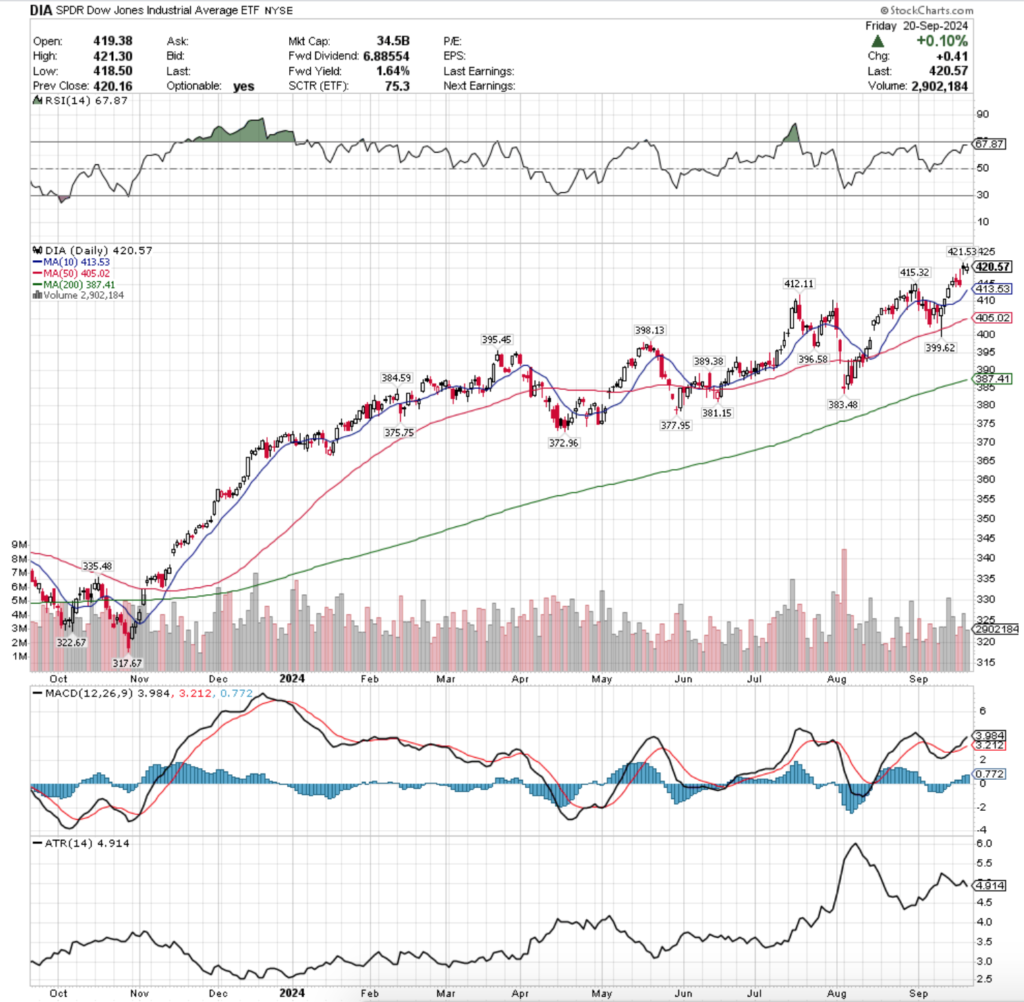
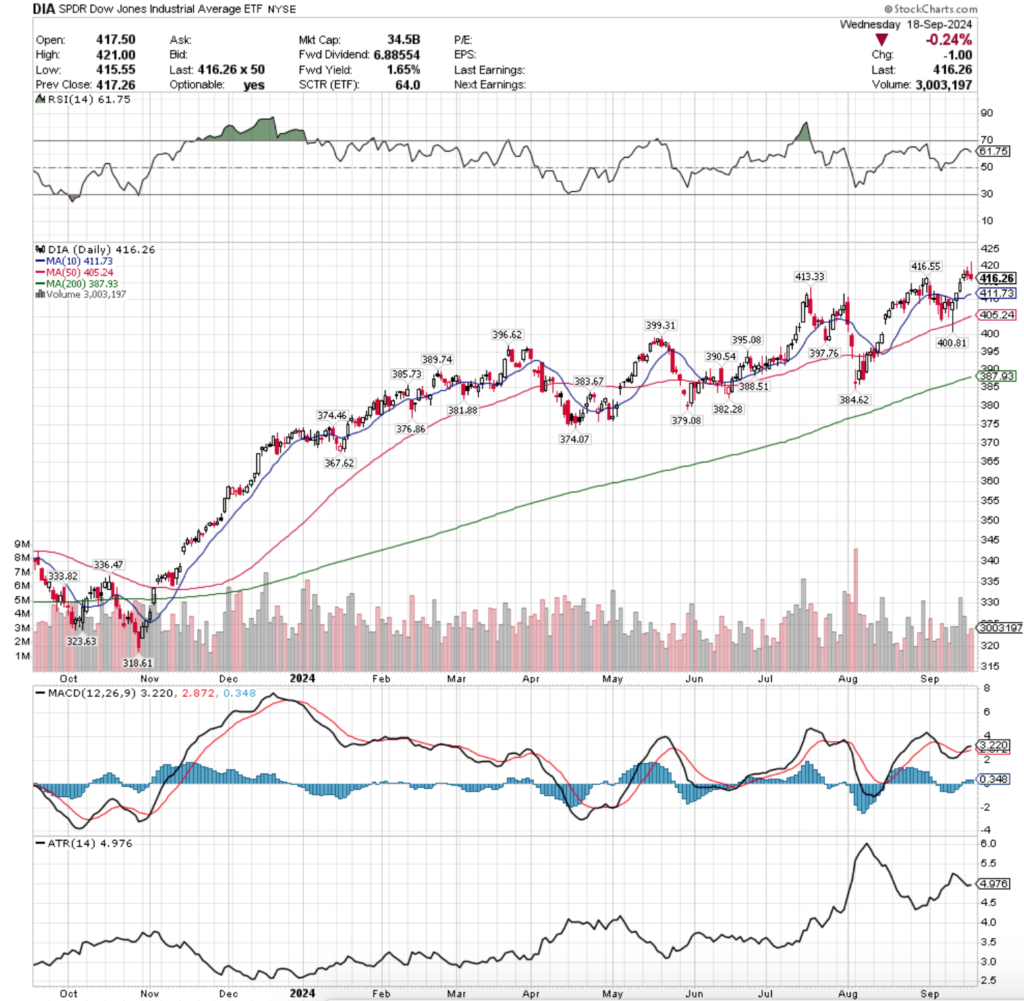
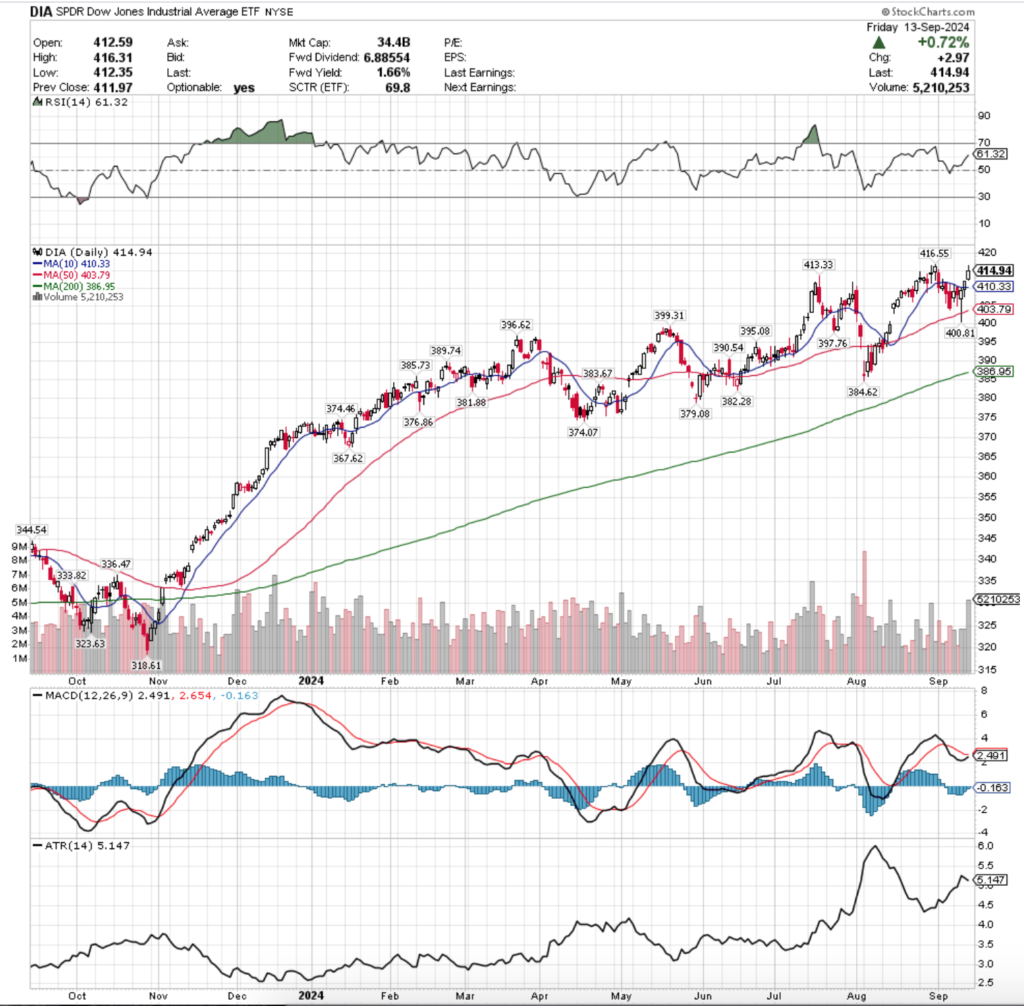
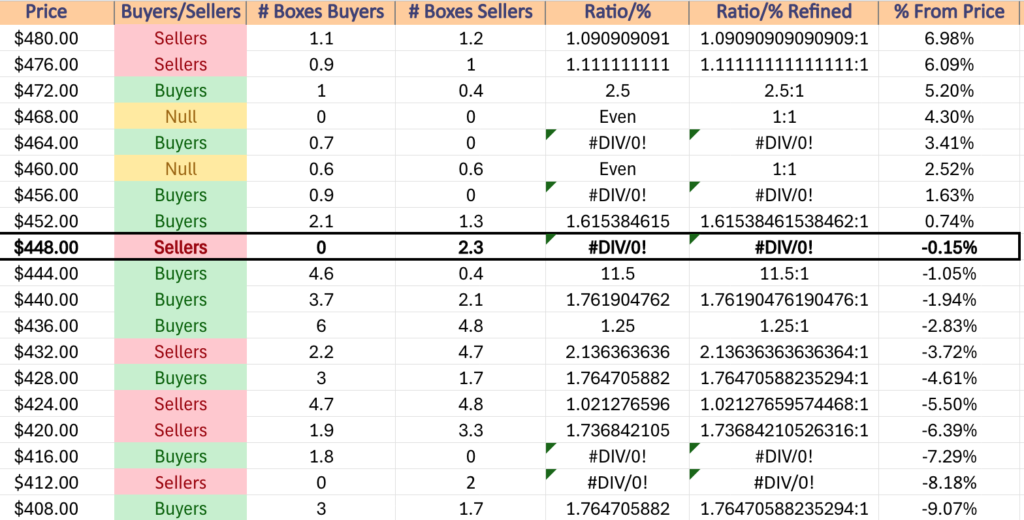
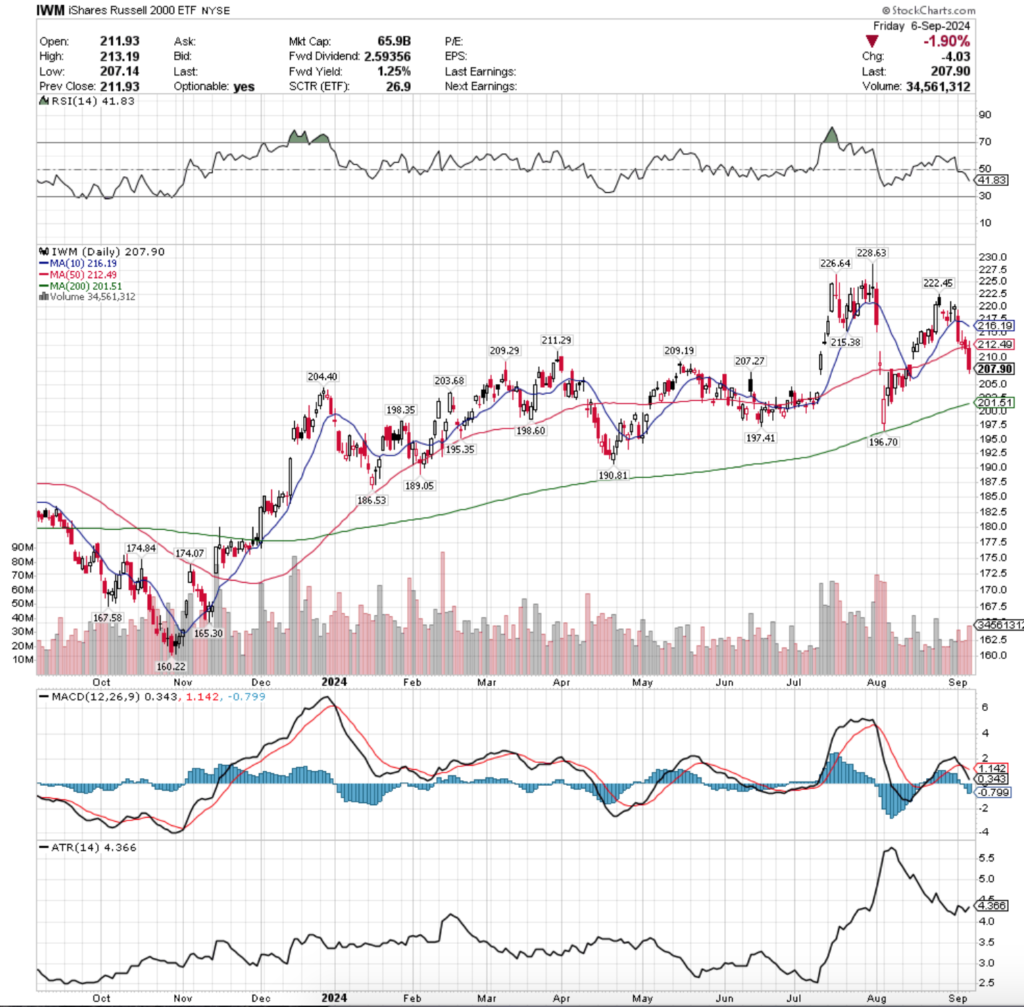
Price Level:Volume Sentiment Analysis For DIA, The SPDR Dow Jones Industrial Average ETF
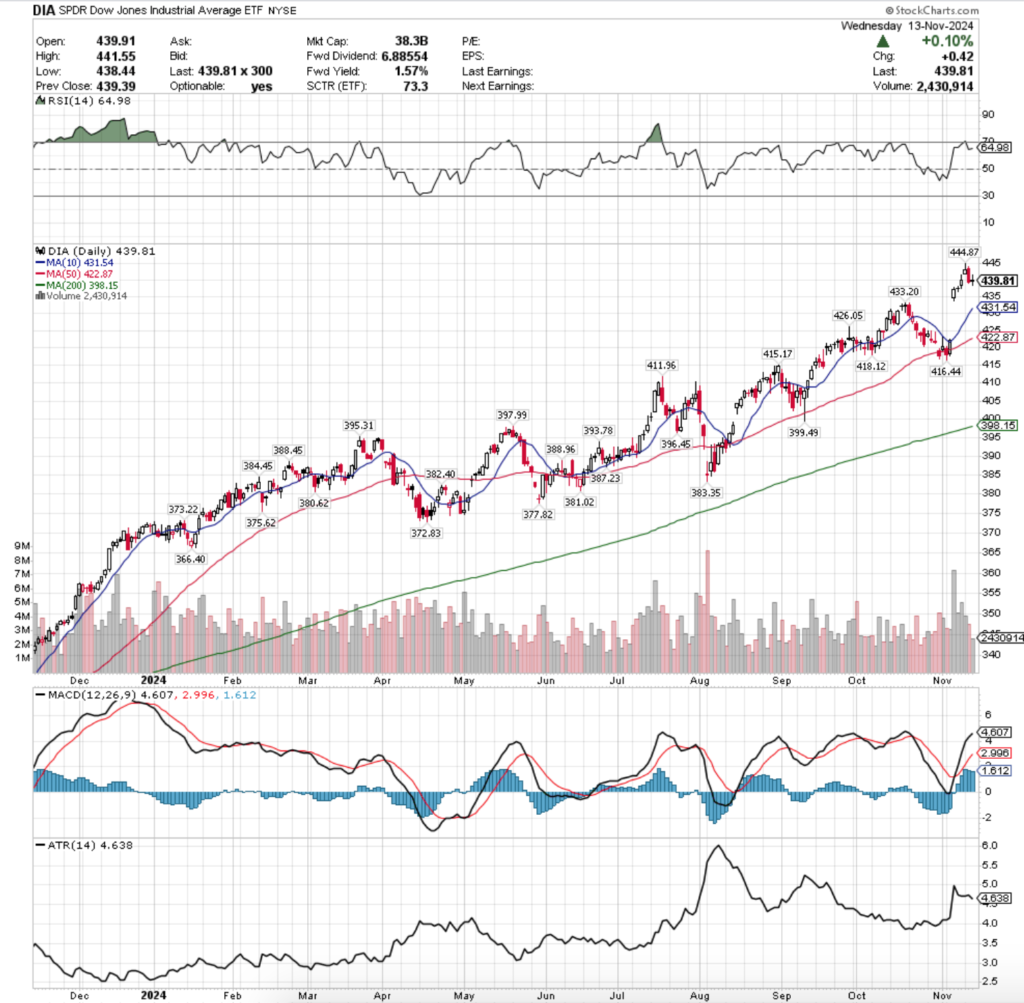
For much of the past year DIA, the SPDR Dow Jones Industrial Average ETF has traded in a more similar, oscillating with steady growth upwards manner than IWM, vs. the more rapid ascents of SPY & QQQ.
While they do not share as many local support levels as IWM, the resiliency of the blue chip DIA index shows that there are plenty of places for it to find footing in the face of a decline.
Investors have continued to buy into the blue chip names forcing DIA higher, which will be interesting to see the reactions to in the event of some type of sell-off in the near-future.
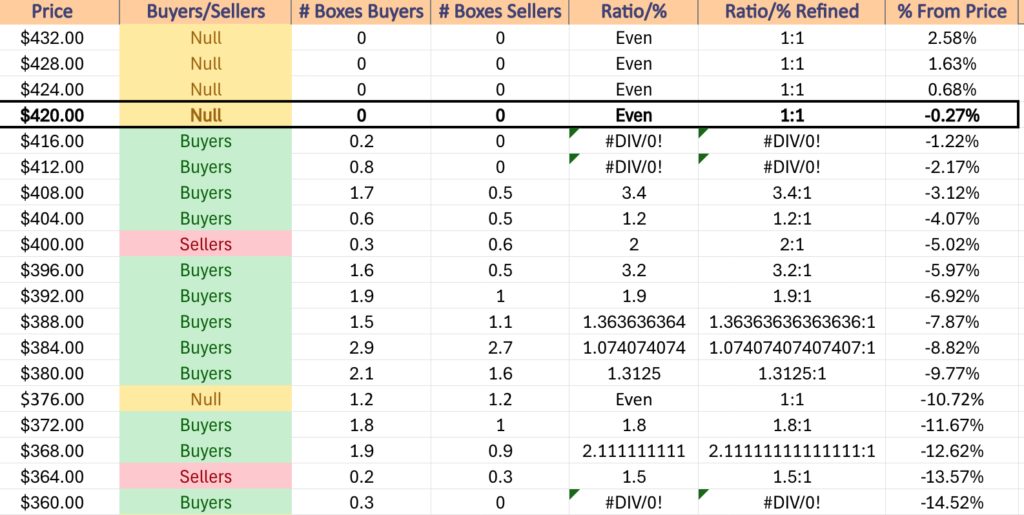
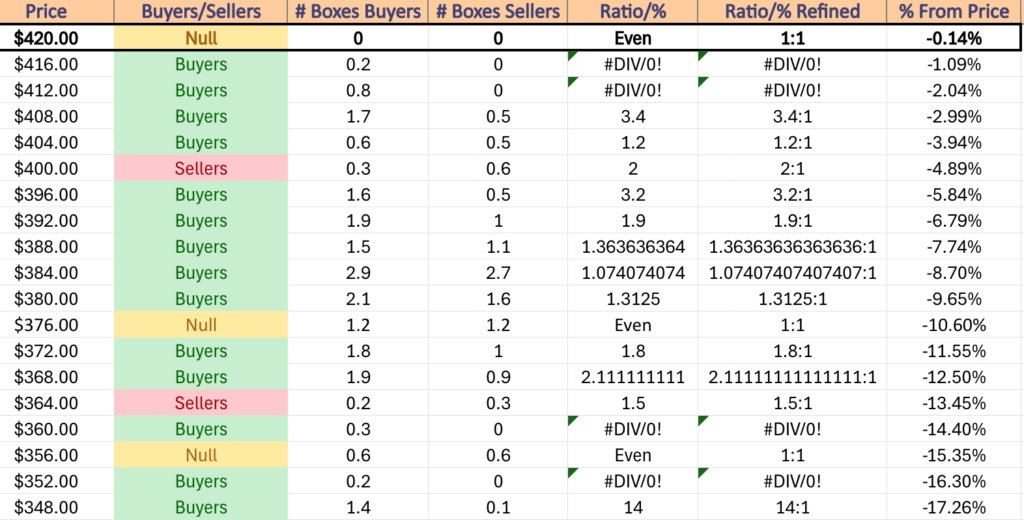
For now though, it is important to understand where the Buyers have met the Sellers over the past few years & in what capacity in order to formulate how strong support levels may be in the event of declines.
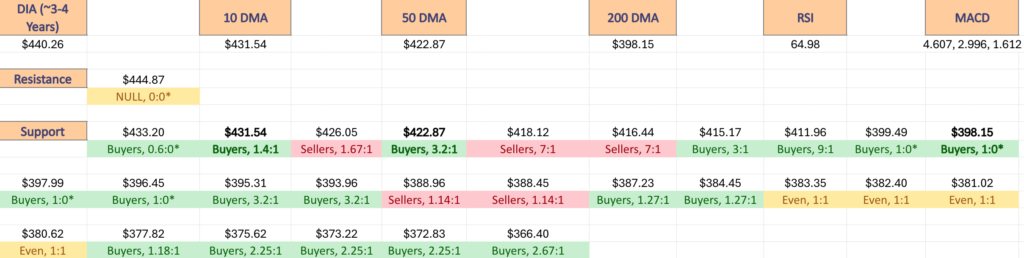
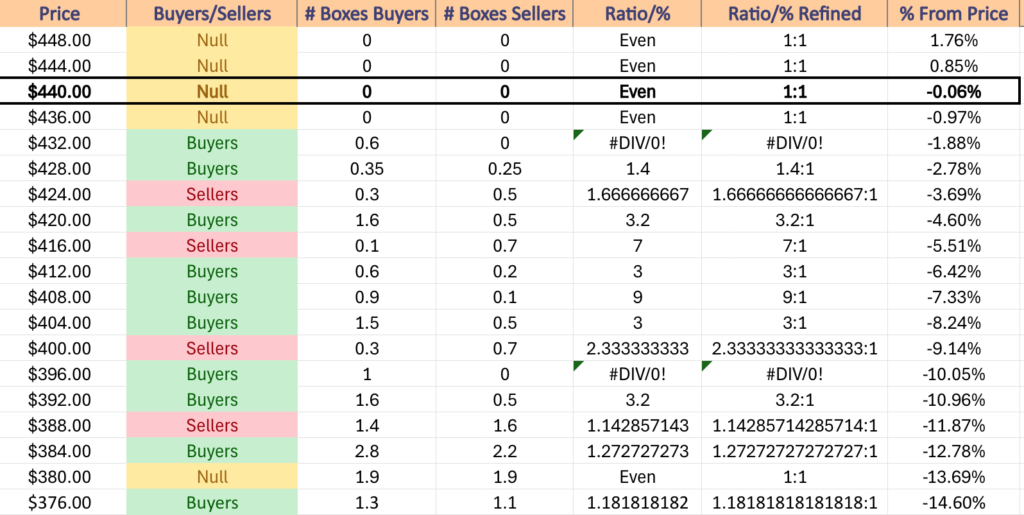
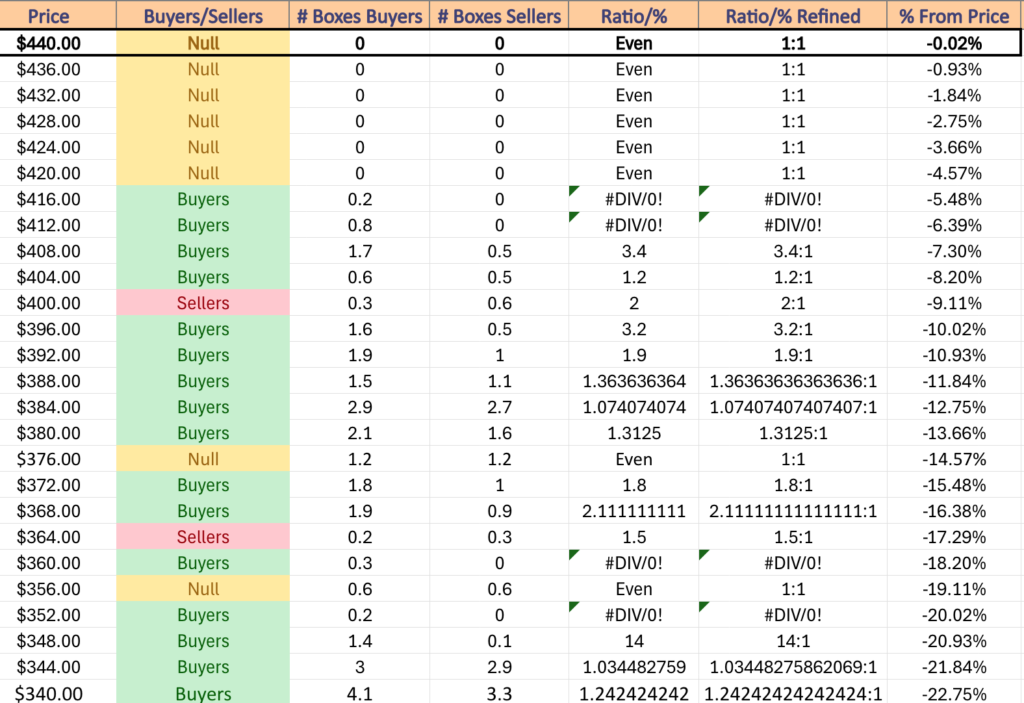
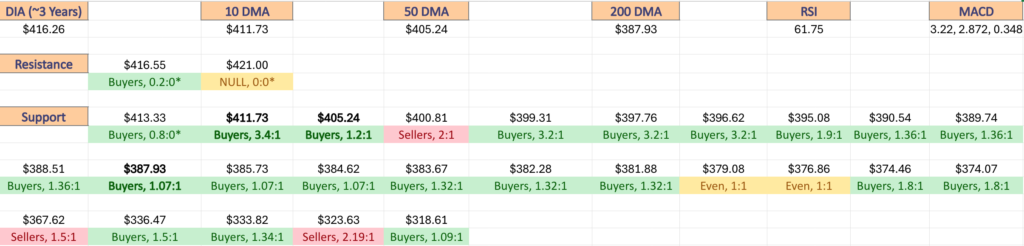
$448 – NULL – 0:0*, +1.76% From Current Price Level
$444 – NULL – 0:0*, +0.85% From Current Price Level – All-Time High*
$440 – NULL – 0:0*, +0.85% From Current Price Level – Current Price Level*
$436 – NUL – 0:0*, -0.06% From Current Price Level
$432 – Buyers – 0.6:0*, -0.97% From Current Price Level
$428 – Buyers – 1.4:1, -1.88% From Current Price Level – 10 Day Moving Average*
$424 – Sellers – 1.67:1, -2.78% From Current Price Level
$420 – Buyers – 3.2:1, -3.69% From Current Price Level – 50 Day Moving Average*
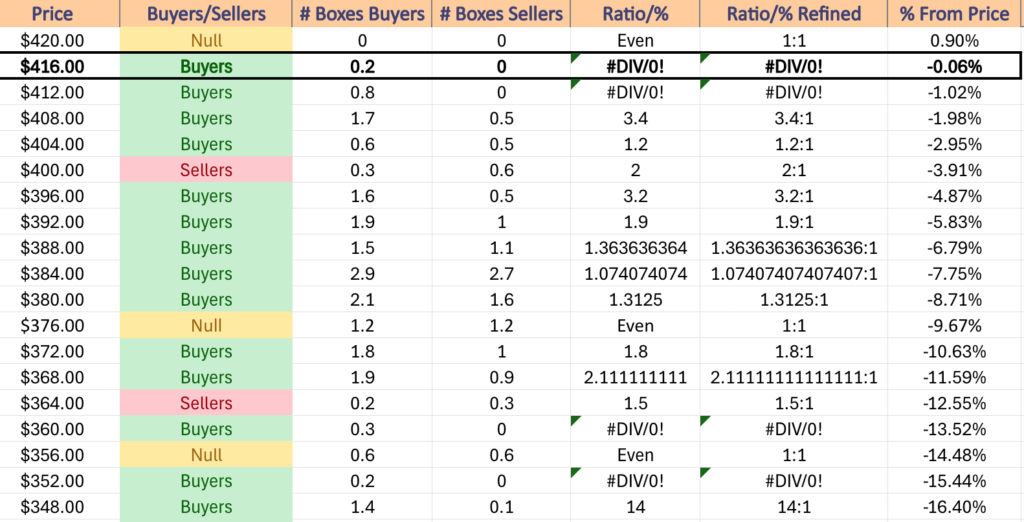
$416 – Sellers – 7:1, -4.6% From Current Price Level
$412 – Buyers – 3:1, -5.51% From Current Price Level
$408 – Buyers – 9:1, -6.42% From Current Price Level
$404 – Buyers – 3:1, -7.33% From Current Price Level
$400 – Sellers – 2.33:1, -9.14% From Current Price Level
$396 – Buyers – 1:0*, -10.05% From Current Price Level – 200 Day Moving Average*
$392 – Buyers – 3.2:1, -10.96% From Current Price Level
$388 – Sellers – 1.14:1, -11.87% From Current Price Level
$384 – Buyers – 1.27:1, -12.78% From Current Price Level
$380 – Even – 1:1, -13.69% From Current Price Level
$376 – Buyers – 1.18:1, -14.6% From Current Price Level
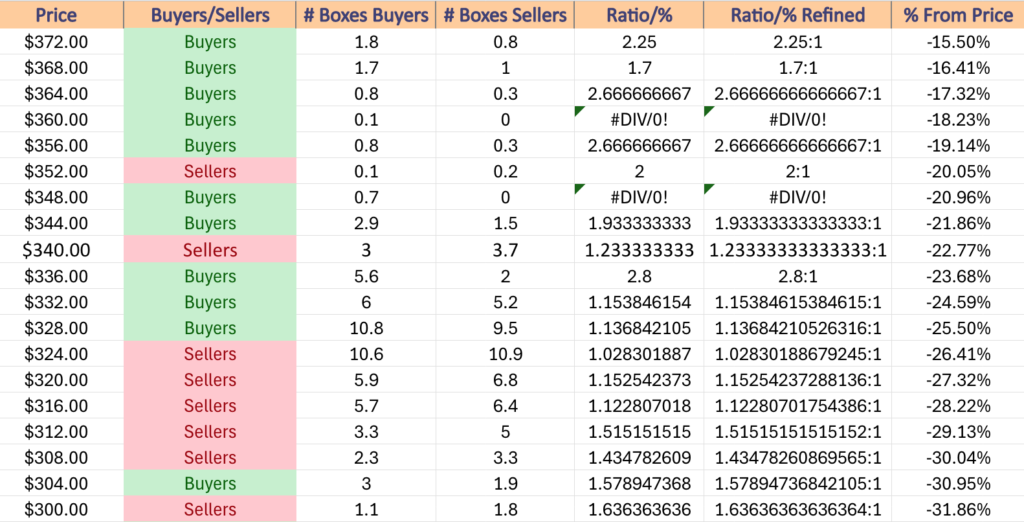
$372 – Buyers – 2.25:1, -15.5% From Current Price Level
$368 – Buyers – 1.7:1, -16.41% From Current Price Level
$364 – Buyers – 2.67:1, -17.32% From Current Price Level
$360 – Buyers – 0.1:0*, -18.23% From Current Price Level
$356 – Buyers – 2.67:1, -19.14% From Current Price Level
$352 – Sellers – 2:1, -20.05% From Current Price Level
$348 – Buyers – 0.7:0*, -20.96% From Current Price Level
$344 – Buyers – 1.93:1, -21.86% From Current Price Level
$340 – Sellers – 1.23:1, -22.77% From Current Price Level
$336 – Buyers – 2.8:1, -23.68% From Current Price Level
$332 – Buyers – 1.15:1, -24.59% From Current Price Level
$328 – Buyers – 1.14:1, -25.5% From Current Price Level
$324 – Sellers – 1.03:1, -26.41% From Current Price Level
$320 – Sellers – 1.15:1, -27.32% From Current Price Level
$316 – Sellers – 1.12:1, -28.22% From Current Price Level
$312 – Sellers – 1.52:1, -29.13% From Current Price Level
$308 – Sellers – 1.44:1, -30.04% From Current Price Level
$304 – Buyers – 1.58:1, -30.95% From Current Price Level
$300 – Sellers – 1.64:1, -31.86% From Current Price Level
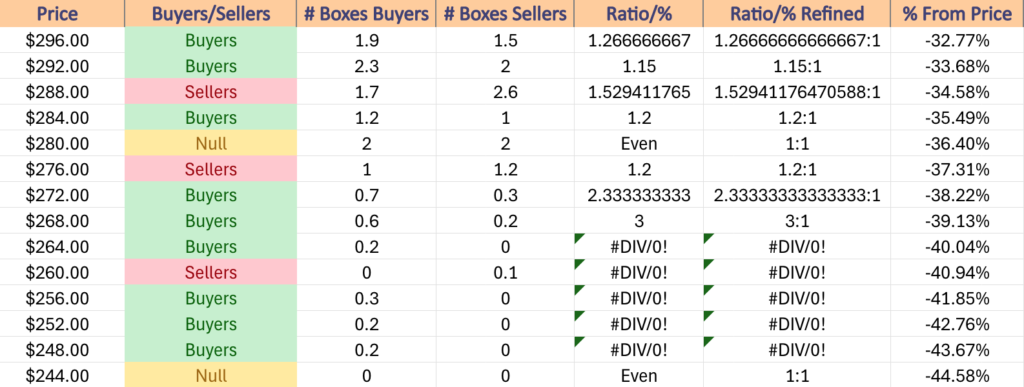
$296 – Buyers – 1.27:1, -32.77% From Current Price Level
$292 – Buyers – 1.15:1, -33.68% From Current Price Level
$288 – Sellers – 1.53:1, -34.58% From Current Price Level
$284 – Buyers – 1.2:1, -35.49% From Current Price Level
$280 – Even – 1:1, -36.4% From Current Price Level
$276 – Sellers – 1.2:1, -37.31% From Current Price Level
$272 – Buyers – 2.33:1, -38.22% From Current Price Level
$268 – Buyers – 3:1, -39.13% From Current Price Level
$264 – Buyers – 0.2:0*, -40.04% From Current Price Level
$260 – Sellers – 0.1:0*, -40.94% From Current Price Level
$256 – Buyers – 0.3:0*, -41.85% From Current Price Level
$252 – Buyers – 0.2:0*, -42.76% From Current Price Level
$248 – Buyers – 0.2:0*, -43.67% From Current Price Level
$244 – NULL – 0:0*, -44.58% From Current Price Level
*** I DO NOT OWN SHARES OR OPTIONS CONTRACT POSITIONS IN SPY, QQQ, IWM OR DIA AT THE TIME OF PUBLISHING THIS ARTICLE ***