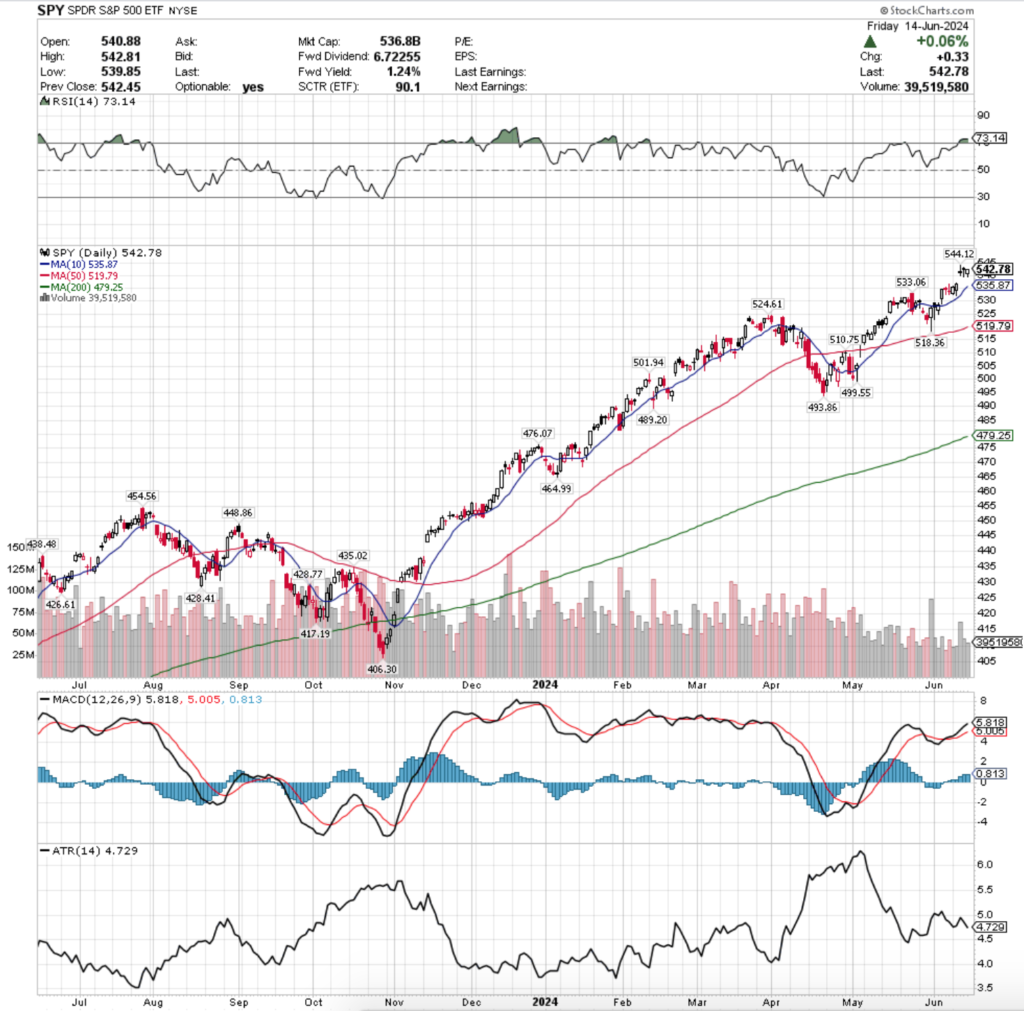
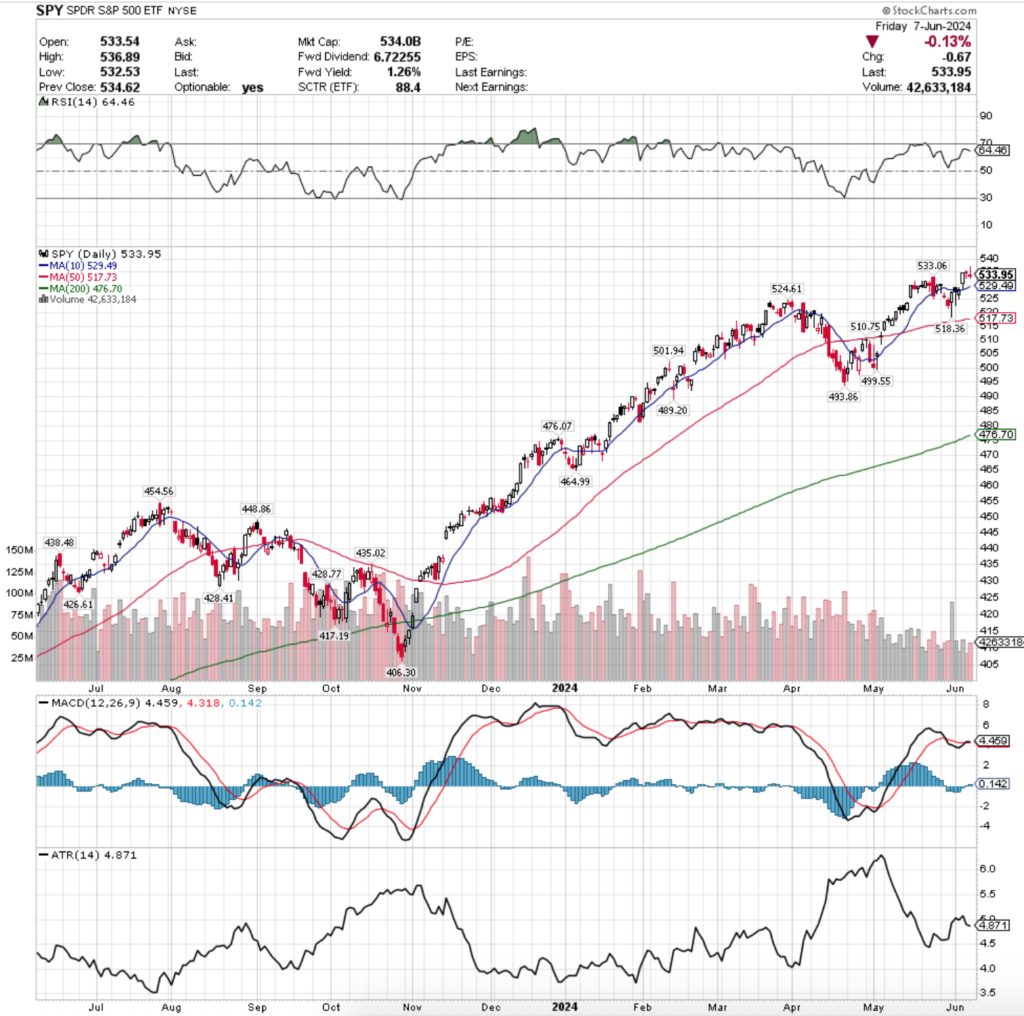
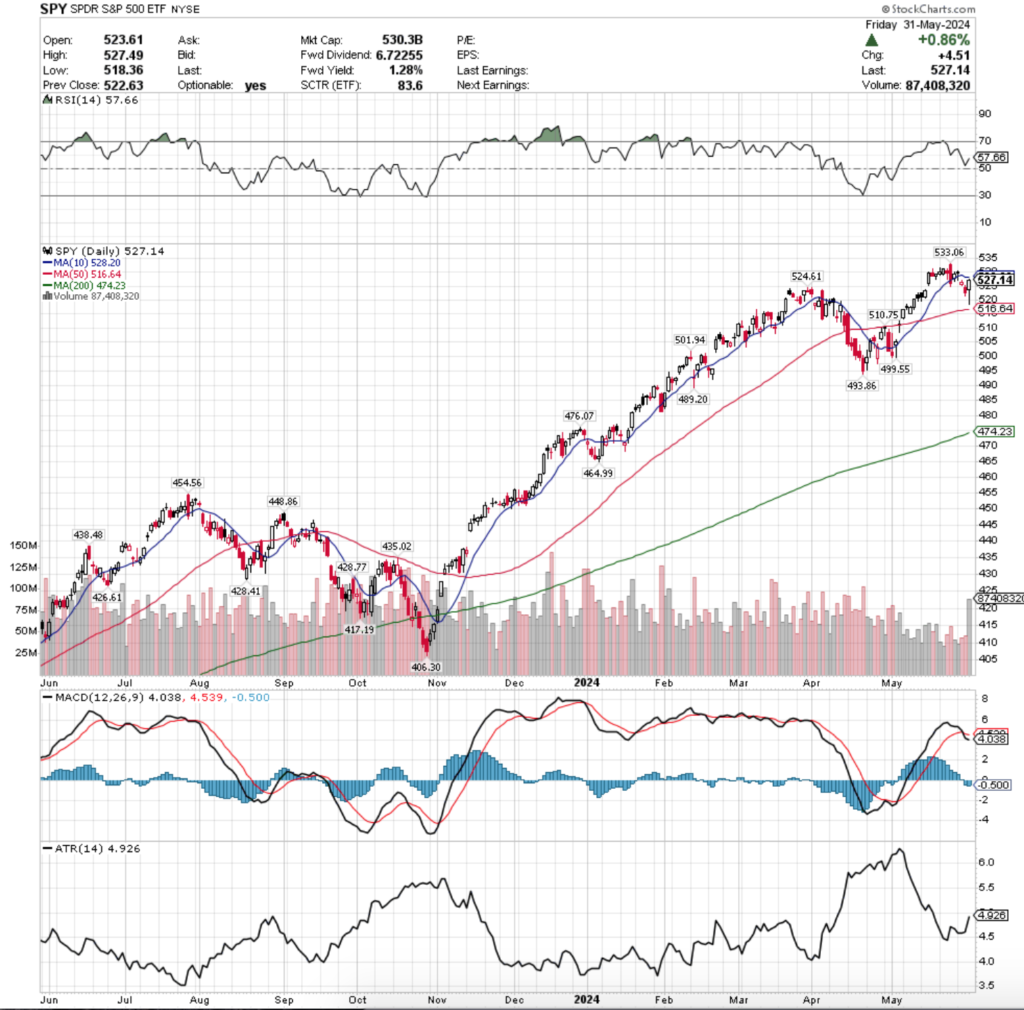
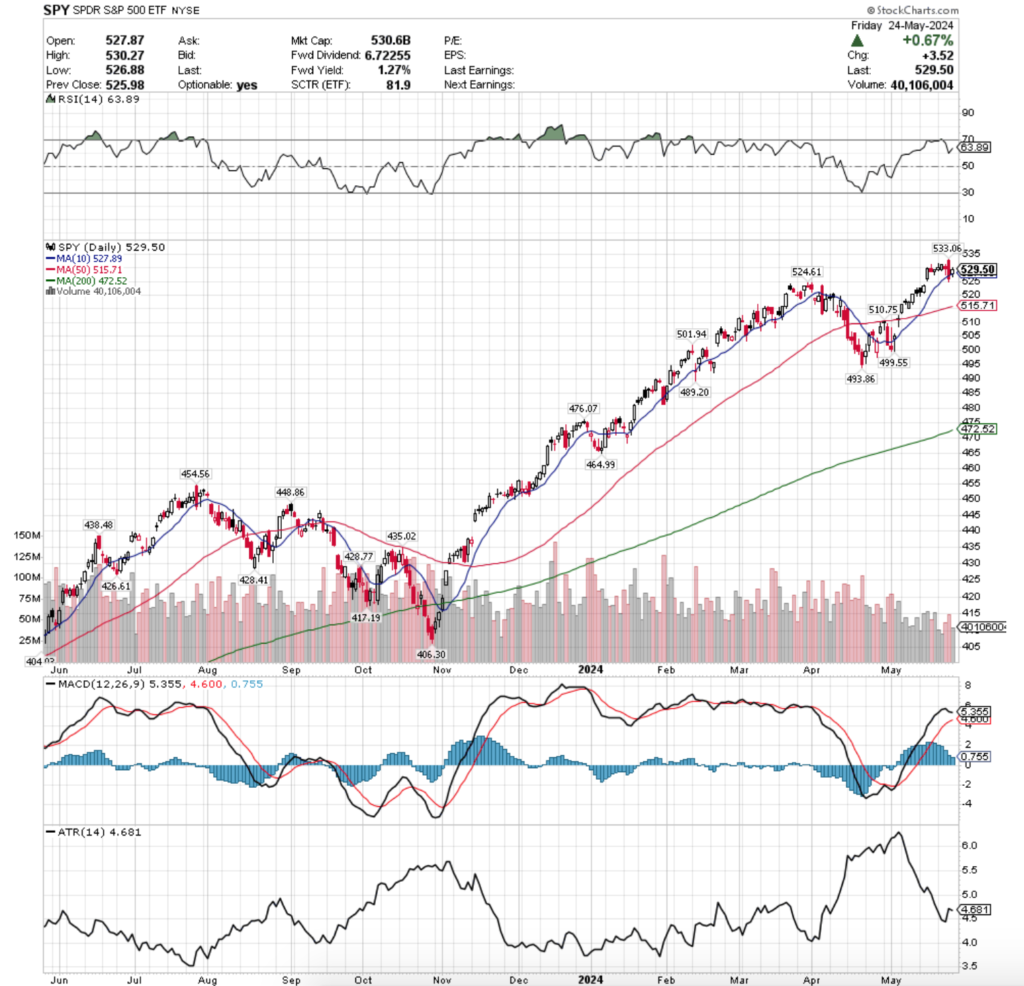
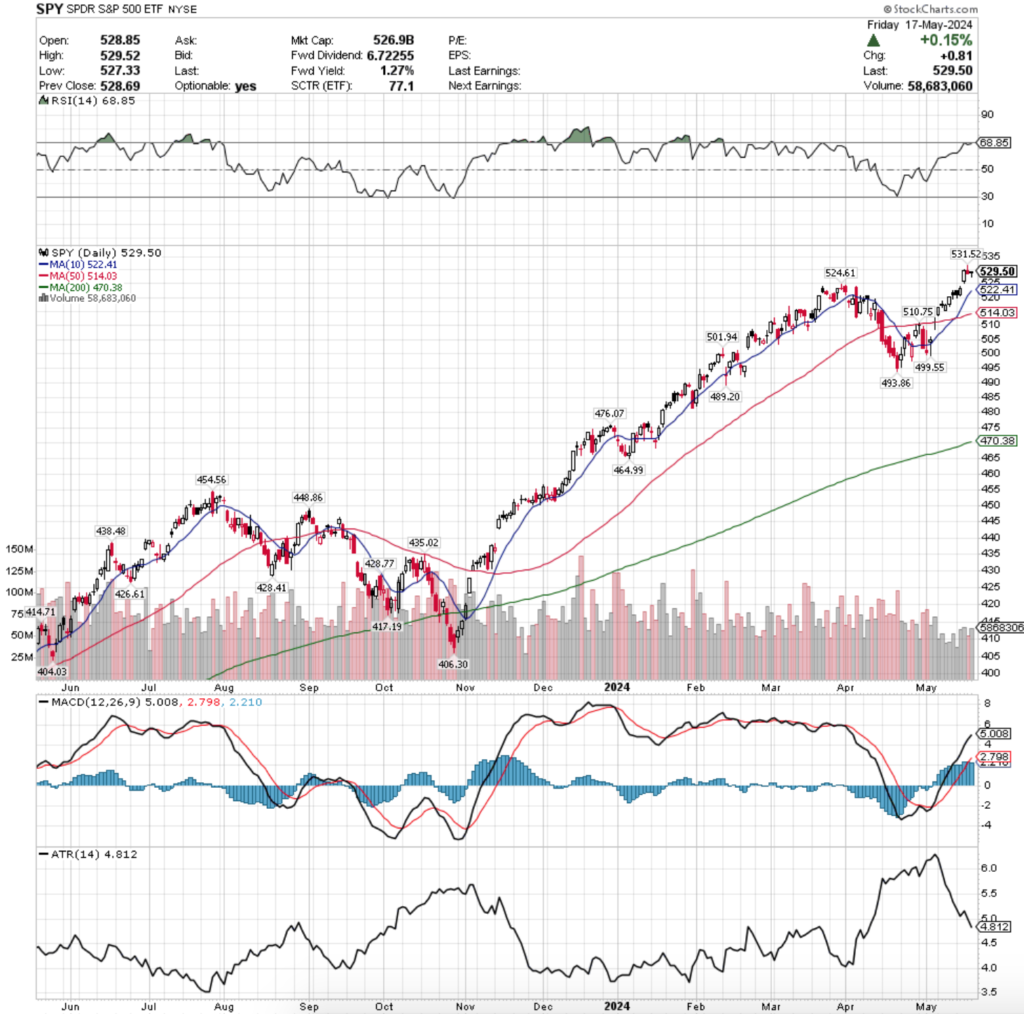
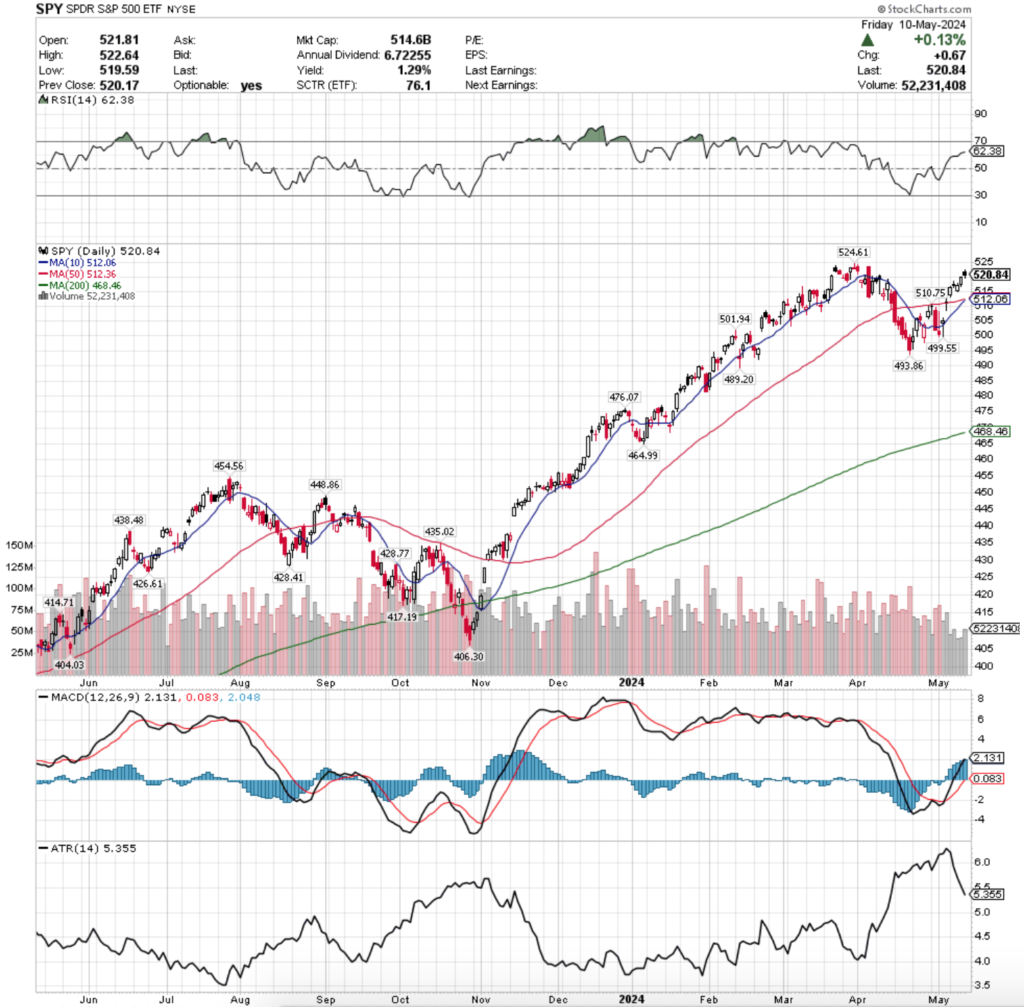
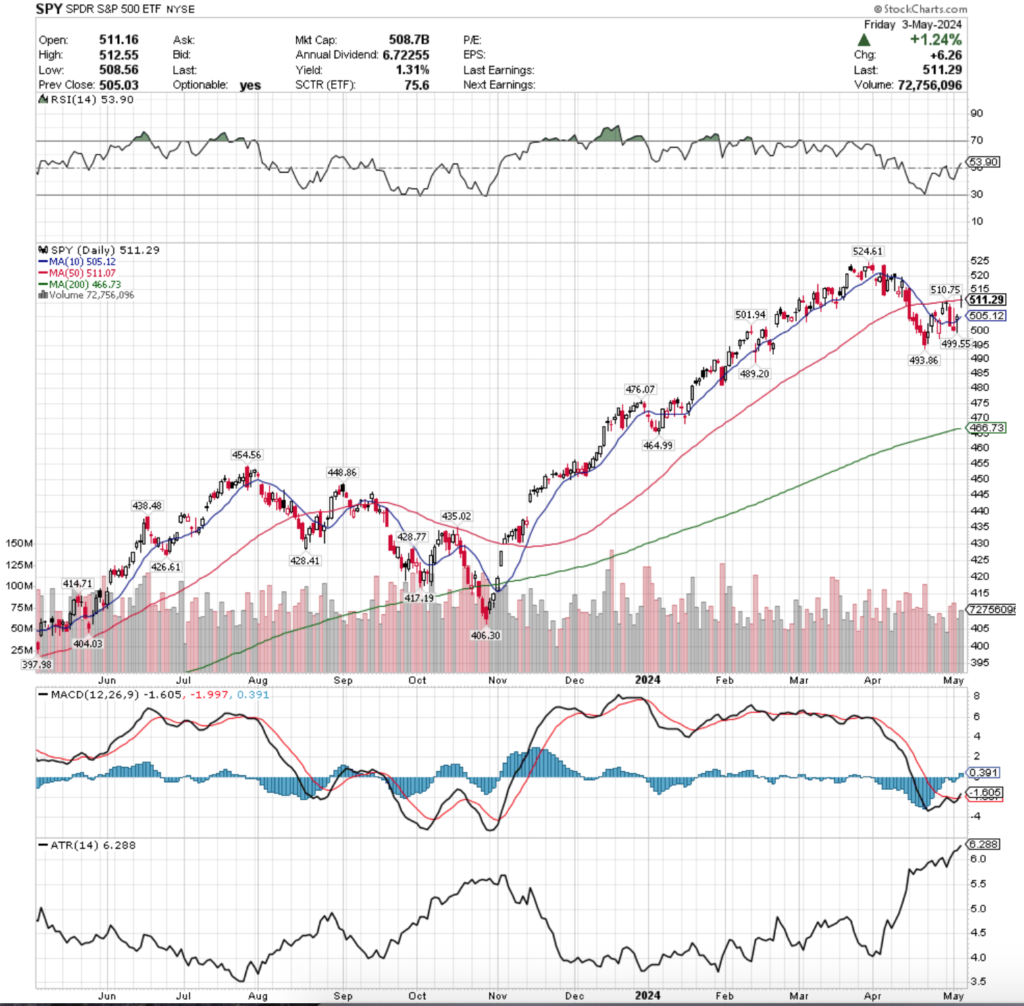
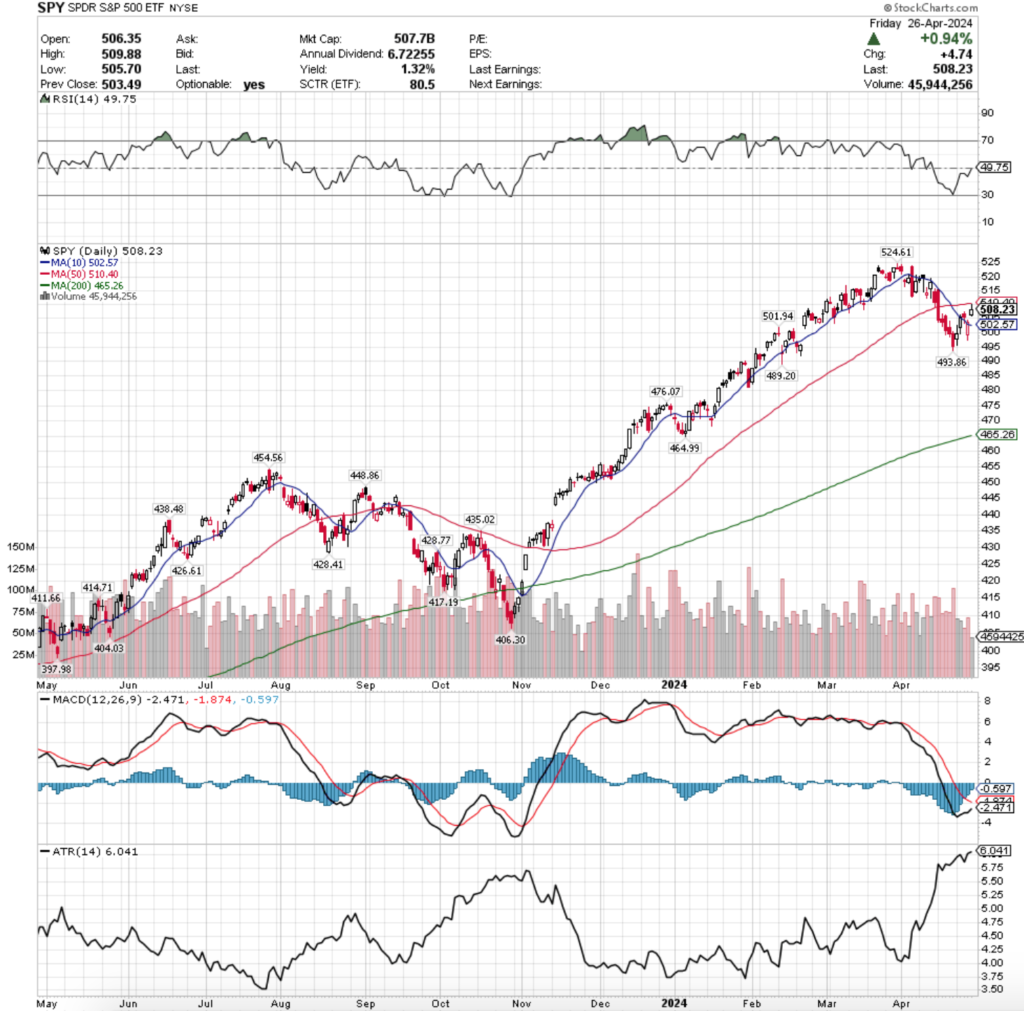
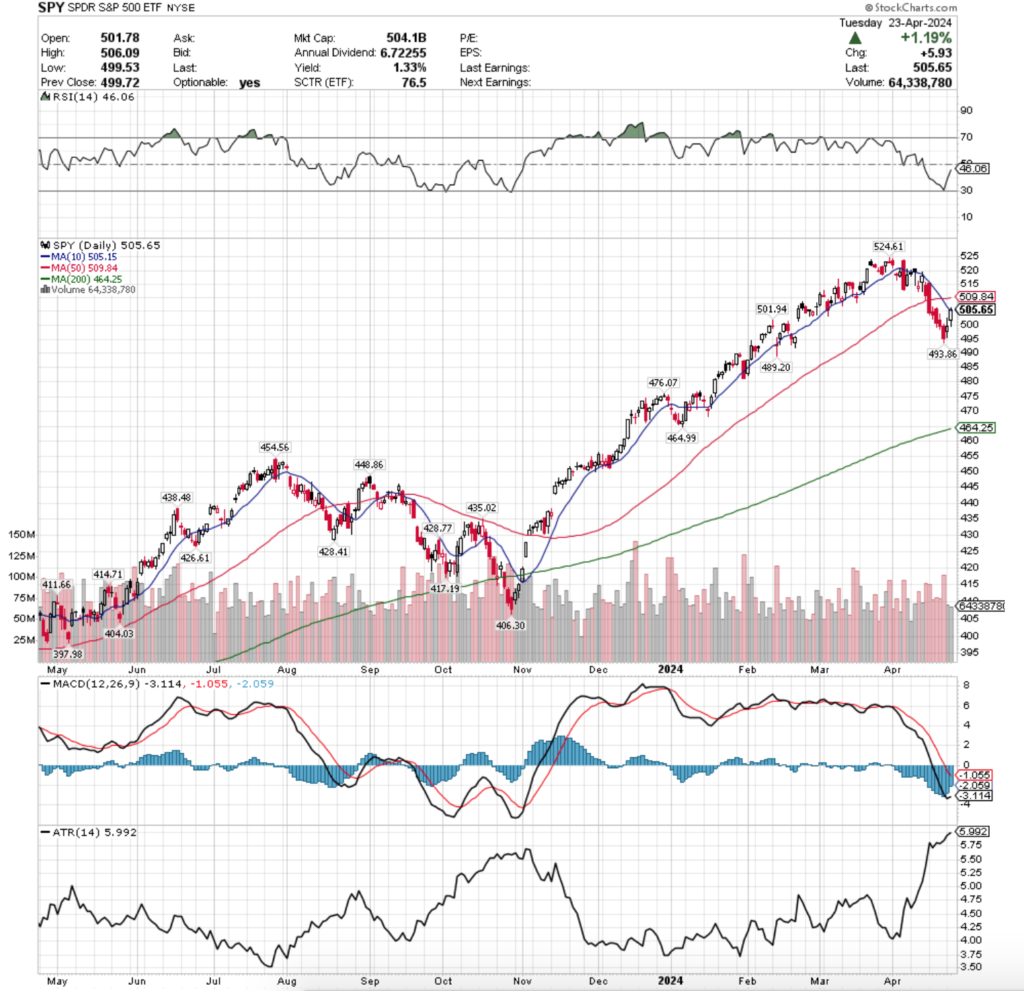
SPY, the SPDR S&P 500 ETF added +0.64% last week, while the VIX closed at 13.2, implying a one day move of +/-0.83% & a one month move of +/-3.82%.
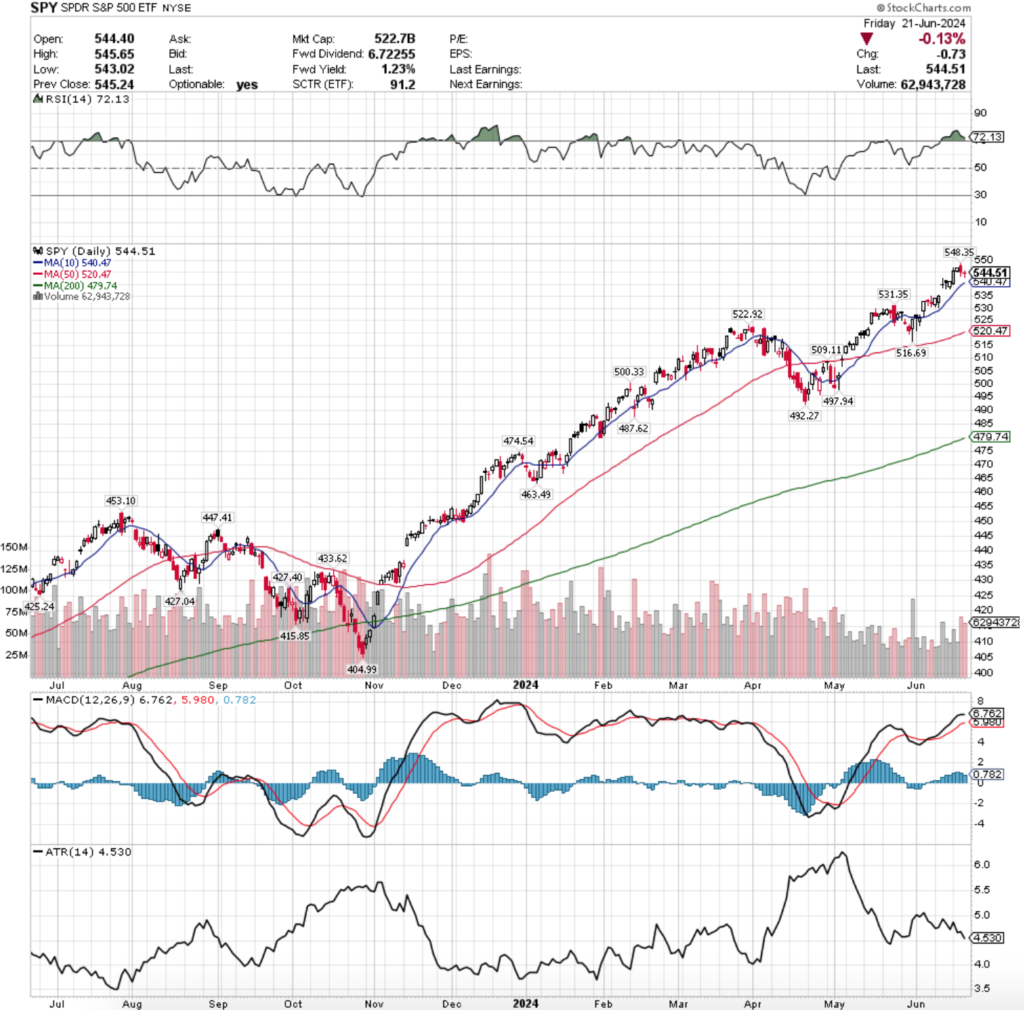
Their RSI is still in overbought territory at 72.13 while trending back towards neutral, while their MACD is still bullish, but looking like it will roll over & bearishly cross the signal line this week.
Volumes were still muted at -20.55% below average vs. the prior year (57,970,675 vs. 72,969,048), which is low, but still better than previous weeks given that there were only four trading sessions last week.
However, given that this is now the seventh week of abnormally low volumes 13.5% of the weekly volumes for the past year’s calculation are now distorting the calculation lower, which is something to be kept in mind.
Monday the week began on an interesting note, as a wide range candle on mediocre volume advanced SPY higher.
Tuesday also was an advancing session, however it was the weakest volumes of the week & was hardly able to the the high of Monday’s session.
Wednesday the market was closed & when it came back Thursday the lack of enthusiasm continued, with Thursday’s session featuring the highest volume of the week on a decline.
Also important, Thursday’s candle formed a bearish engulfing pattern with Tuesday’s candle, setting the stage for further near-term declines.
Friday confirmed this with another declining session on high volume heading into the weekend.
Friday’s candle resulted in a doji, indicating indecision & that there is a bit of hesitancy on the part of market participants.
Much like last week, this week SPY’s 10 day moving average & MACD will be a key area of focus.
Their MACD is primed for a bearish crossover this week which would result in an uptick in volatility & their Average True Range.
The 10 DMA will be important as it currently sits <1% below the current price of SPY & is inching closer to the price each day, & the next level of support below that is an additional -2% from the current price.
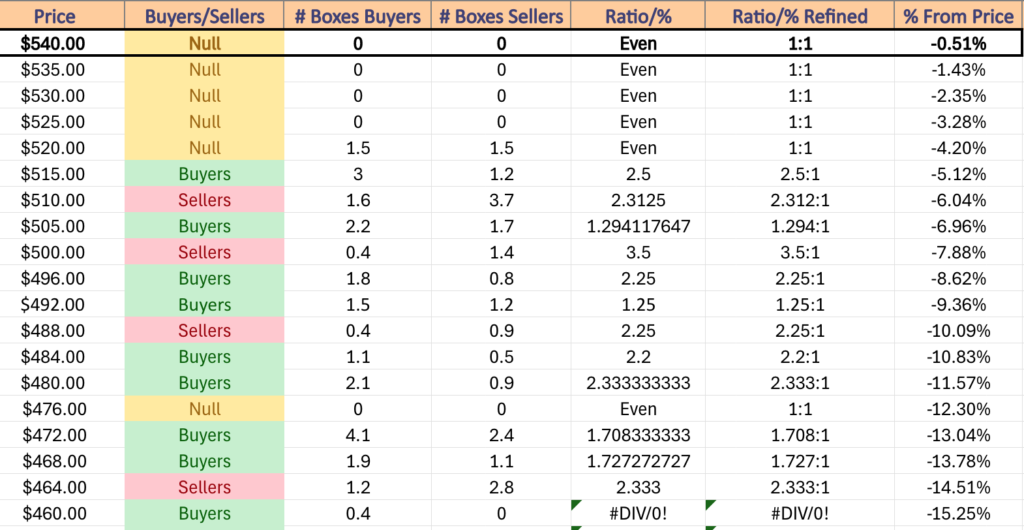
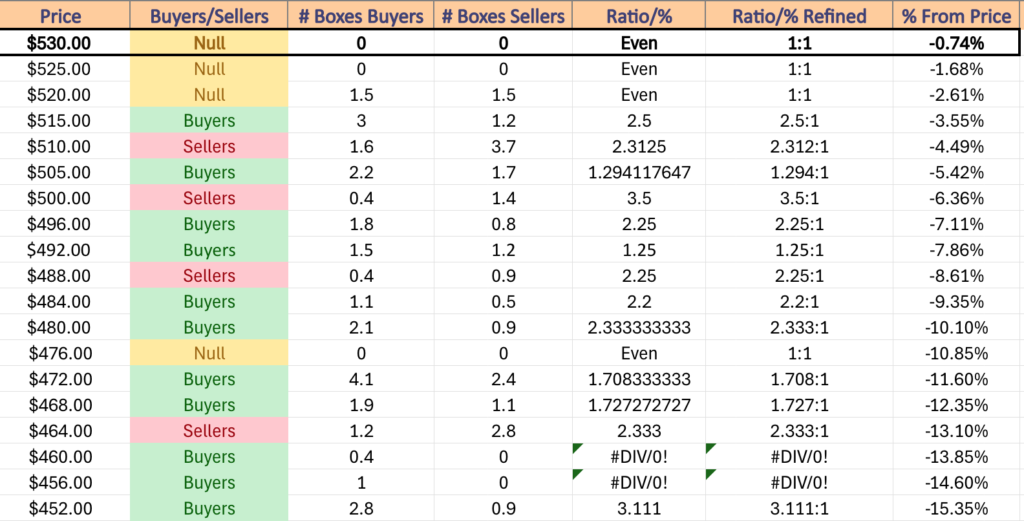
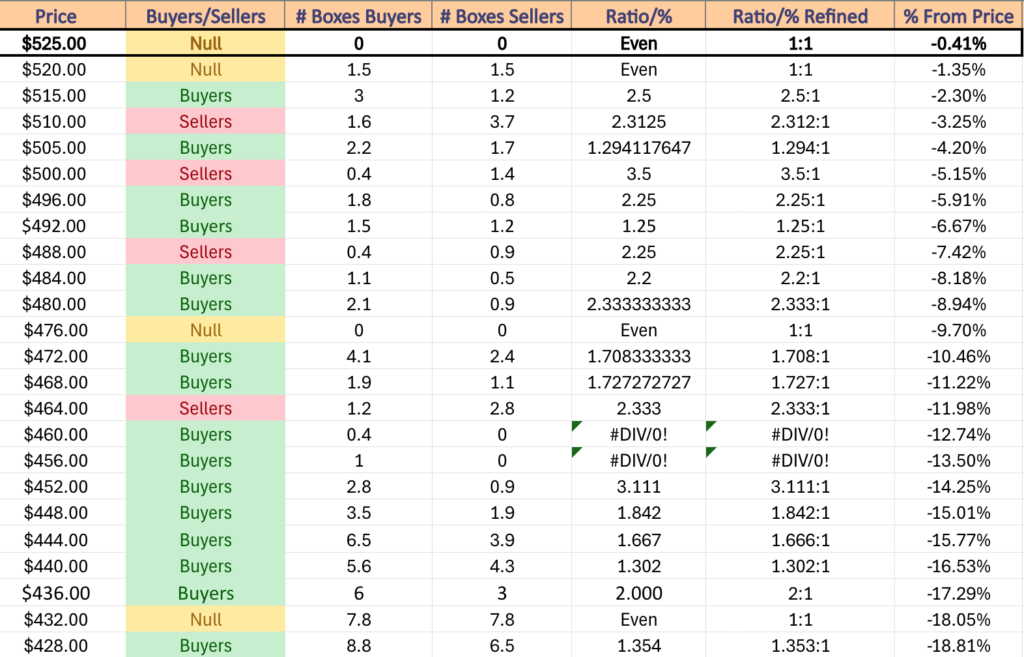
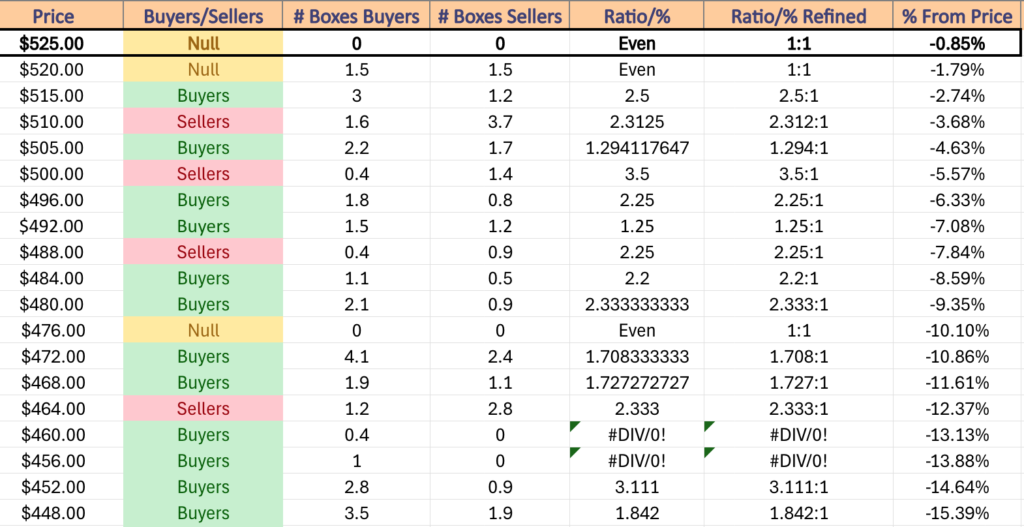
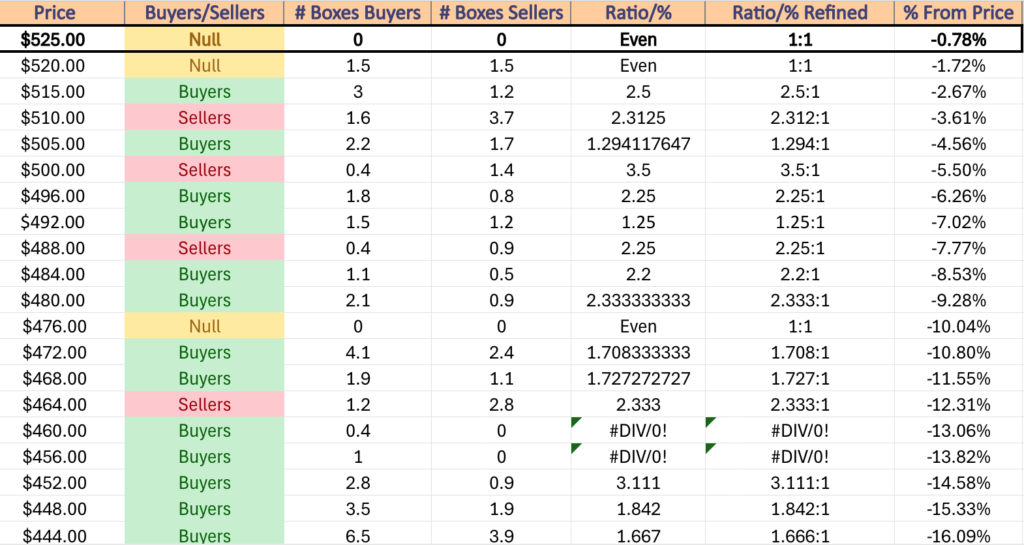
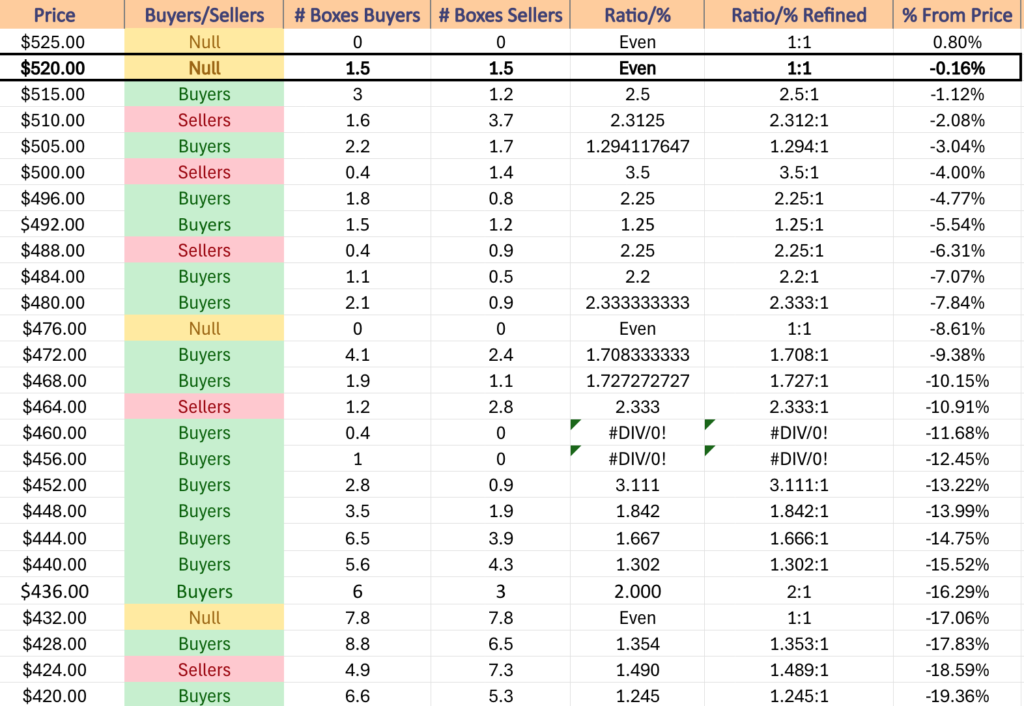
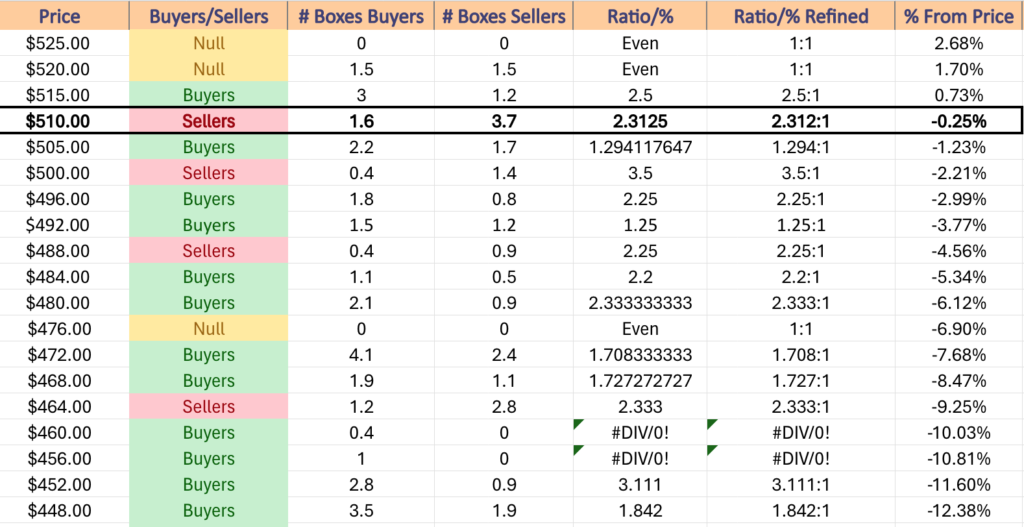
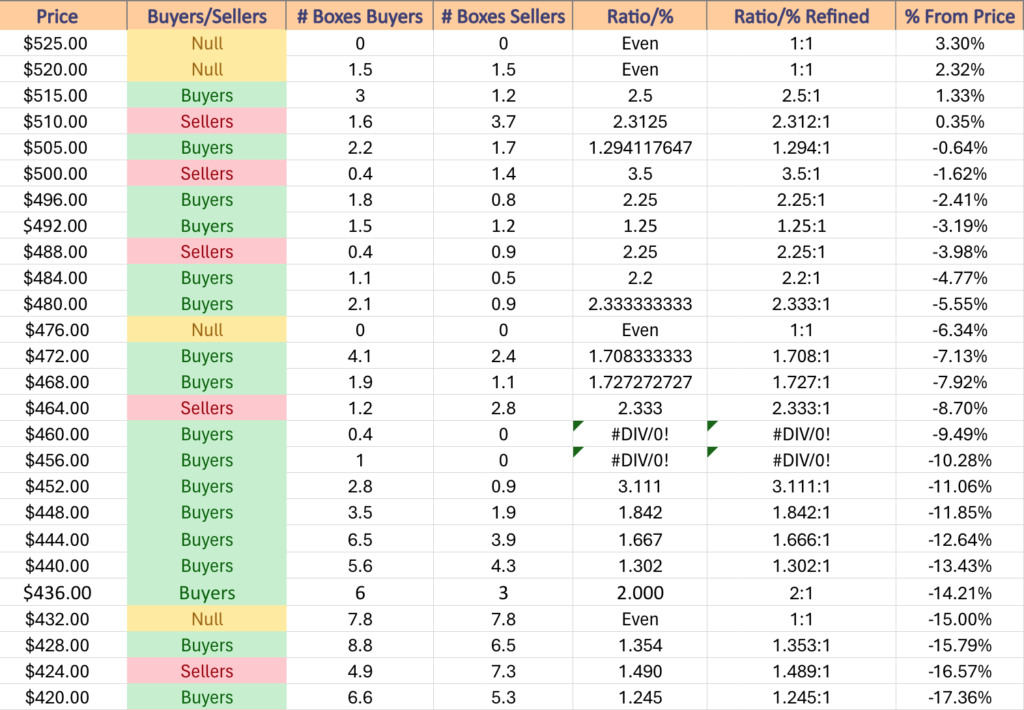
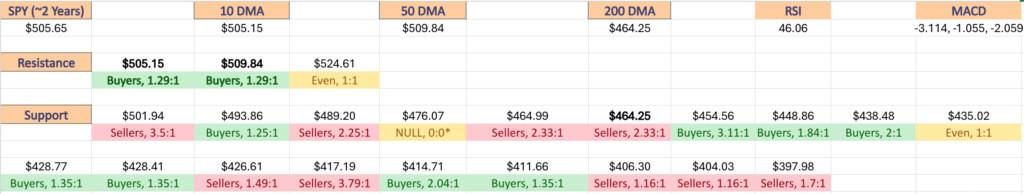
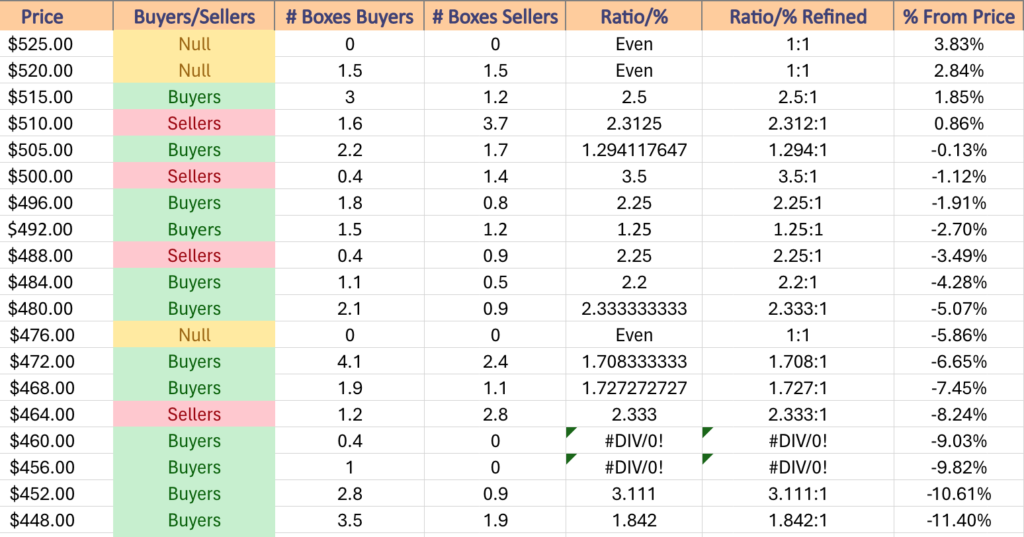
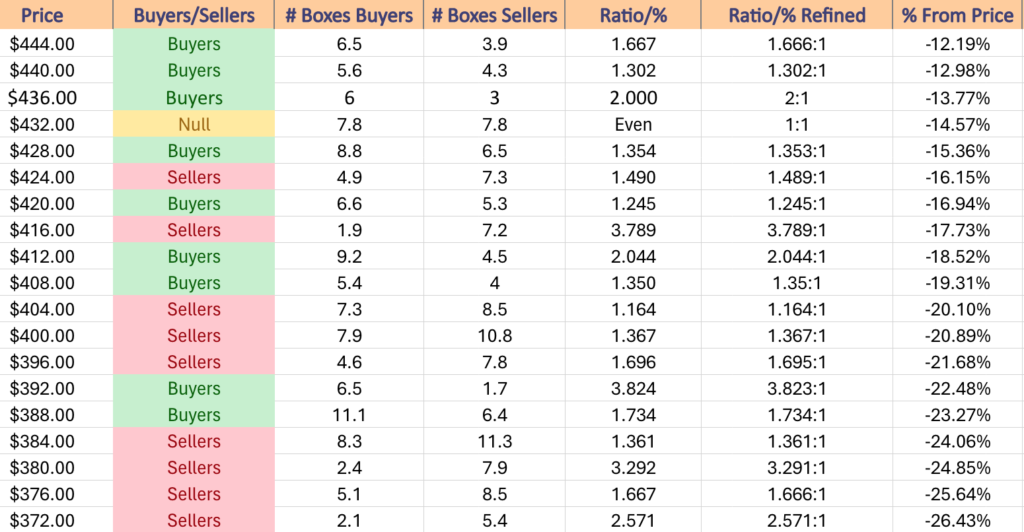
As noted in previous weeks’ notes, there are sparse local support levels for SPY due to the nature of their ascent over the past year & the next level of support beneath that is going to be a -5% decline from the current price.
It is also worth noting that there has been muted volumes around most of these support levels, which as a result is why there is currently still limited data on the strength of each support level’s price level.
Also, keep an eye on whether or not the gap from last week begins to fill, as well as where their RSI is at during any declines in the near-term.
Keeping an eye on where prices are as it begins approaching the neutral level, as well as if it begins to revert back towards overbought conditions will be key in figuring out near-term market direction.
SPY has support at the $540.47 (10 Day Moving Average, Volume Sentiment: NULL, 0:0*), $531.35 (Volume Sentiment: NULL, 0:0*), $522.92 (Volume Sentiment: NULL, 0:0*) & $520.47/share (50 Day Moving Average, Volume Sentiment: NULL, 0:0*) price levels, with resistance at the $548.35/share (All-Time High, Volume Sentiment: NULL, 0:0*) price level.

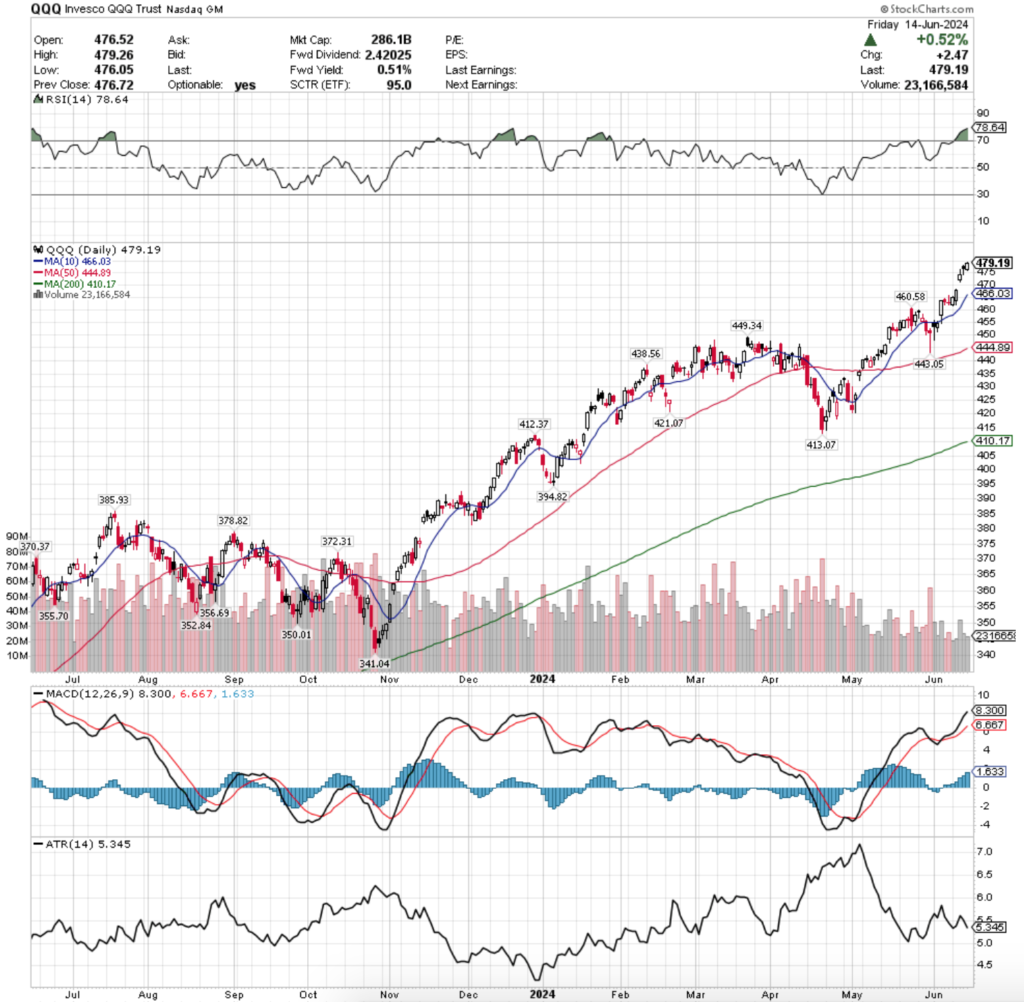
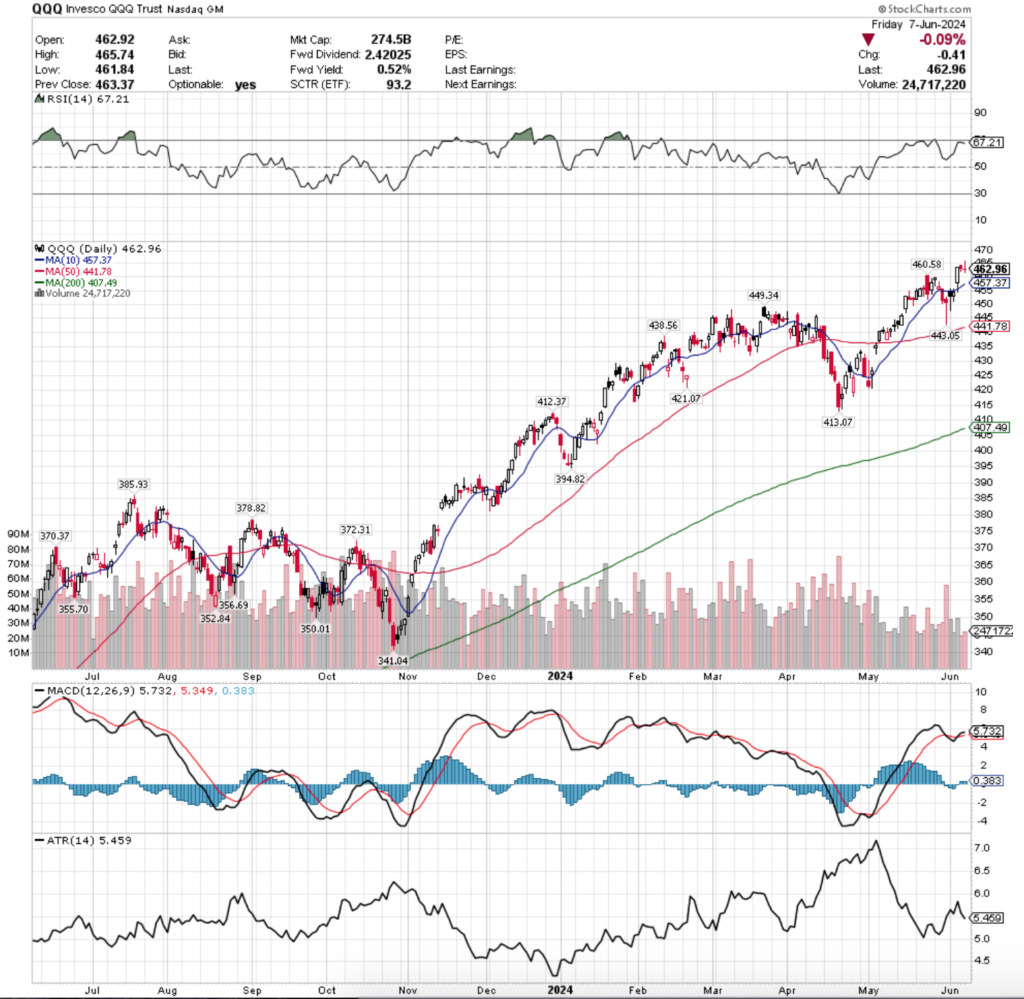
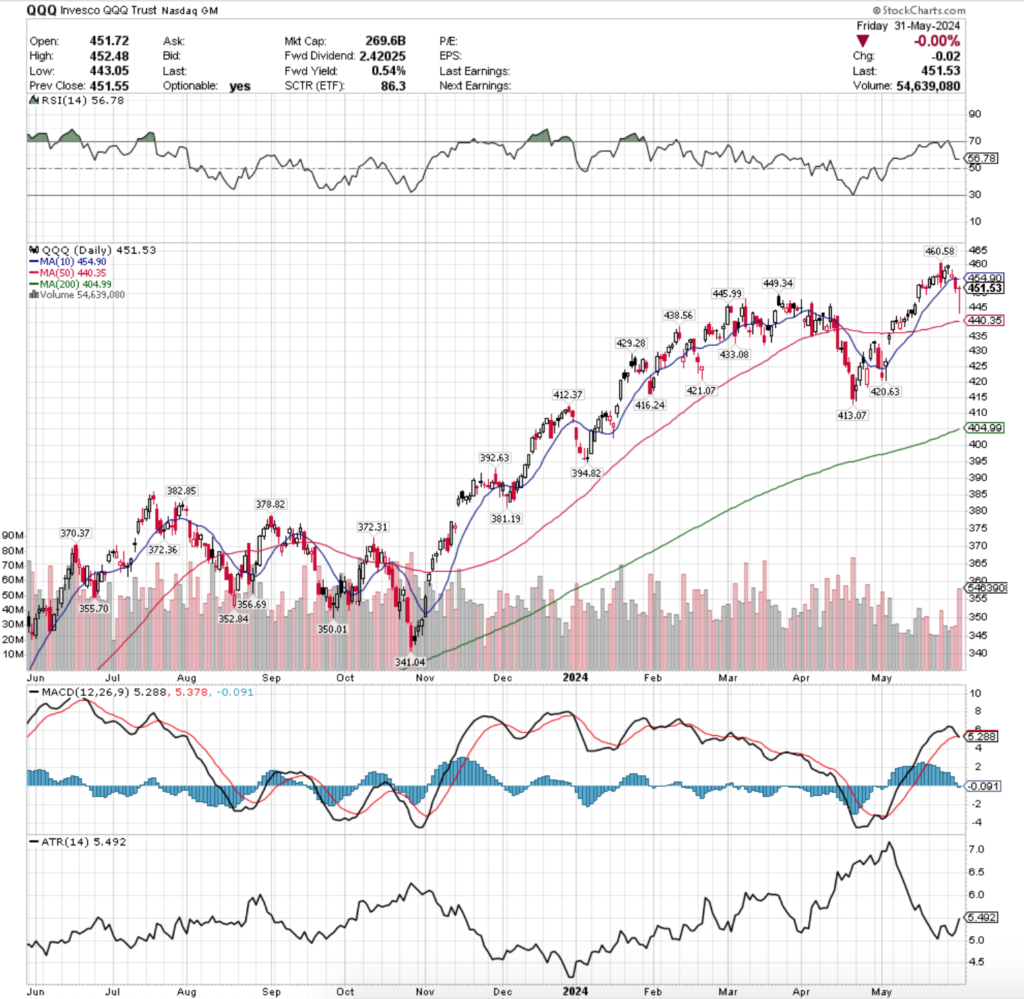
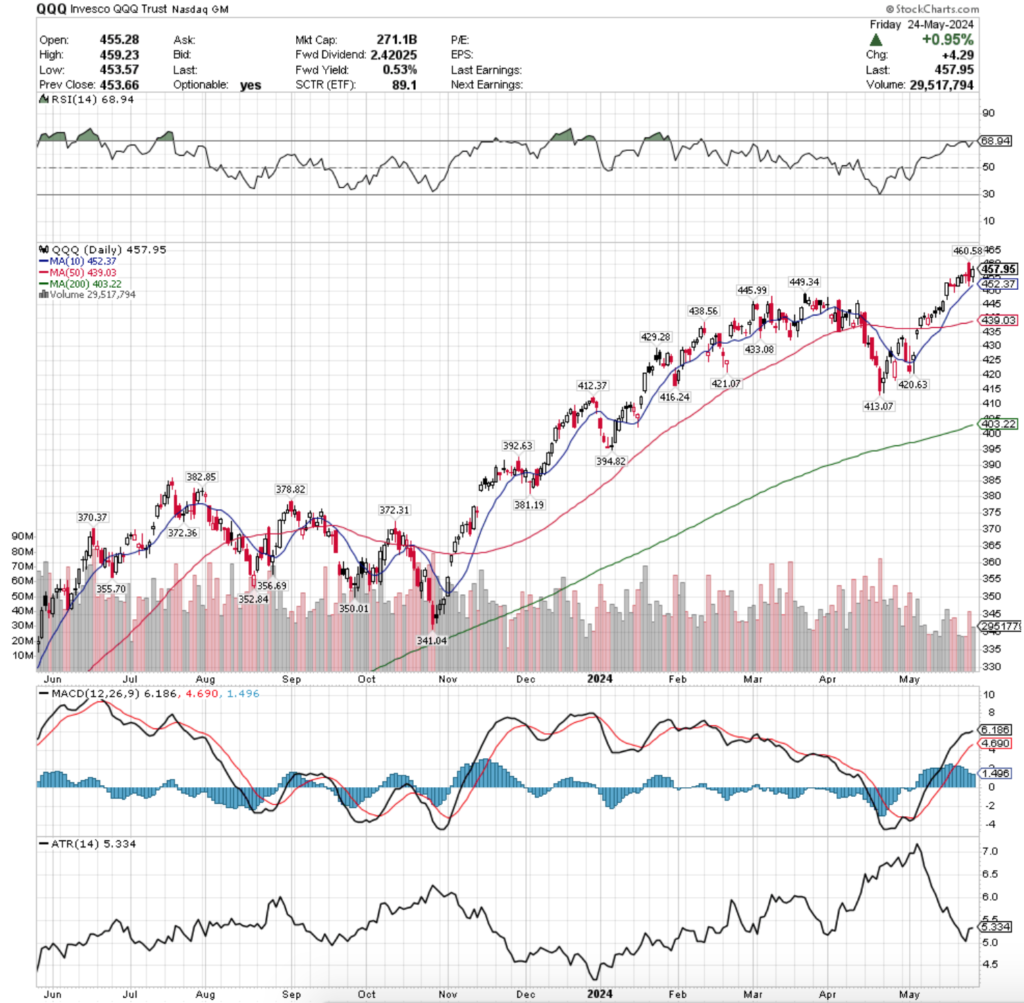
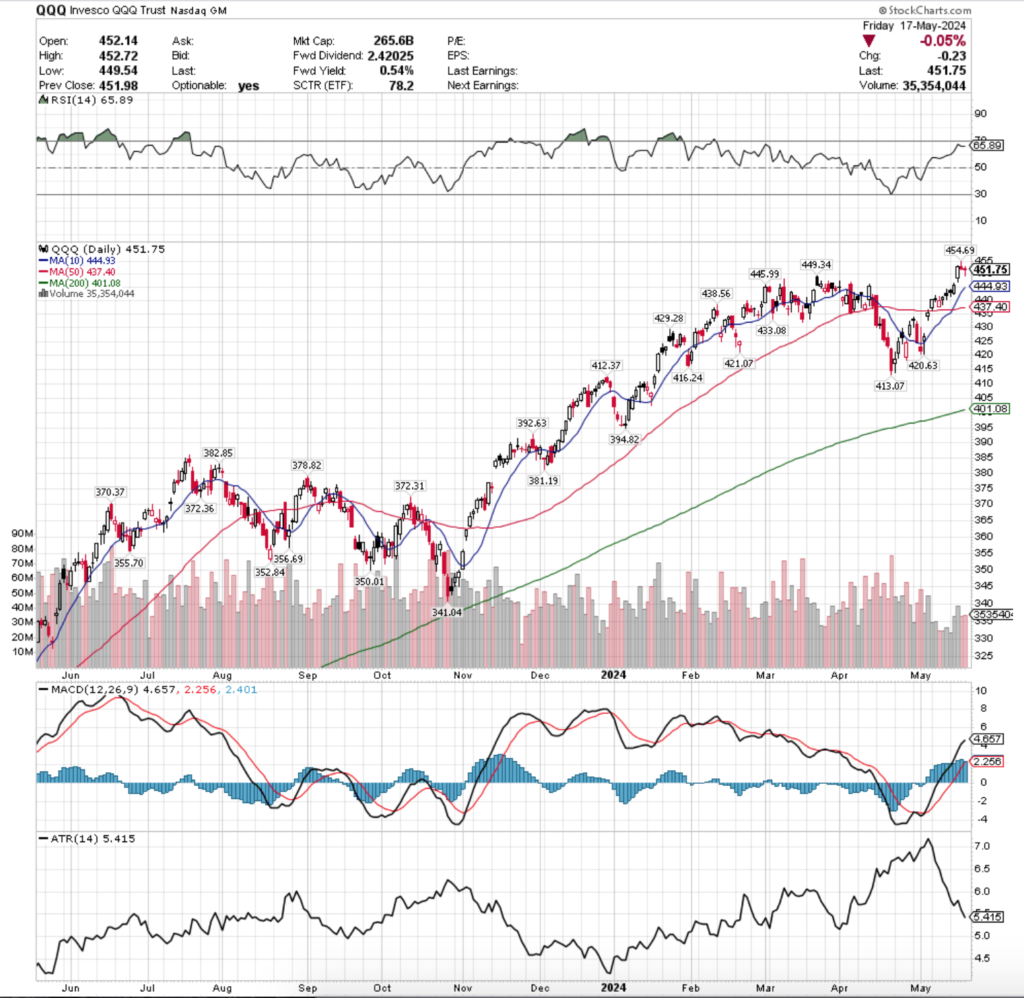
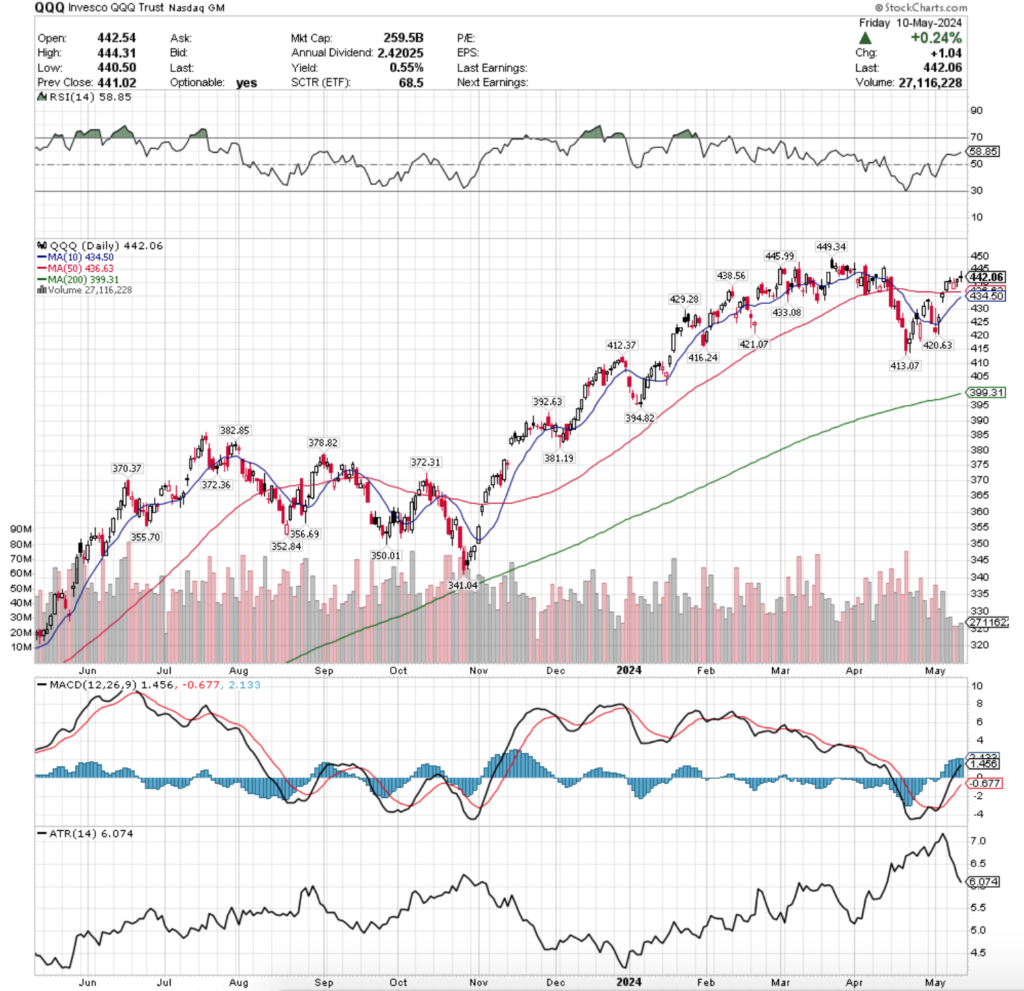
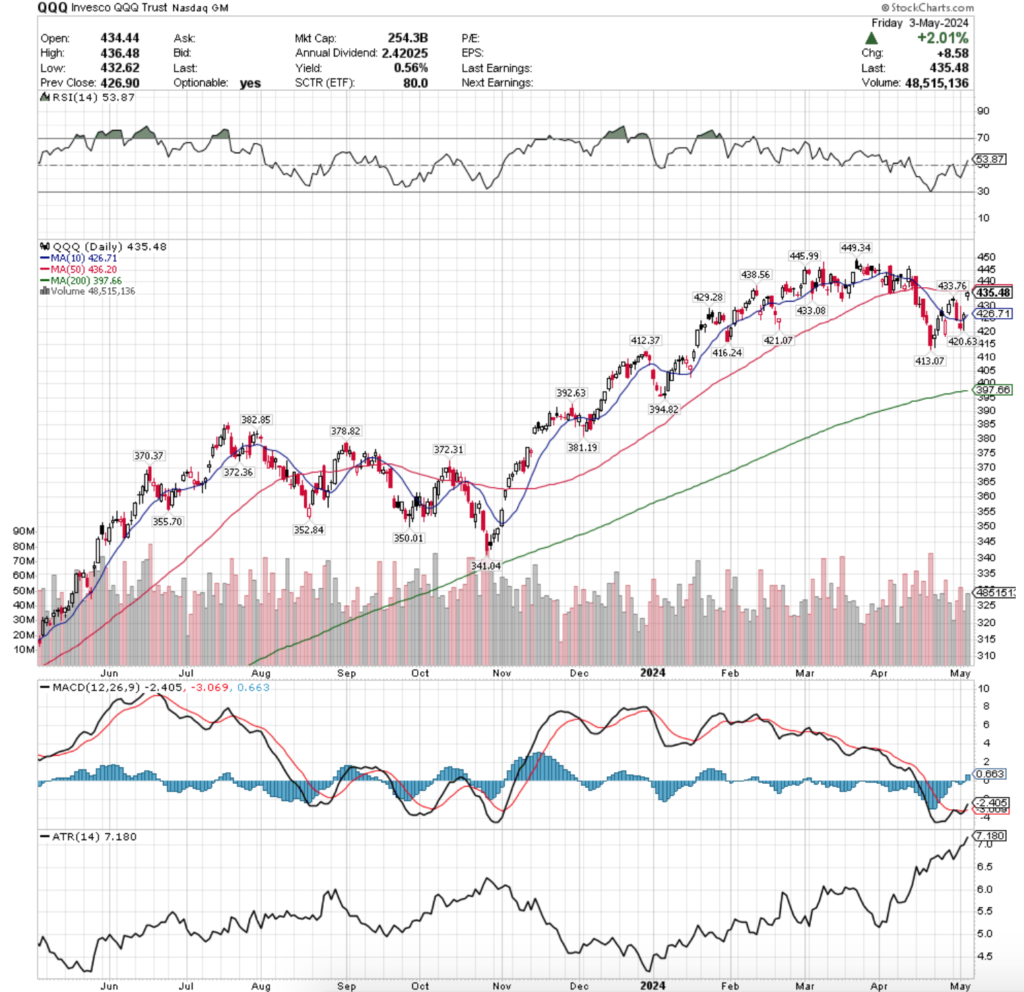
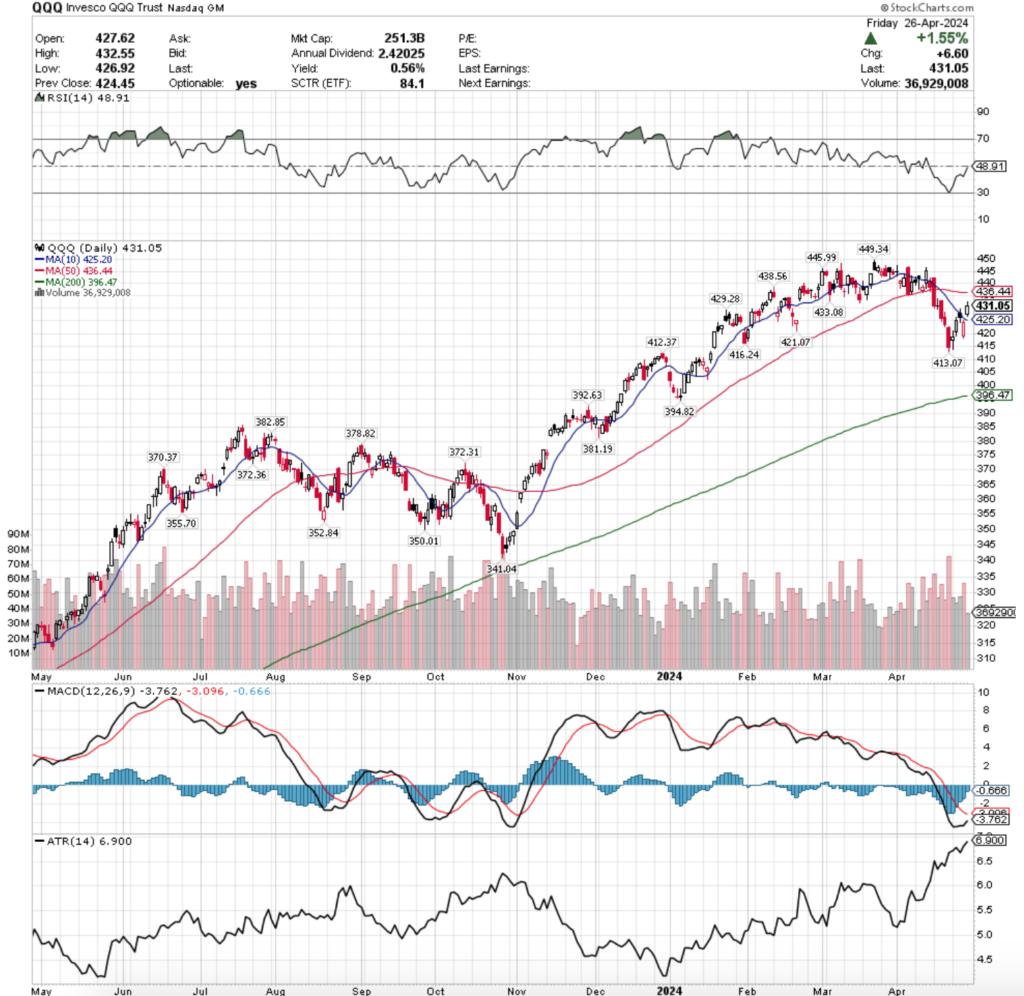
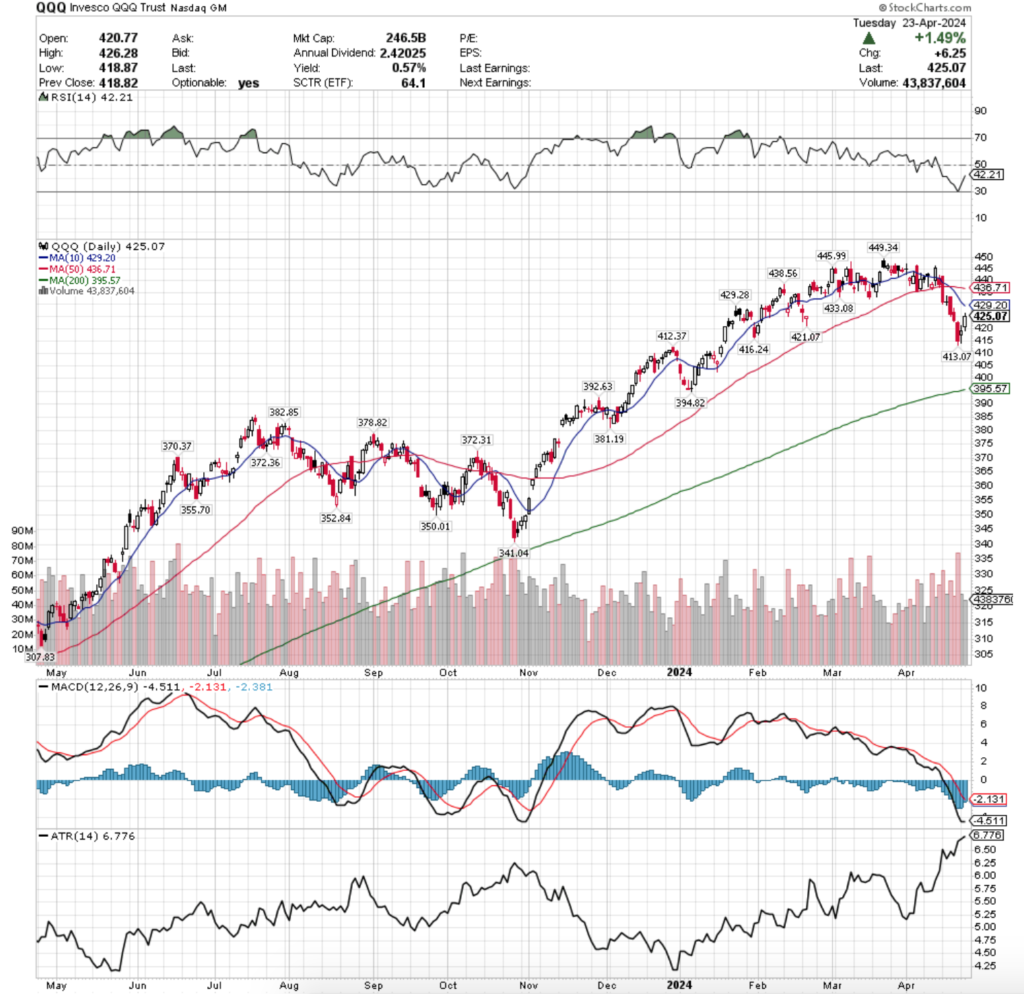
QQQ, the Invesco QQQ Trust ETF that tracks the NASDAQ 100 gained +0.21%, faring the worst of the major four index ETFs.
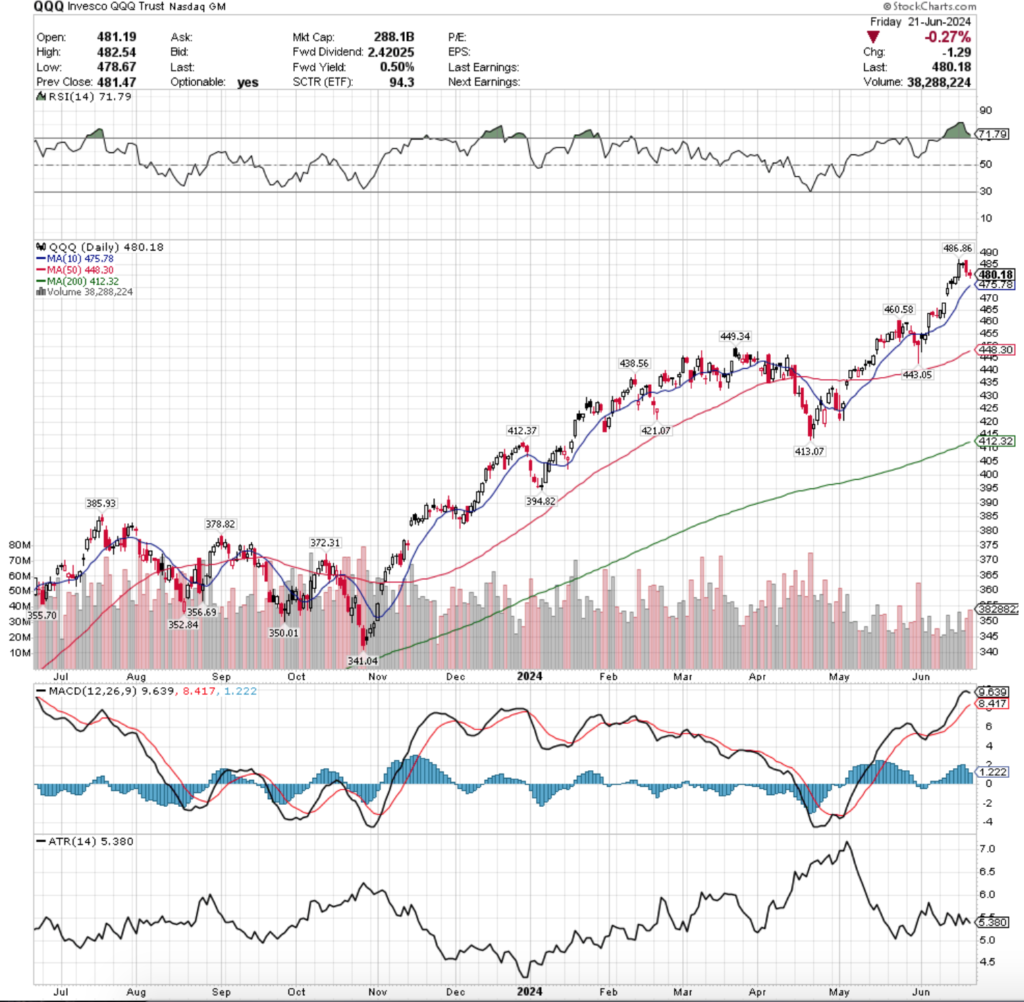
Their RSI is still overbought at 71.79, but it is trending back towards neutral, while their MACD is still bullish but showing signs of weakening & a bearish crossover this coming week.
Volumes were -27.21% below average last week compared to the previous year’s average (33,217,150 vs. 45,637,118), which is still weak even aside from the shortened trading week’s impact.
Monday started similarly for QQQ as it did for SPY, as a wide range session kicked off the week on an advancing note.
Tuesday also was similar to SPY, when the lowest volumes of the week nudged the index ETF slightly higher, although QQQ’s resulted in a doji candle, indicating hesitancy & indecision on the part of market participants.
Thursday resumed with bearish sentiment as a bearish engulfing candle let the leg down on a declining session & paved the way for Friday’s declines on the highest volume of the week, as folks wanted risk-off into the weekend.
Friday’s candle indicated that there is even more uncertainty on the horizon, as it resulted in a spinning top for the session.
QQQ has moved in a more similar manner to SPY than the other indexes, and as a result it has the same things to be keeping an eye on this week.
The impending MACD crossover’s actual declines hinge on the strength of the 10 DMA’s support, which is currently <1% from QQQ’s price.
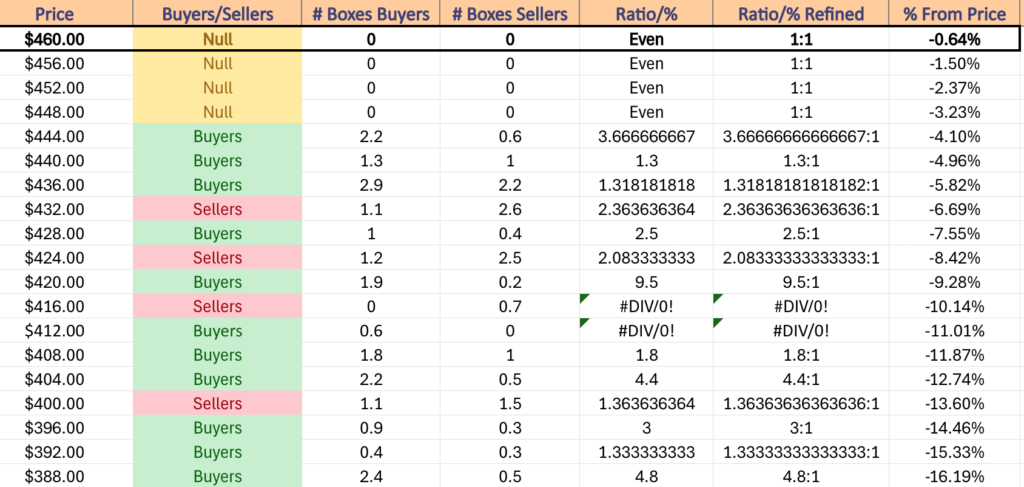
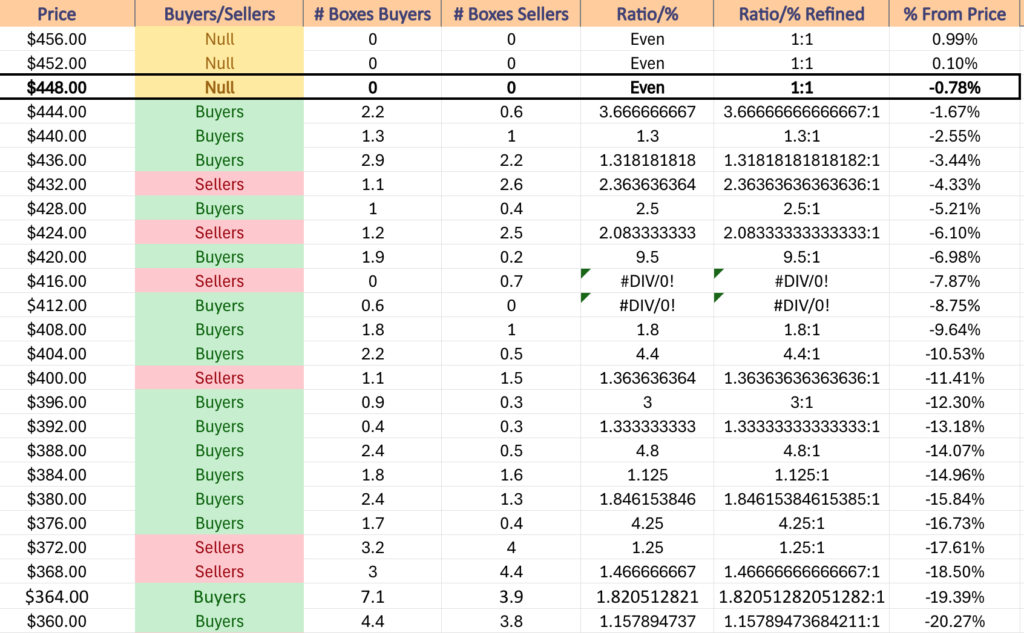
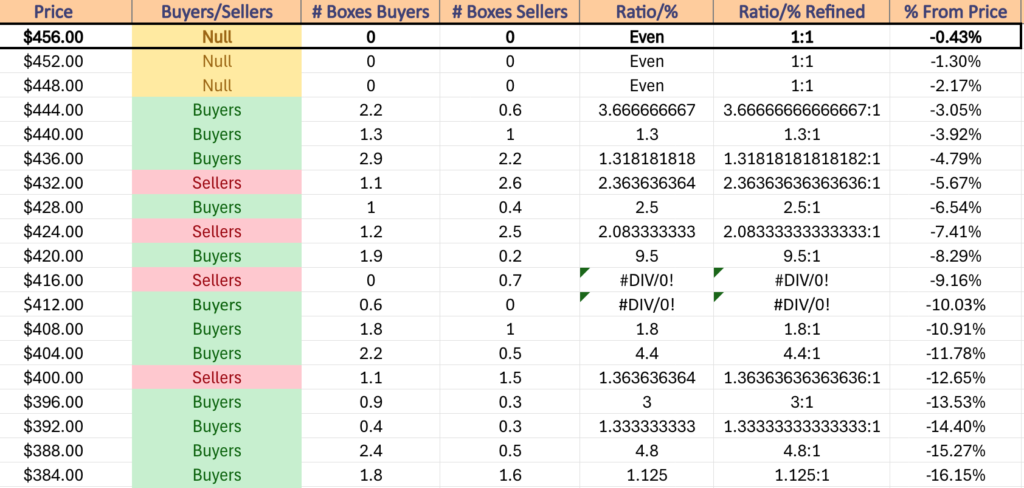
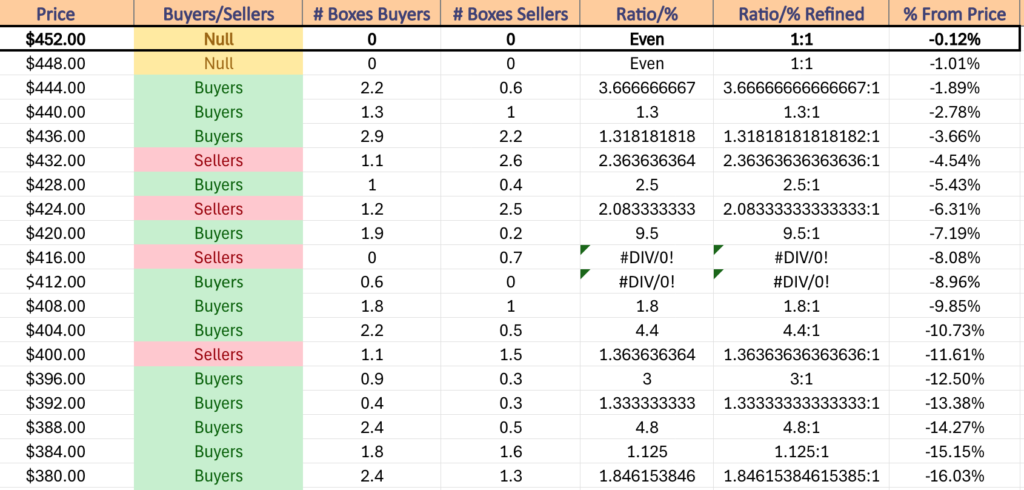
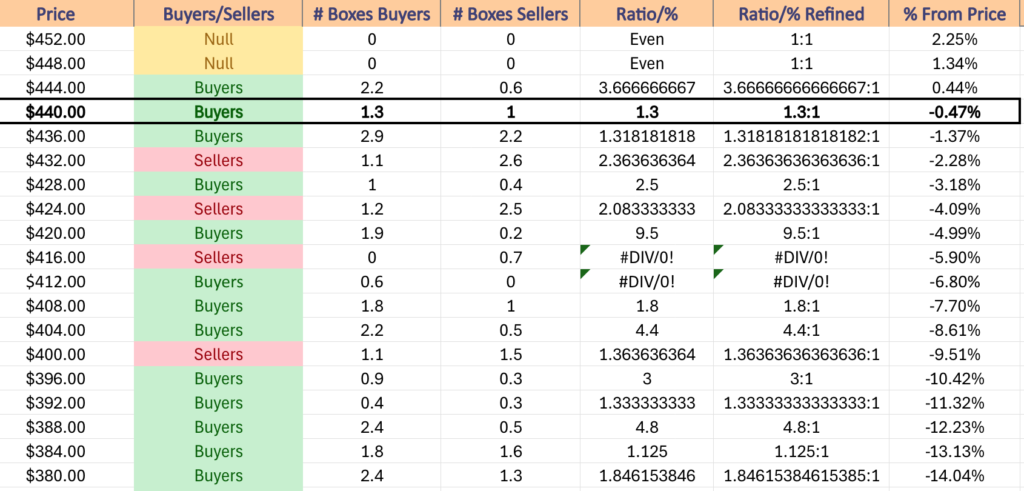
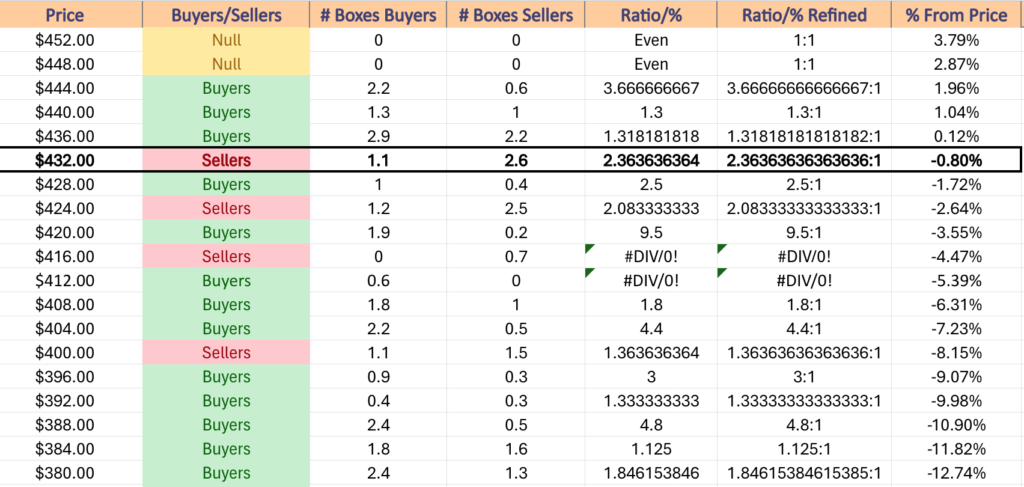
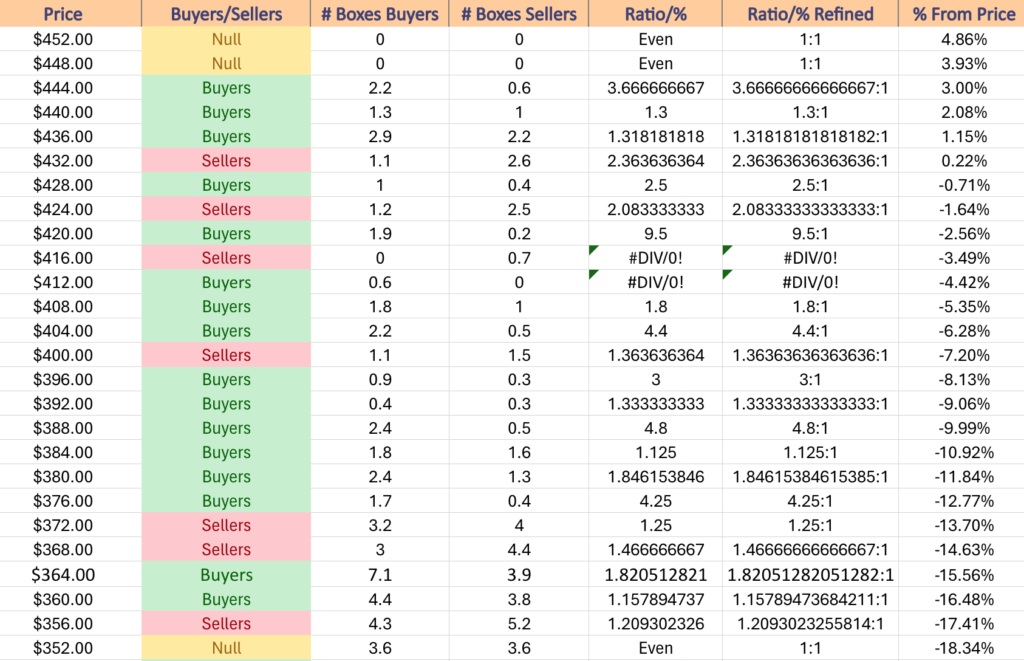
Their next support level is ~4% below their current price, with another ~2% to go until another support level is found (including the 50 day moving average).
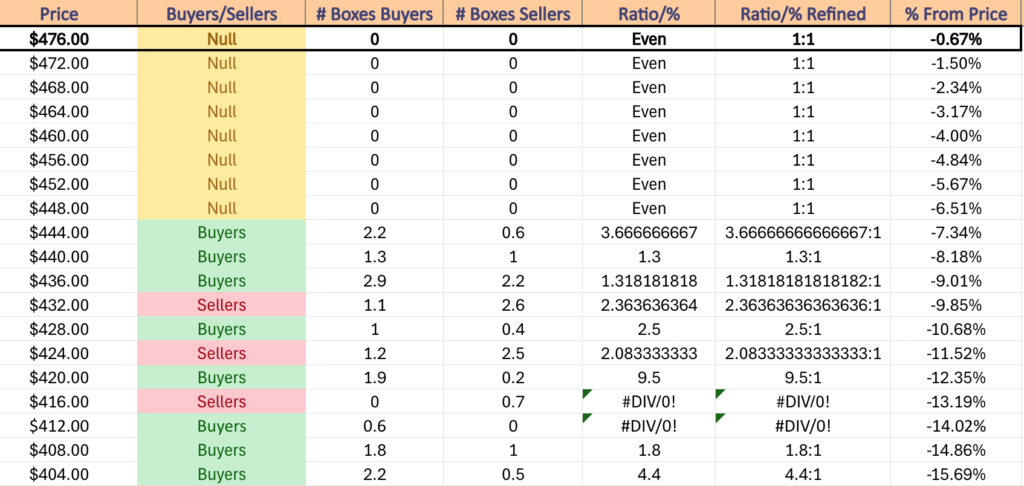
Also, like SPY, keep an eye on the RSI of QQQ as it begins a near-term decline, noting how price is behaving as it approaches the neutral level, which will happen should the gap from last week begin to fill.
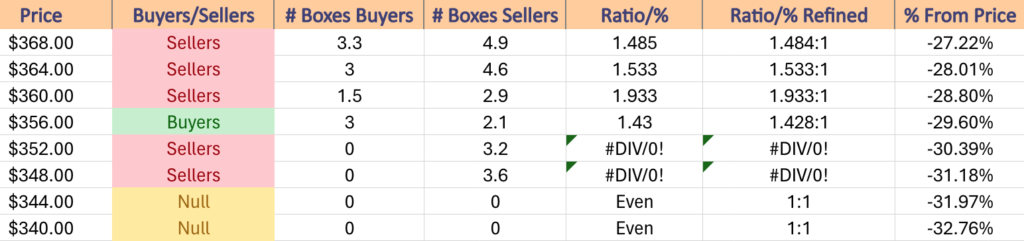
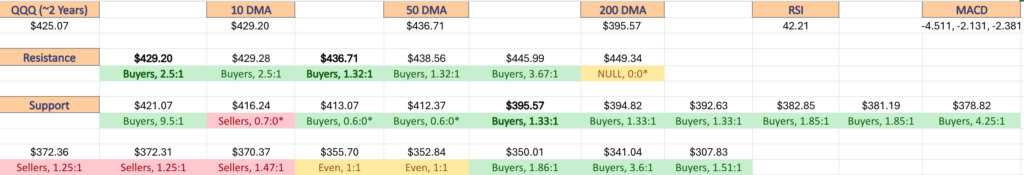
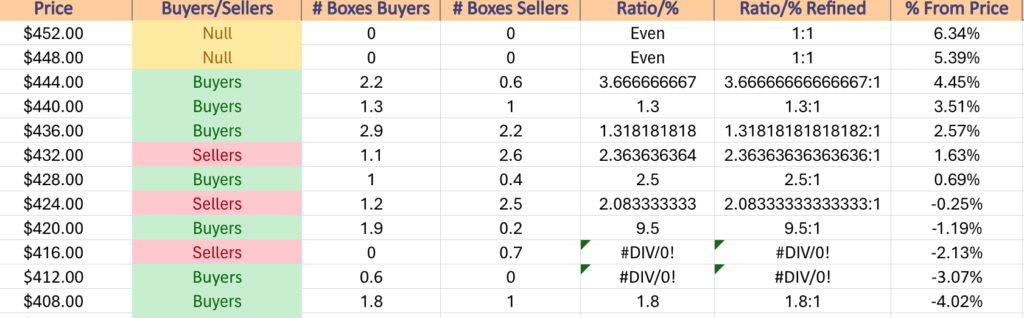
QQQ has support at the $475.78 (10 Day Moving Average, Volume Sentiment: NULL, 0:0*), $460.58 (Volume Sentiment: NULL, 0:0*), $449.34 (Volume Sentiment: NULL, 0:0*) & $448.30/share (50 Day Moving Average, Volume Sentiment: NULL, 0:0*) price levels, with resistance at the $486.86/share (All-Time High, Volume Sentiment: NULL, 0:0*) price level.
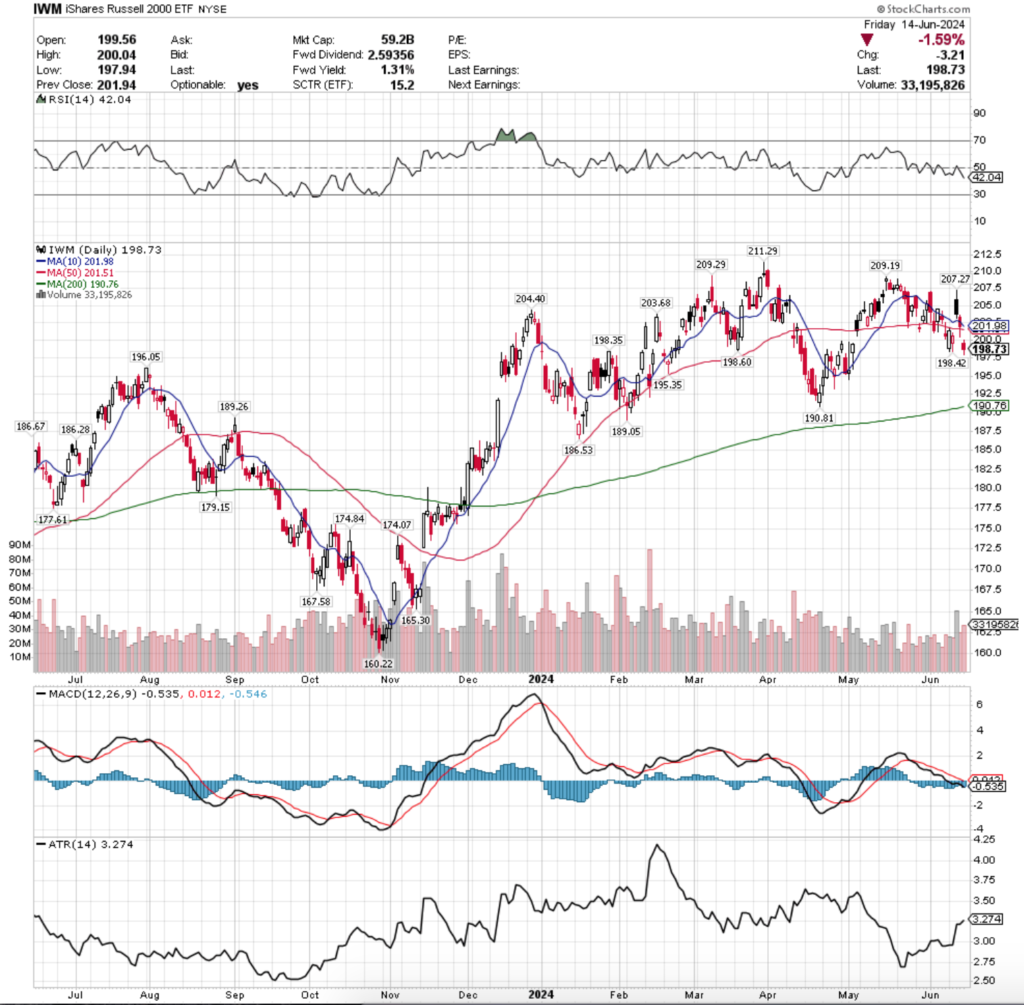
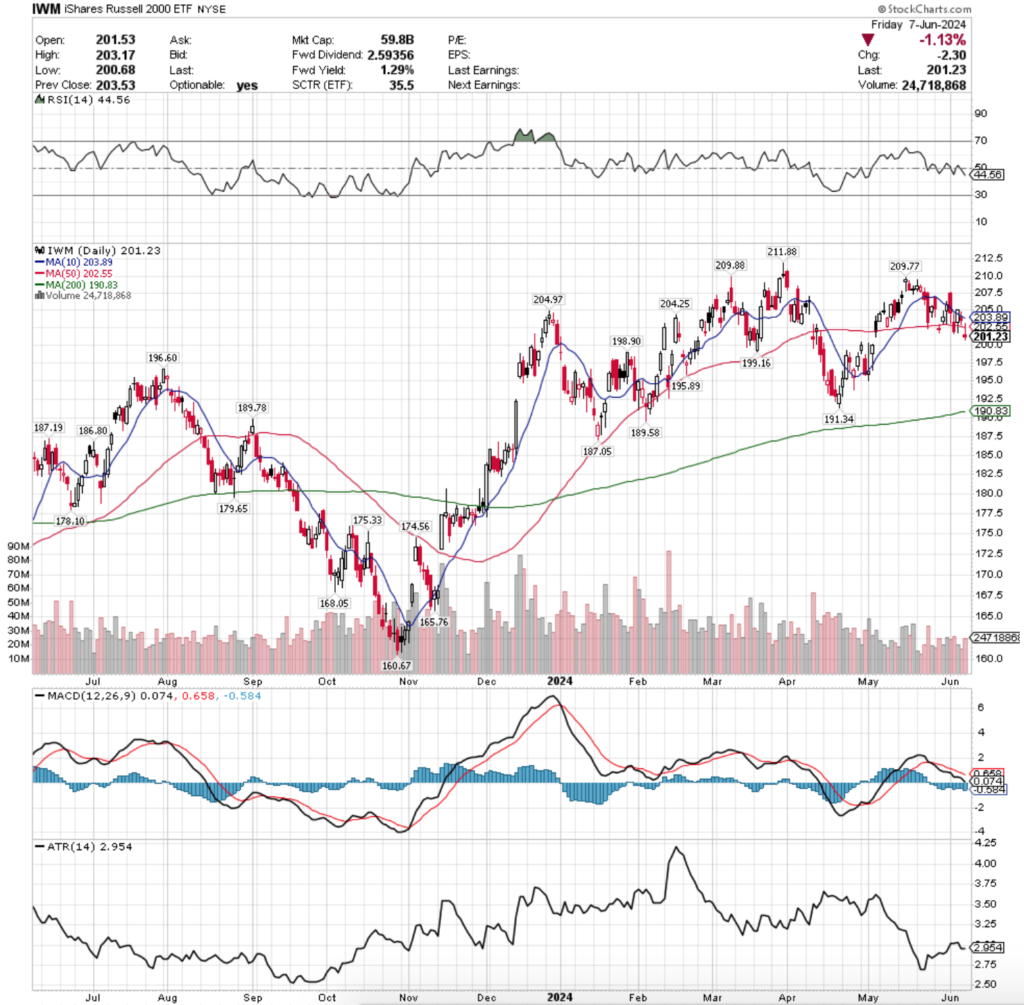
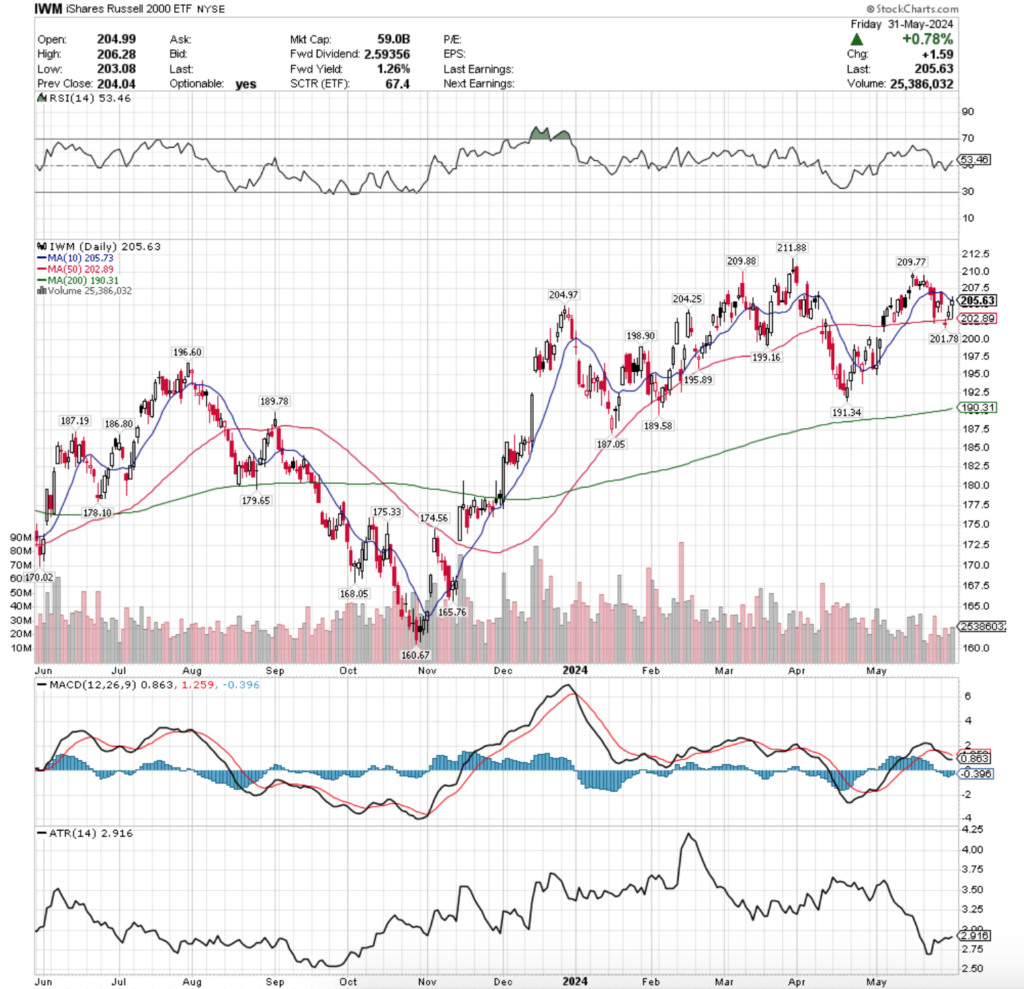
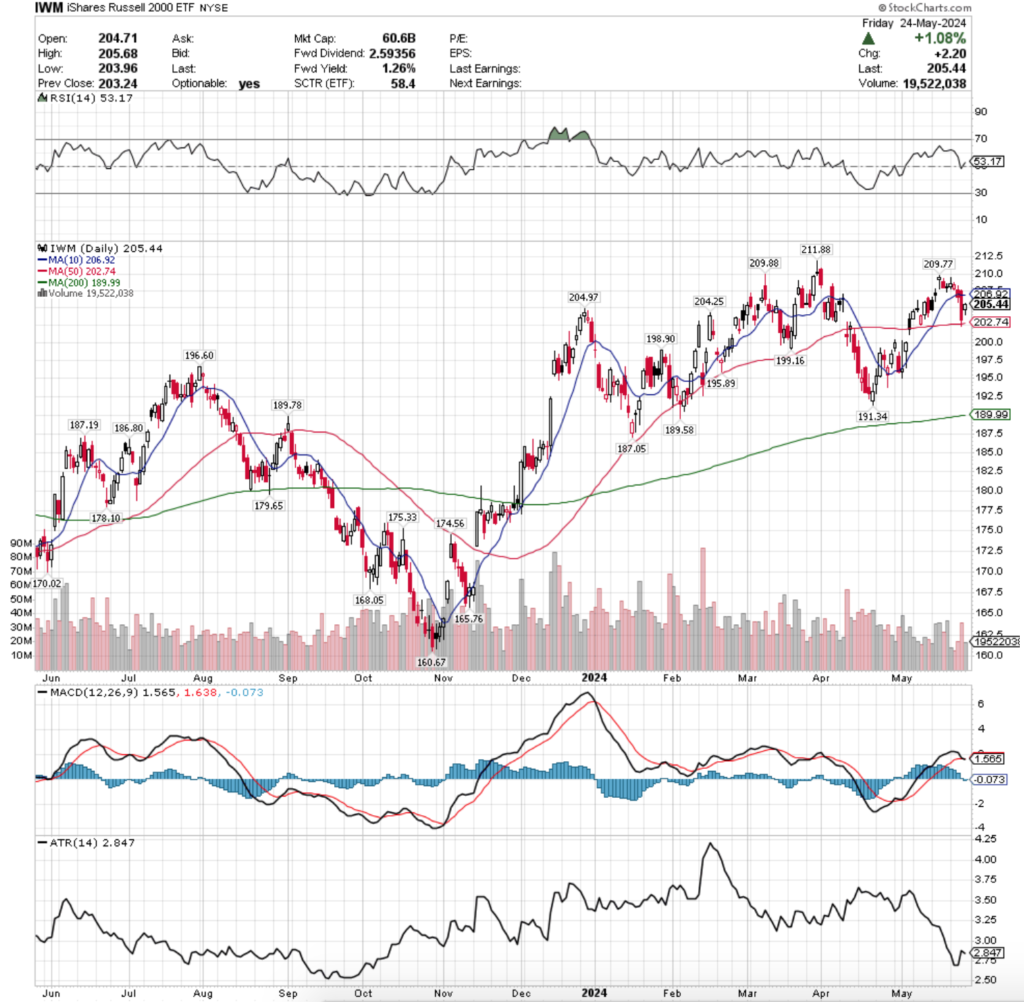
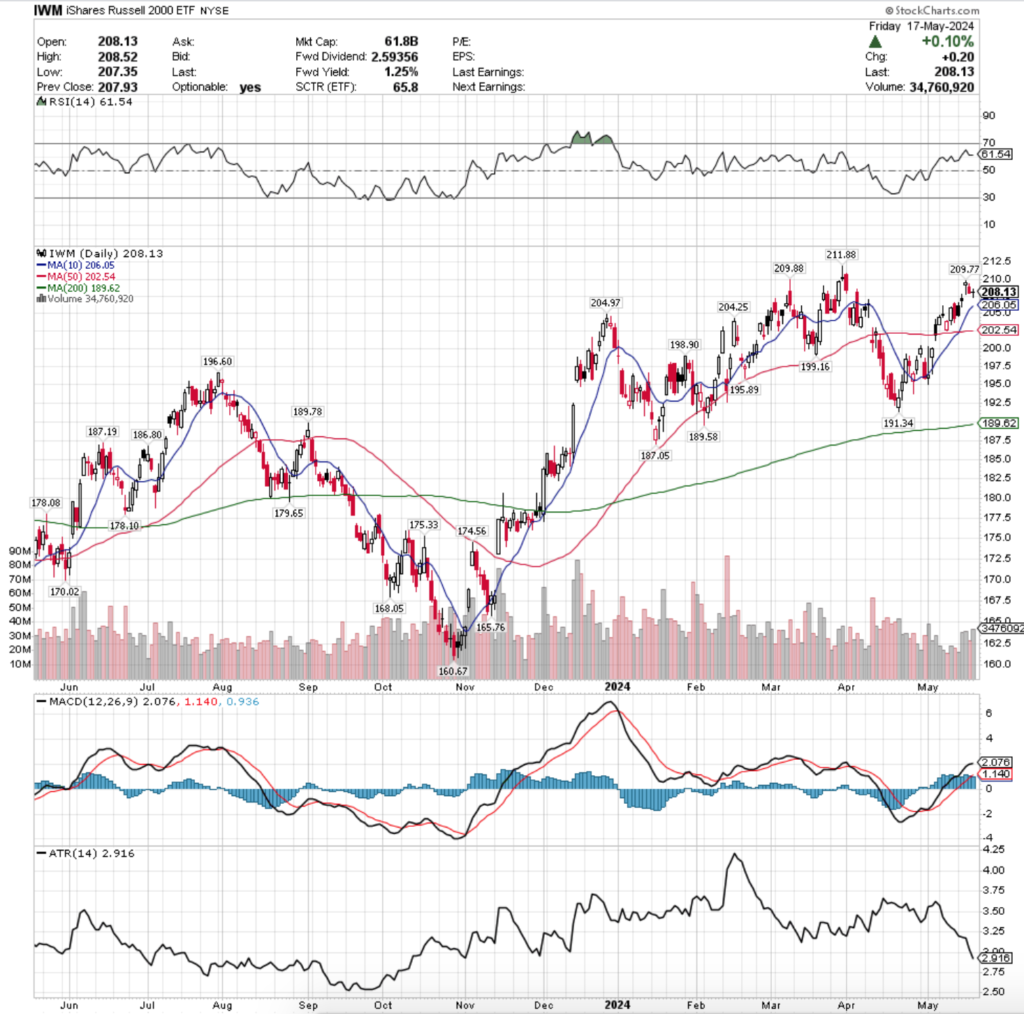
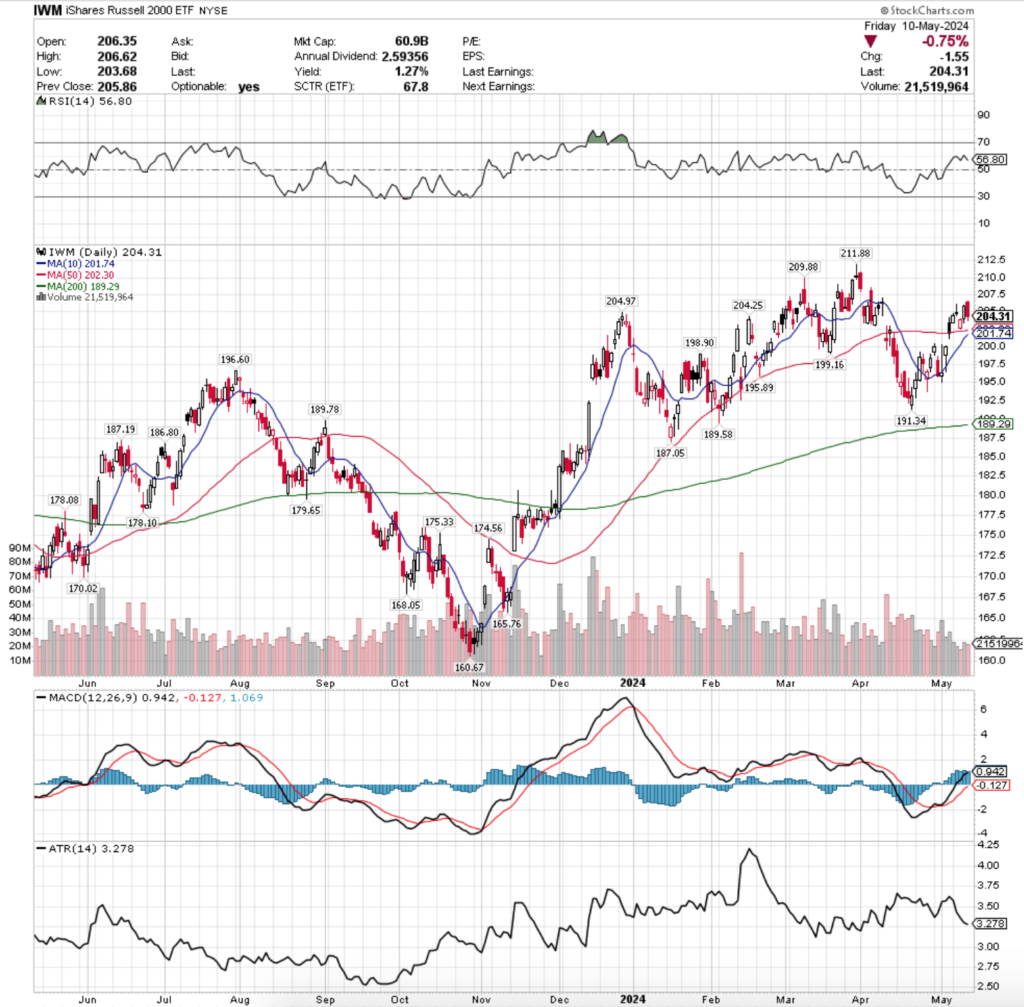
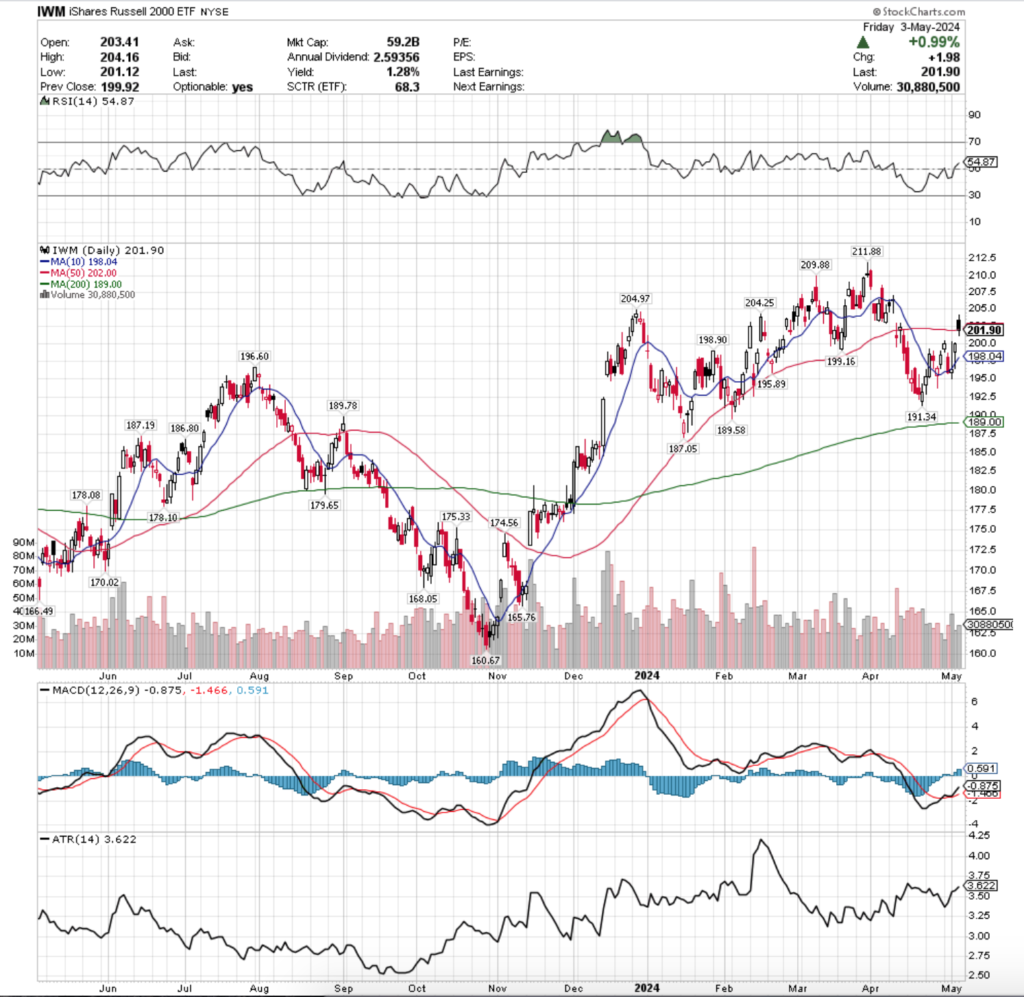
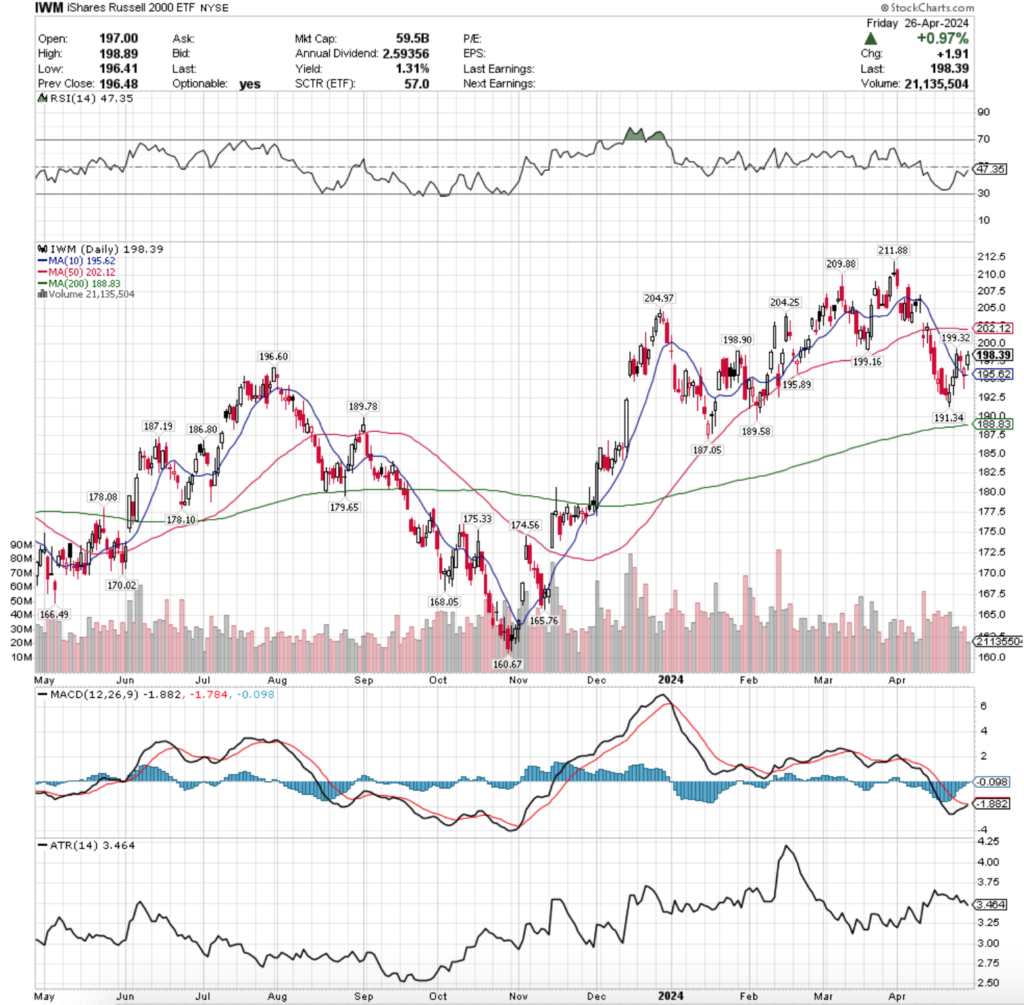
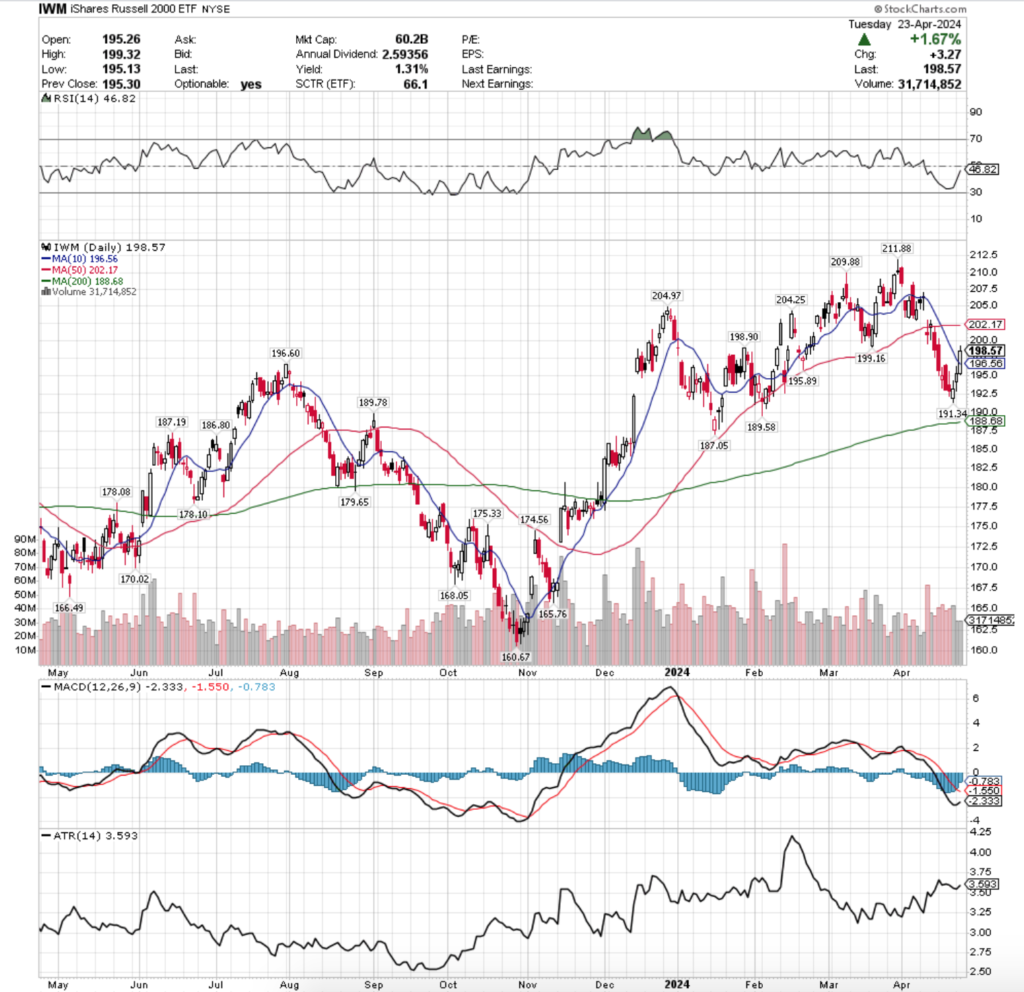
IWM, the iShares Russell 2000 ETF climbed +0.82% last week, mostly due to Monday’s bullish session that set the stage for the rest of the week.
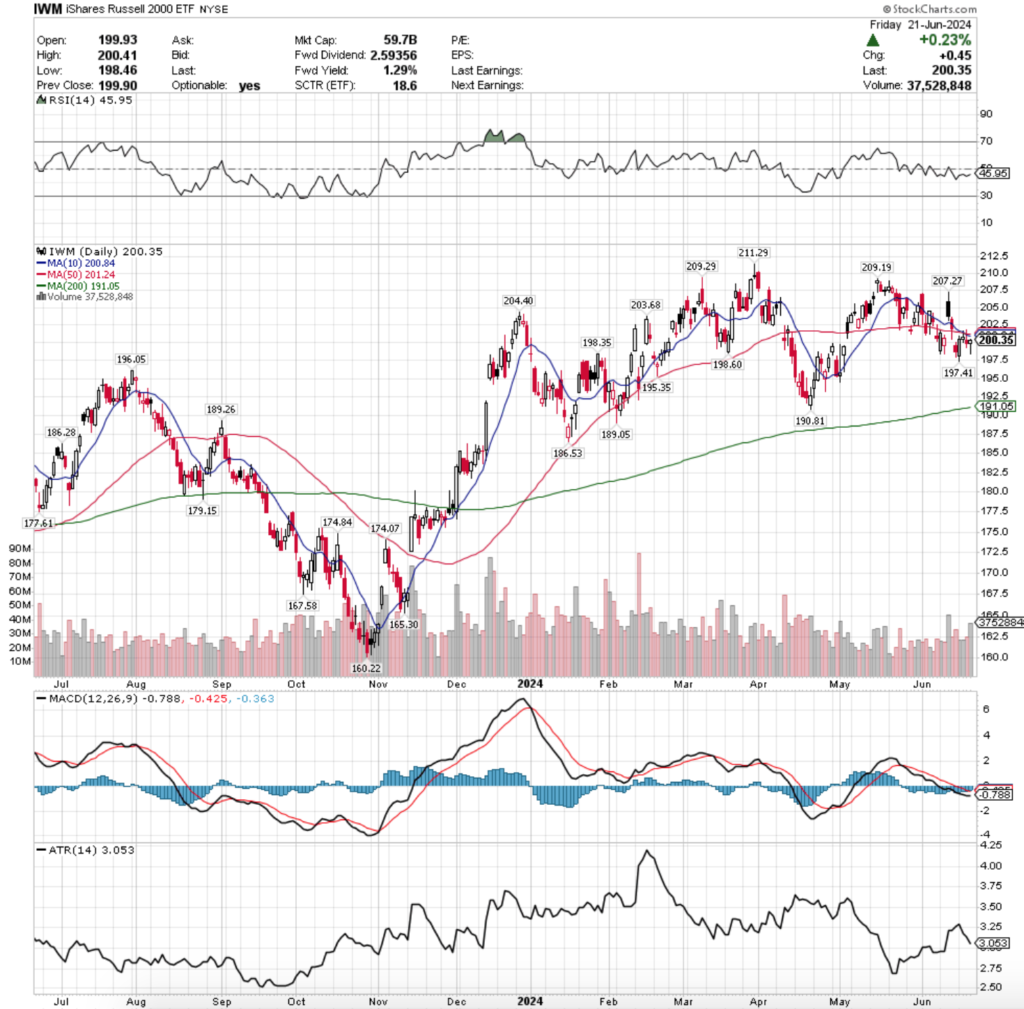
Their RSI is currently at 45.95, trending up towards the neutral 50 mark, while their MACD is still bearish, but beginning to show signs of a potential bullish crossover of the signal line in the near-term.
Volumes were -13.64% below average vs. the prior year (29,124,000 vs. 33,725,106), which were the closest to normal of the major index ETFs.
IWM’s week started off with a wide-range session that spurred the rest of the week’s advances, but the low volume was unable to get it close enough up to test the strength of the 10 or 50 day moving averages.
Tuesday opened higher & tested back into Monday’s range before charging at the 10 & 50 DMA’s resistance, only to get rejected & sent back down to close for a daily gain.
Tuesday’s candle’s long upper shadow does not paint a strong case for the bulls, as despite is showing slight upside appetite, it clearly echoes that there are still more bears in the pool.
Thursday opened lower than Tuesday & ultimately rallied higher to break above the 10 & 50 DMAs’ resistance temporarily, before declining on the day’s session, including some testing lower towards the midway point of Monday morning’s candle’s real body.
Friday wound the week down with a hint of indecision, as the day advanced +0.23% with a spinning top candle, indicating that there is hesitancy on the part of market participants & confirming the strength of the 10 & 50 DMAs’ resistance.
Friday did however have the highest volume of the week for IWM, confirming that there was no appetite to go retest the 10 & 50 DMAs in the near-term.
Given that IWM trades more in a back & forth oscillation than the steep ascending indexes like SPY & QQQ they have more local support levels to help keep their prices up in the near-term.
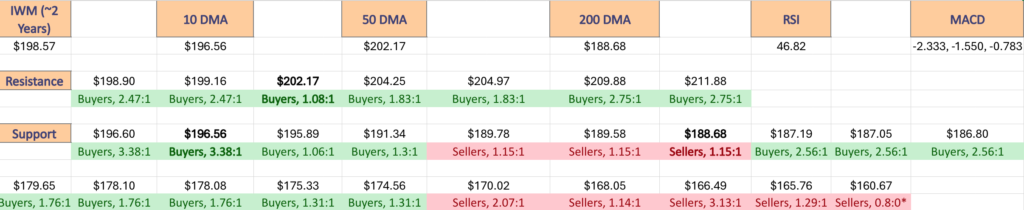
This week will be focused on seeing if IWM makes another run at the 10 & 50 DMAs’ resistance, particularly as their 200 DMA is ~5% from their current price to the downside, which will cause some pressure to be placed on IWM’s price in the coming weeks.
In the event that IWM does not break for the upside it will most likely continue forward much in the manner it has traded recently, a further consolidation range where the price is walked along by the 10 & 50 DMAs from above.
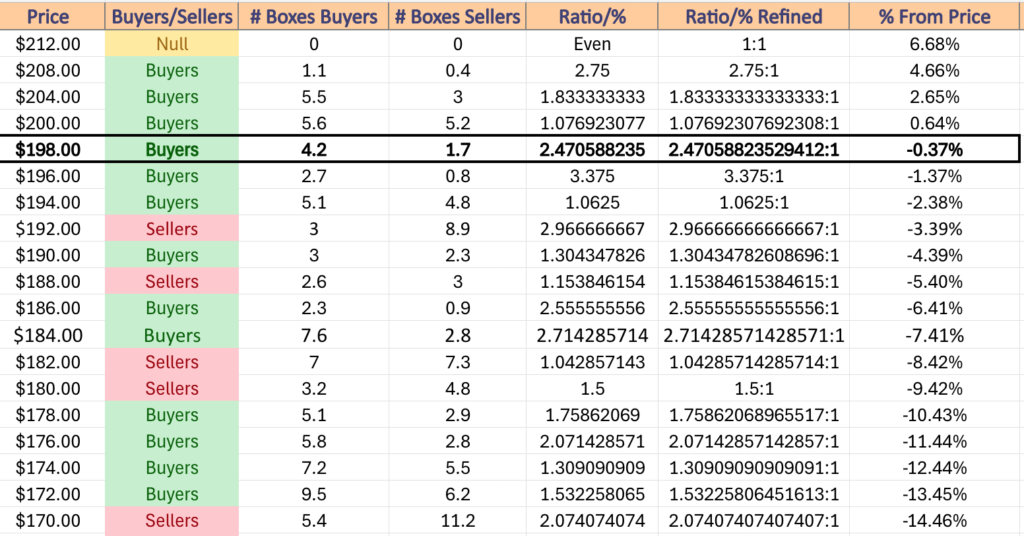
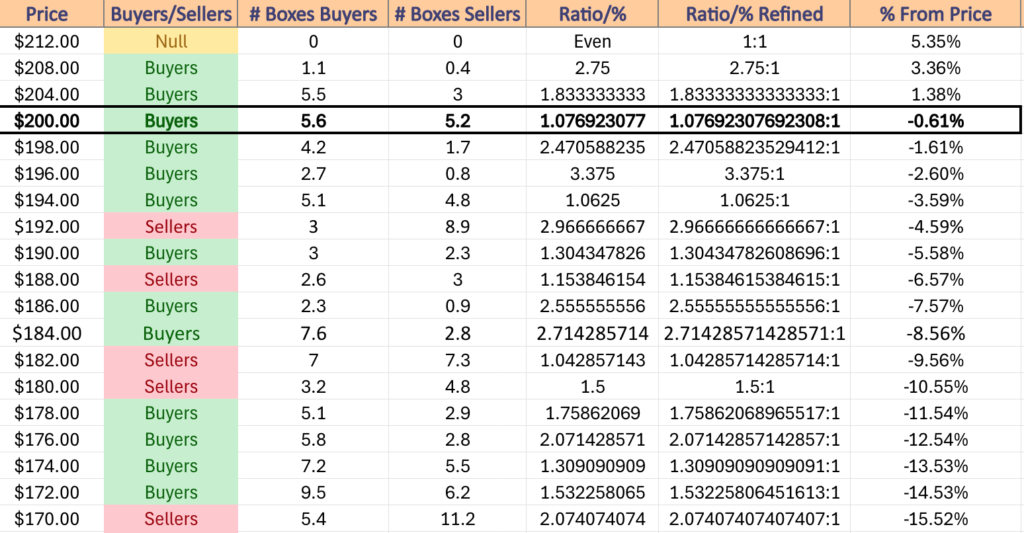
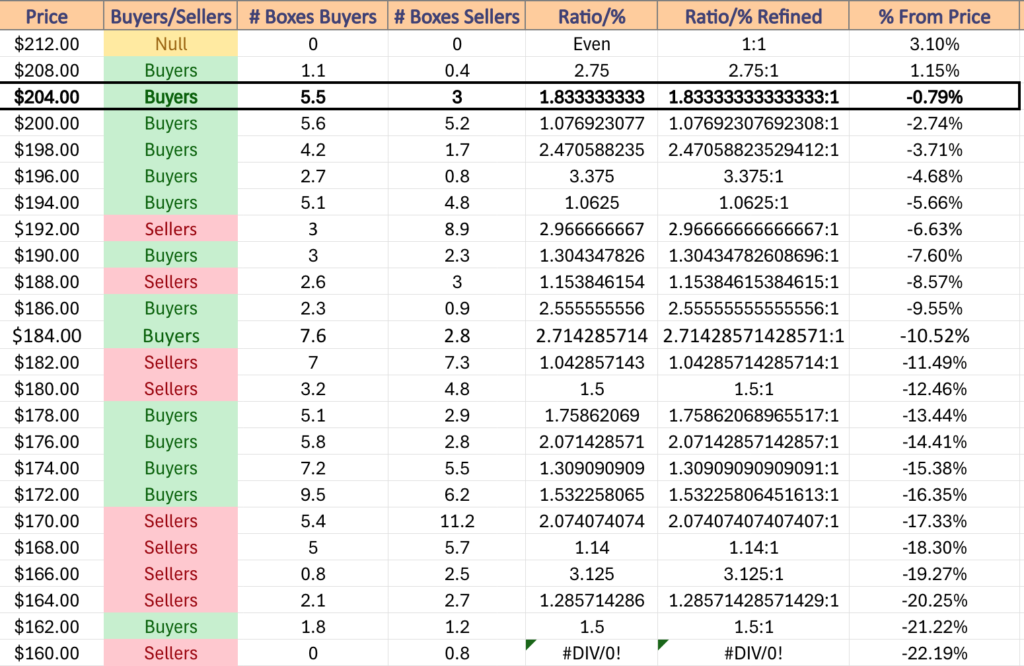
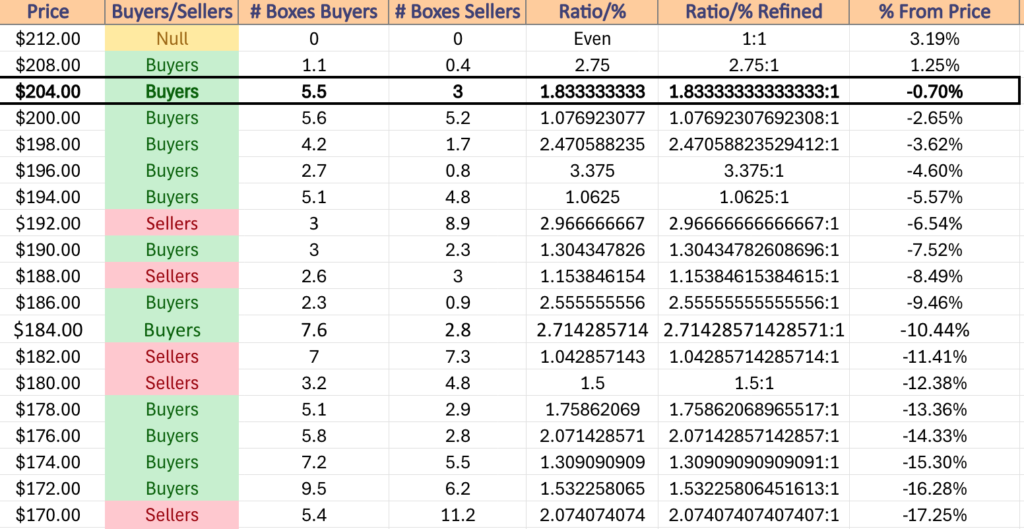
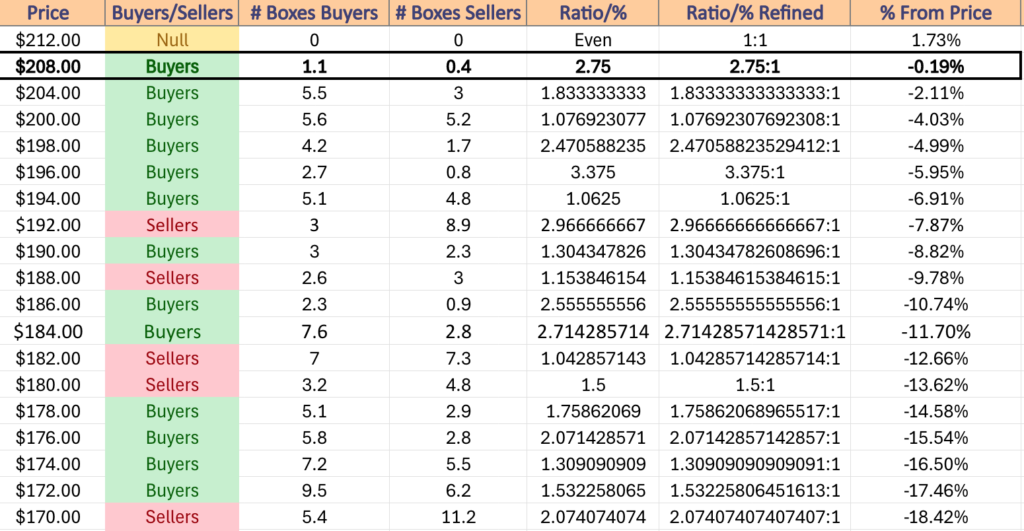
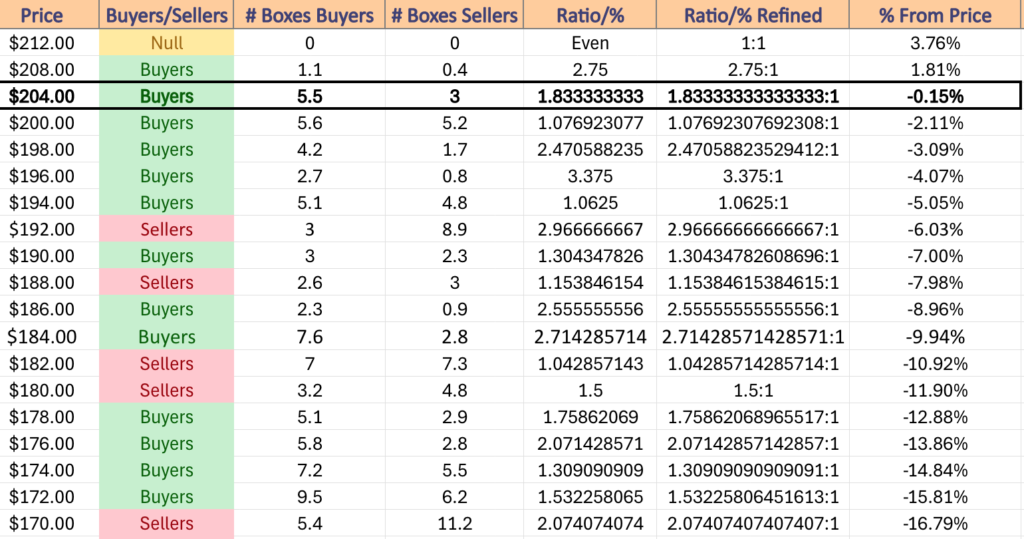
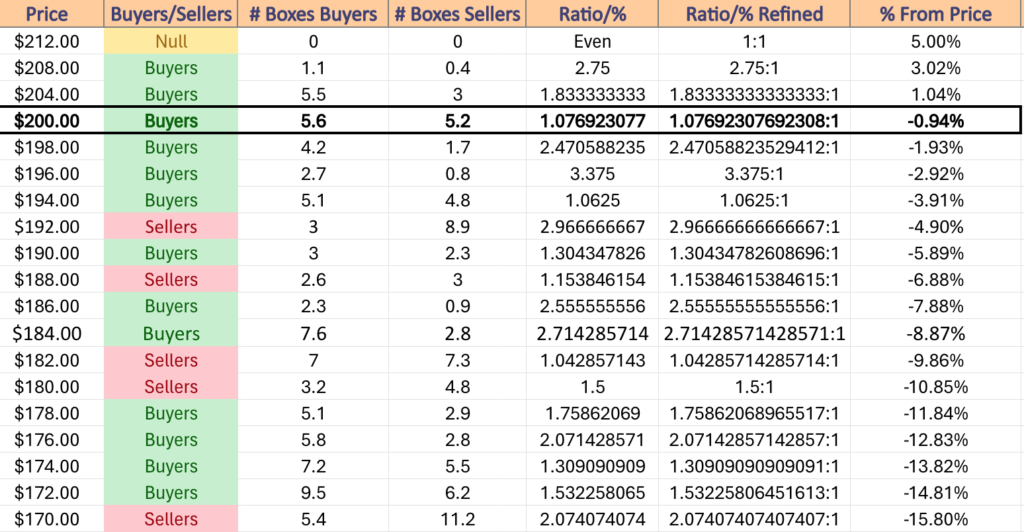
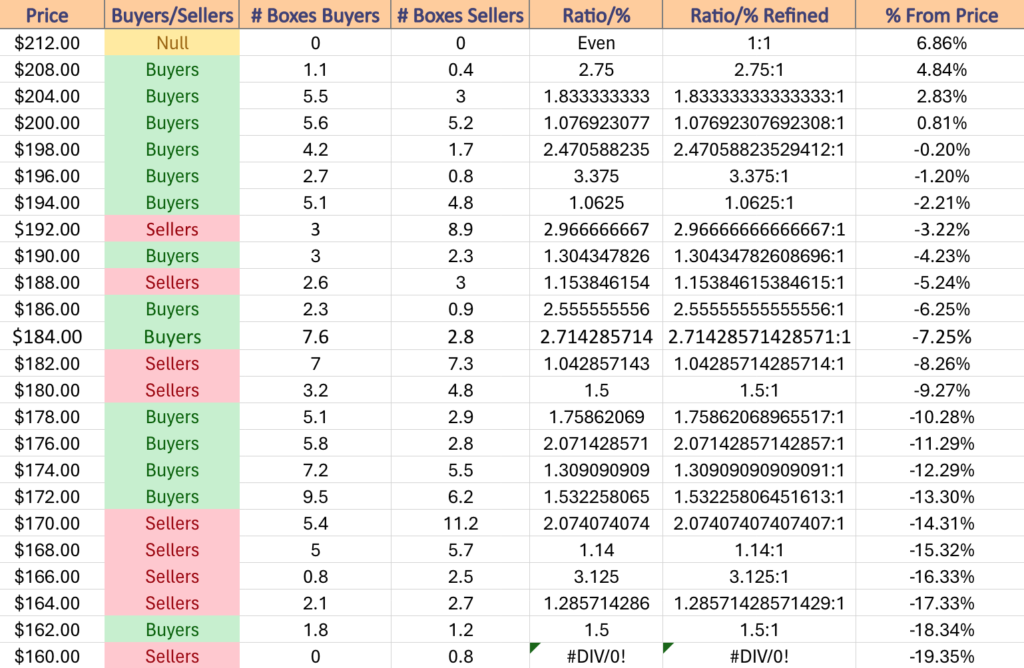
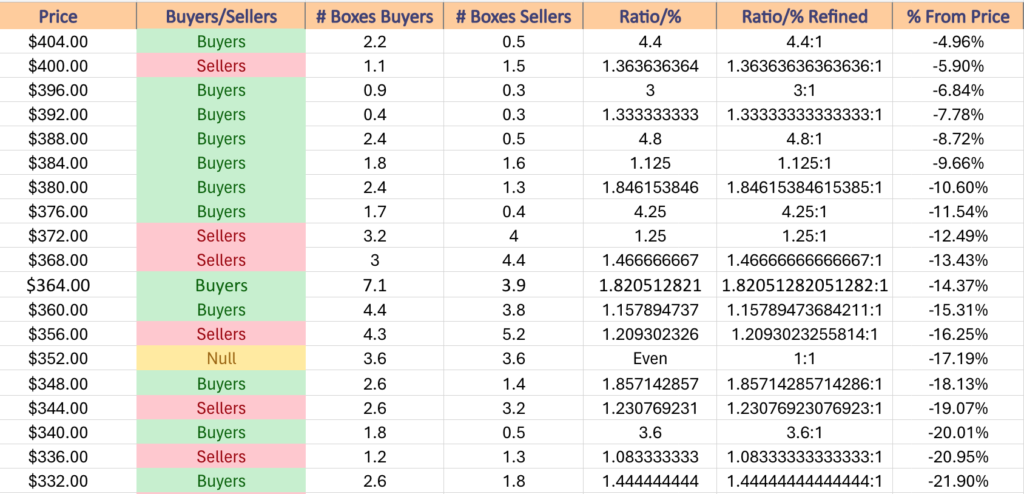
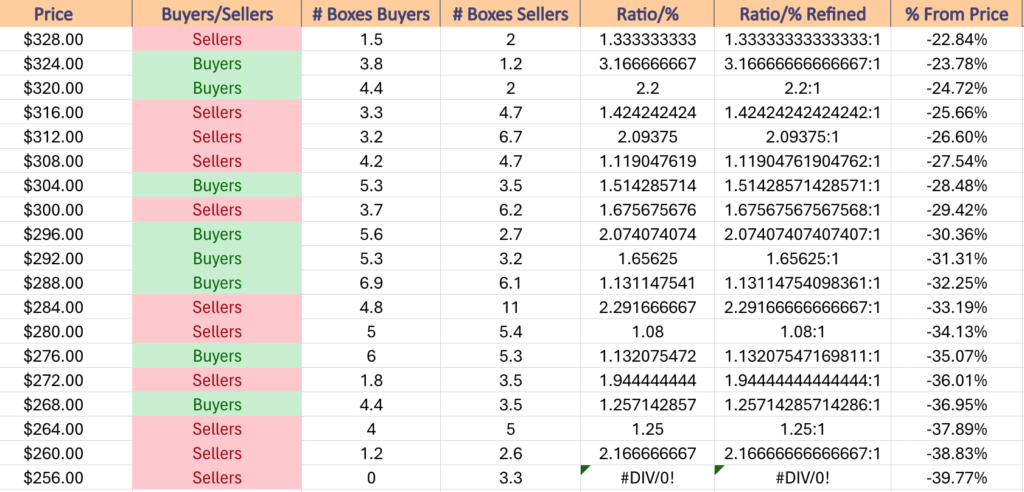
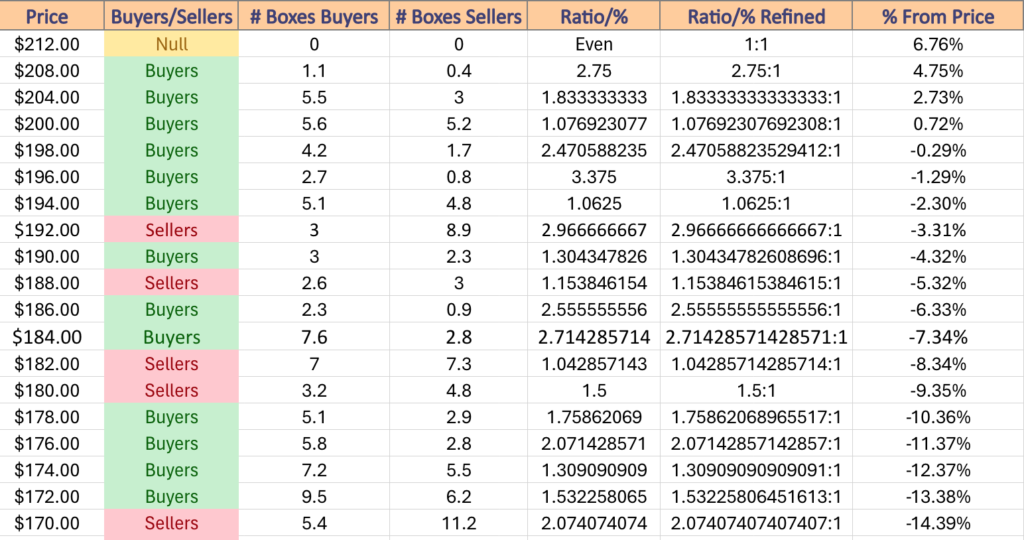
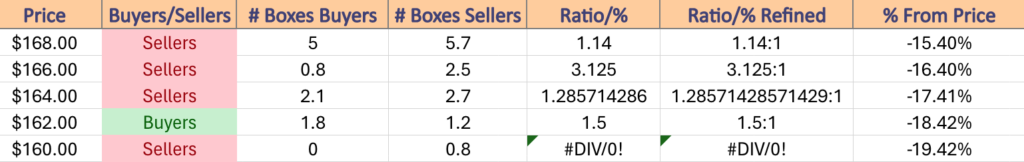
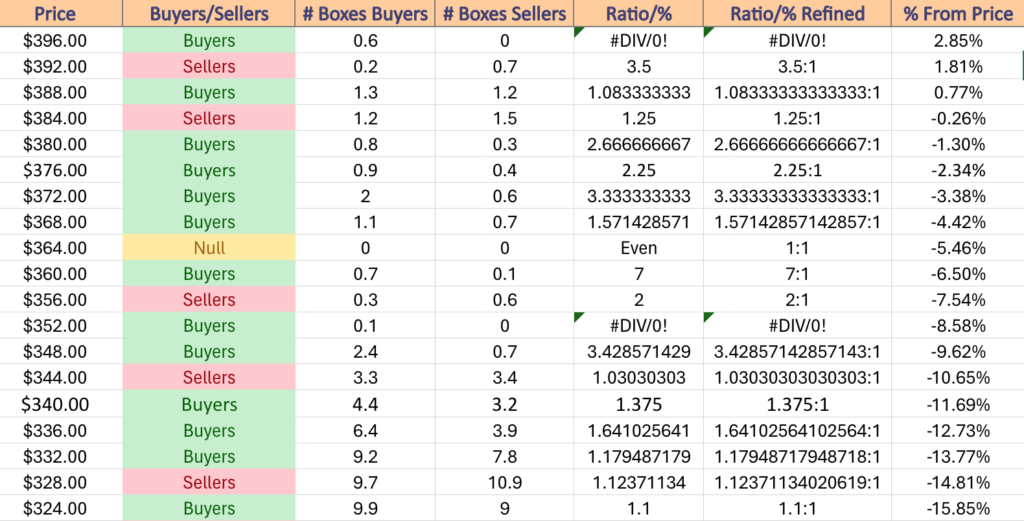
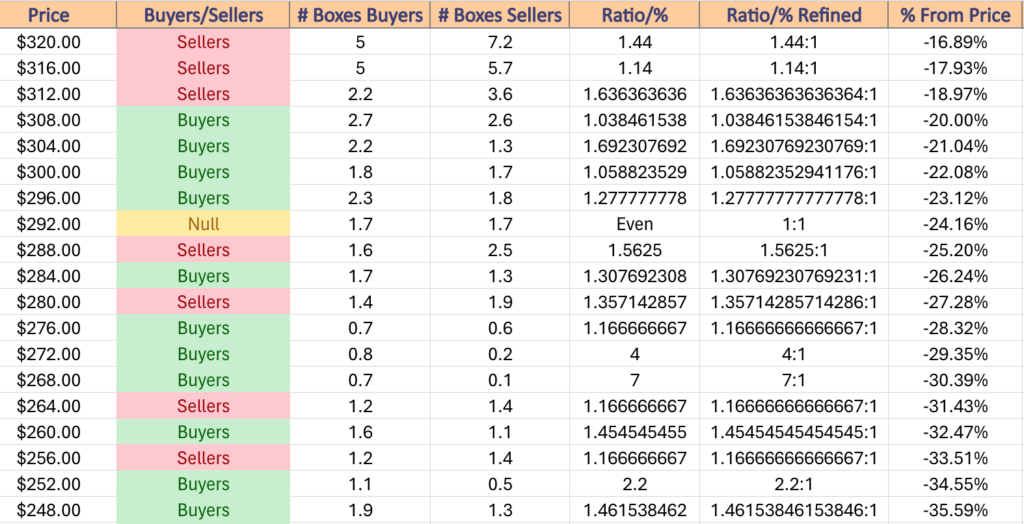
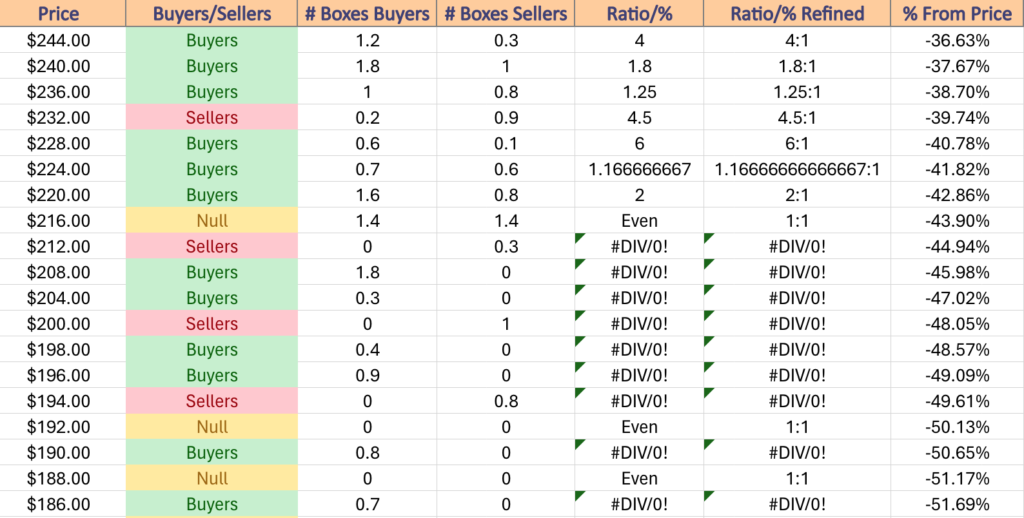
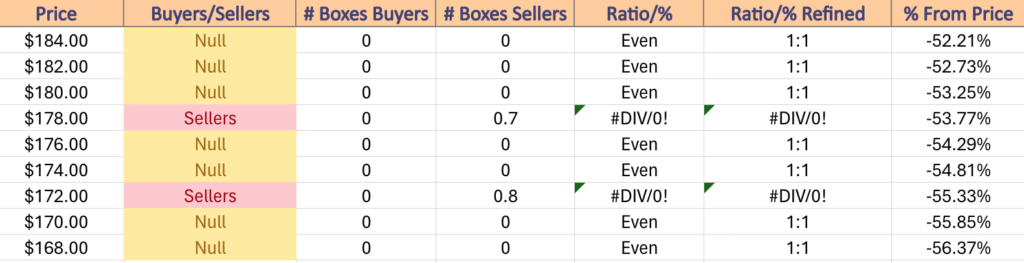
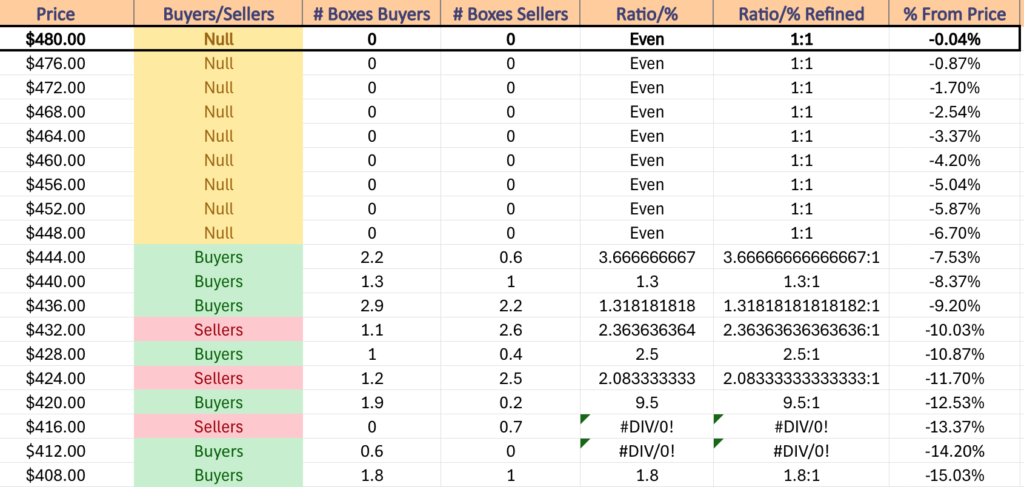
In an outright decline there are many support touch-points nearby that can help slow losses & control the decline, making it worth reviewing the table below that shows the strength of the price levels IWM has traded at over the past 1-2 years.
IWM has support at the $198.60 (Volume Sentiment: Buyers, 2.47:1), $198.35 (Volume Sentiment: Buyers, 2.47:1), $197.41 (Volume Sentiment: Buyers, 3.38:1) & $196.05/share (Volume Sentiment: Buyers, 3.38:1) price levels, with resistance at the $200.84 (10 Day Moving Average, Volume Sentiment: Buyers, 1.08:1), $201.24 (50 Day Moving Average, Volume Sentiment: Buyers, 1.08:1), $203.68 (Volume Sentiment: Buyers, 1.08:1) & $204.40/share (Volume Sentiment: Buyers, 1.83:1) price level.

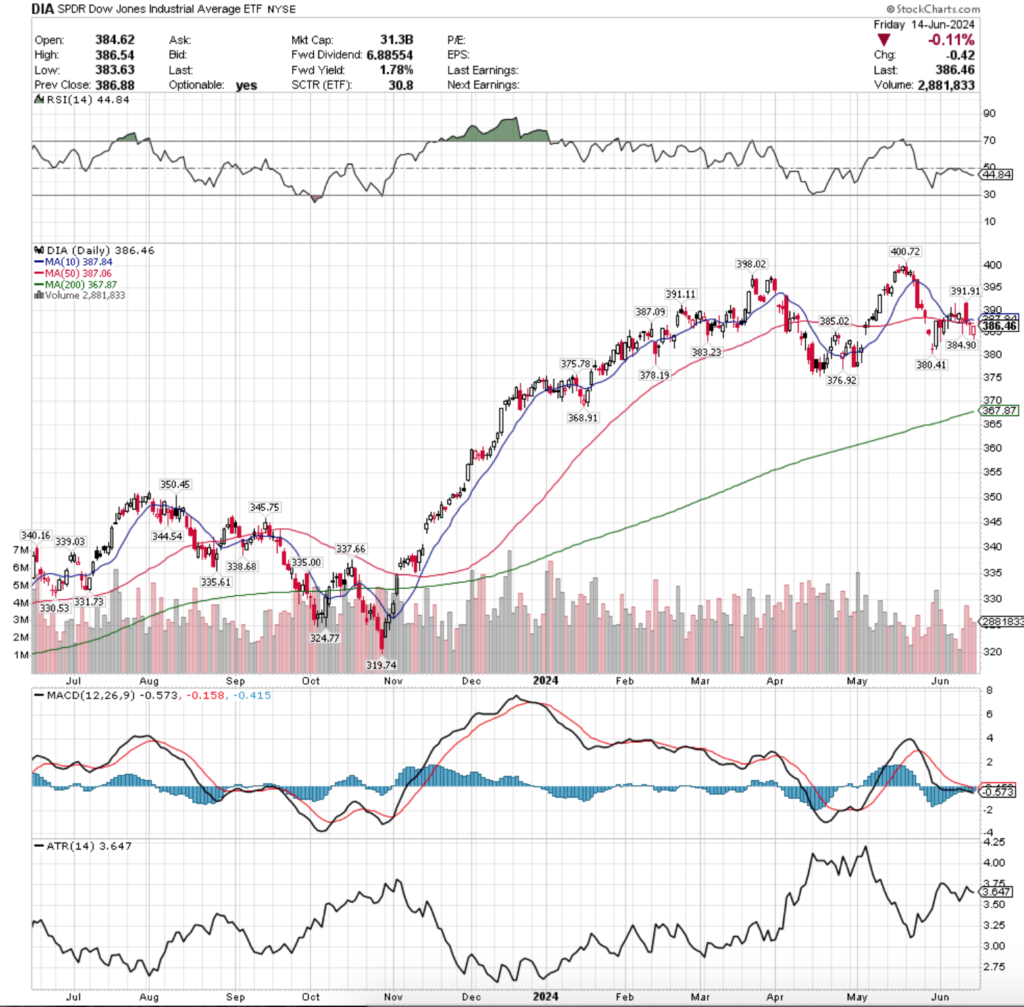
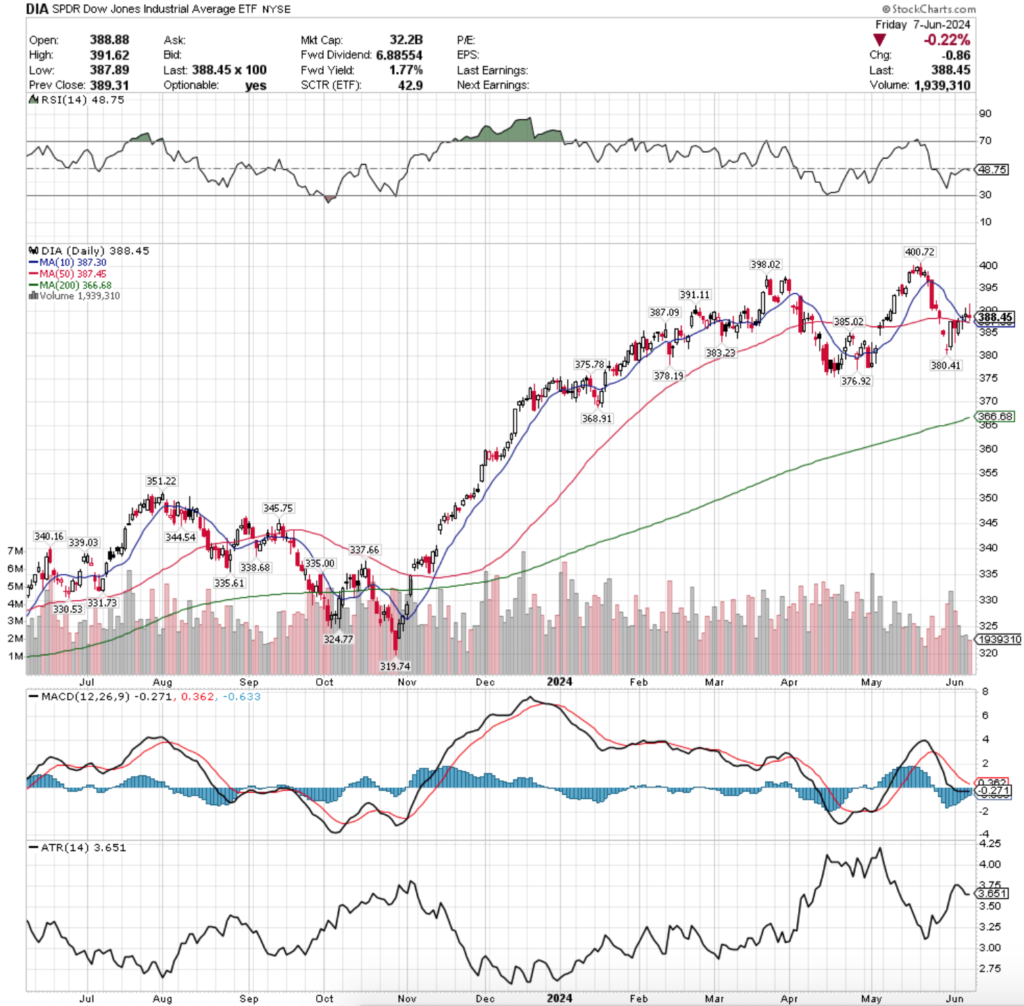
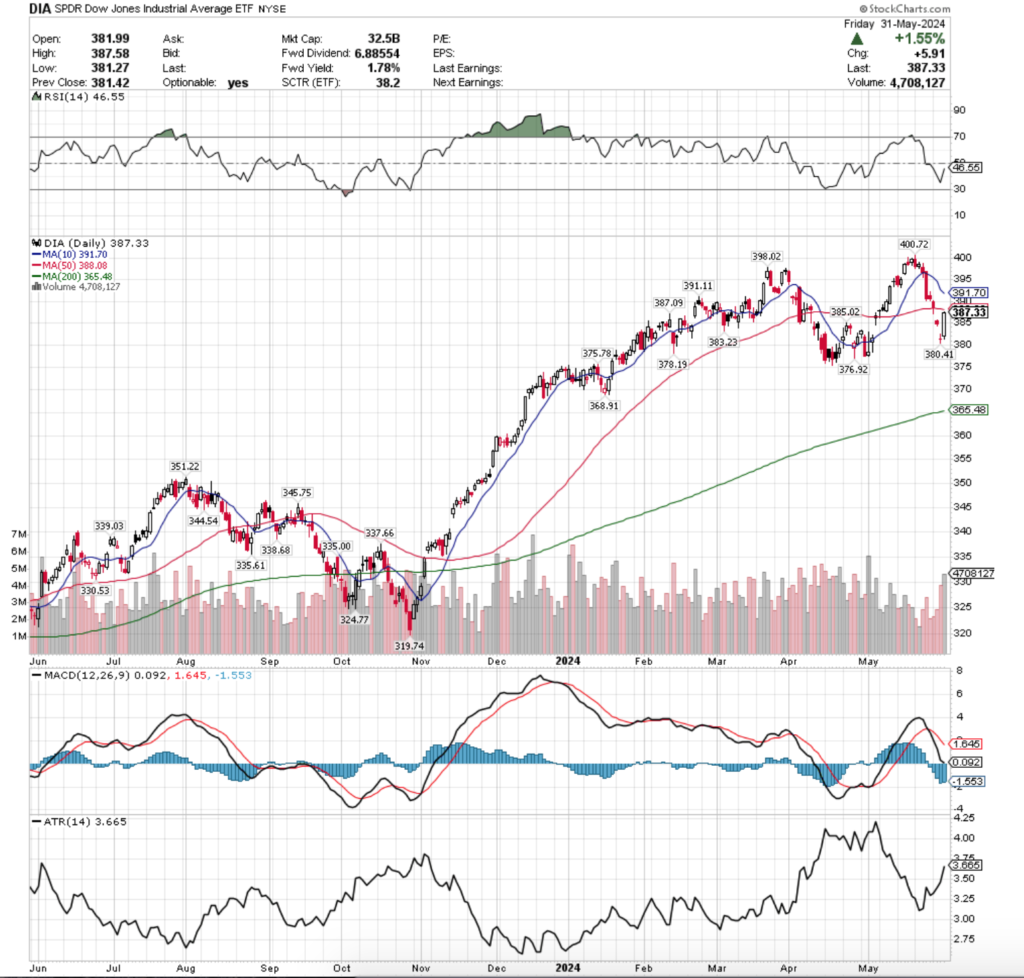
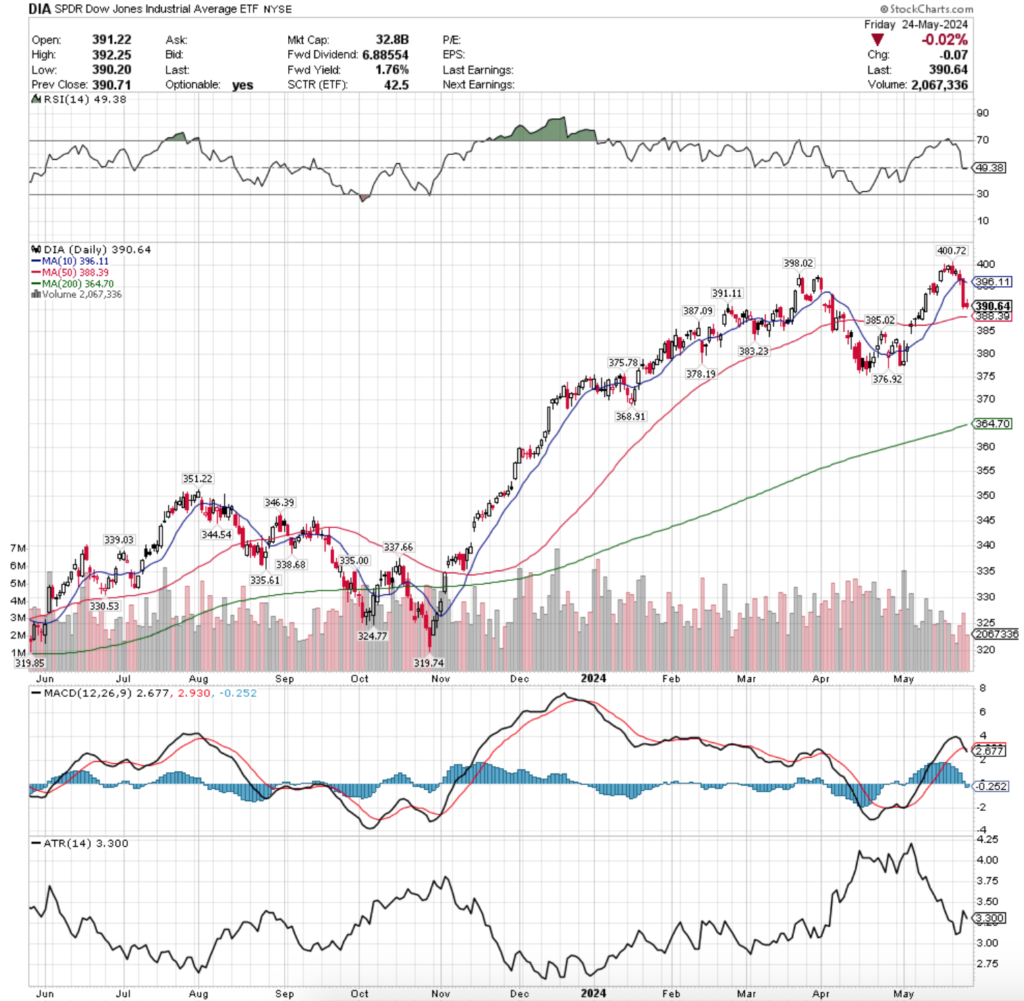
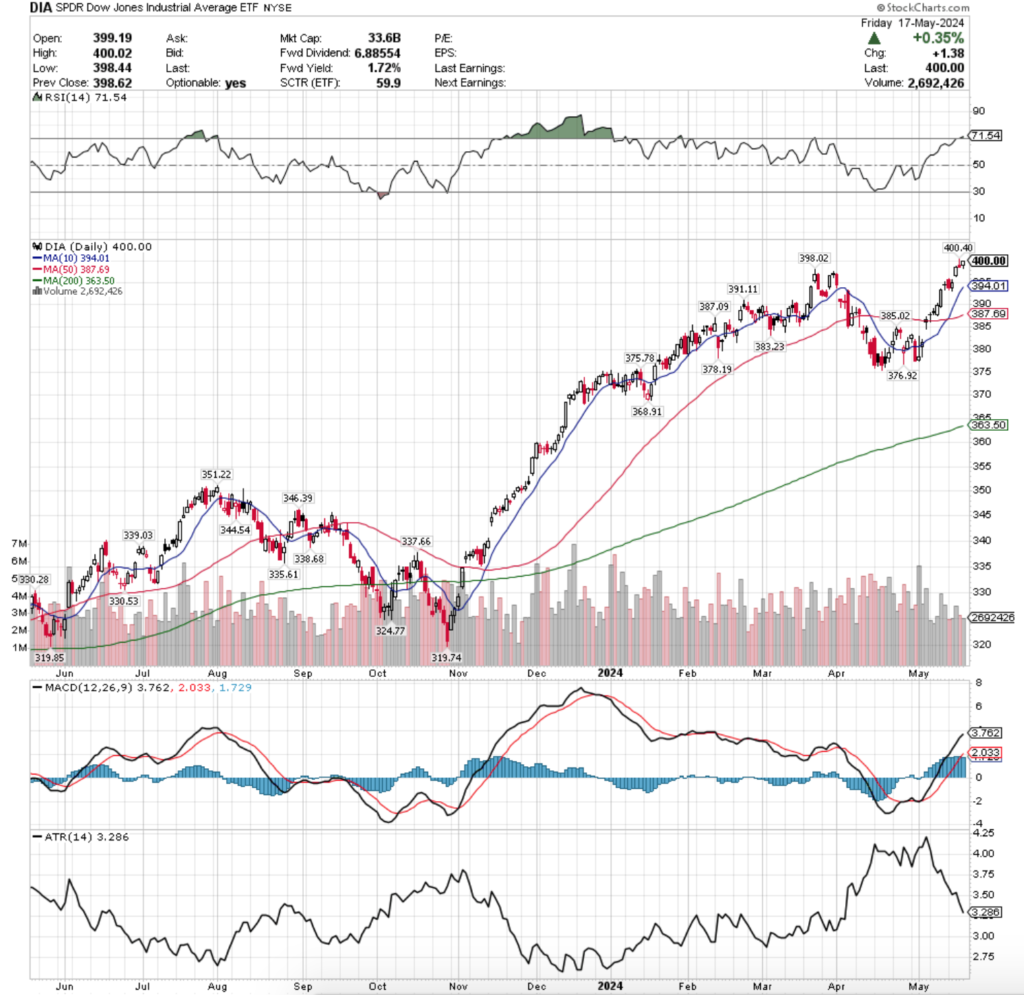
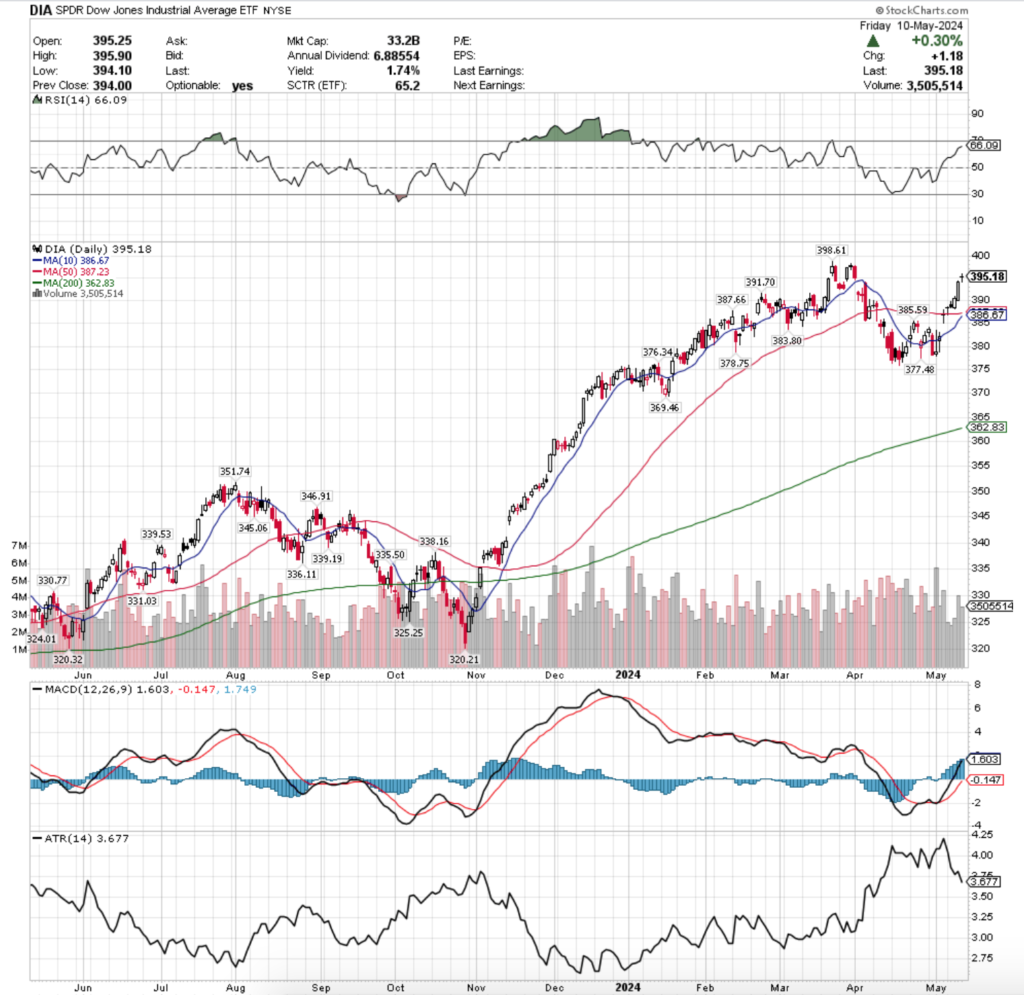
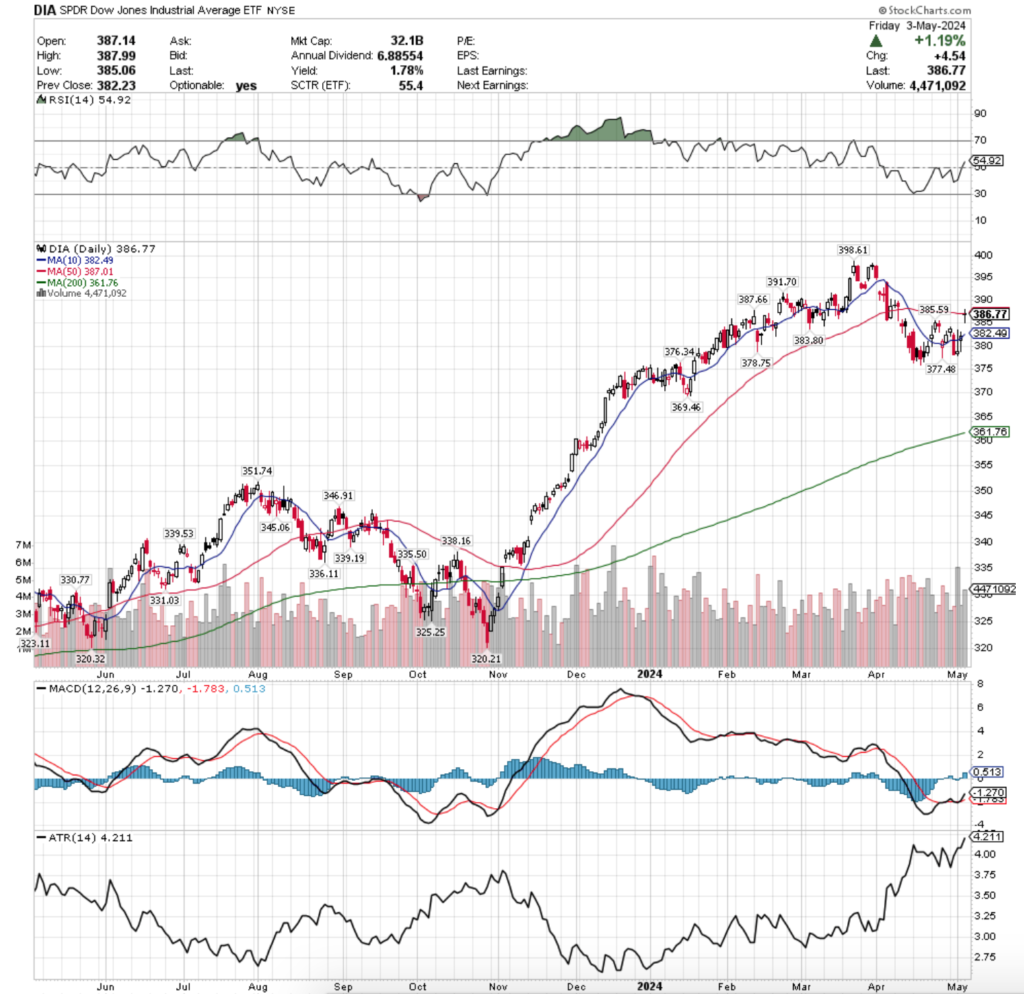
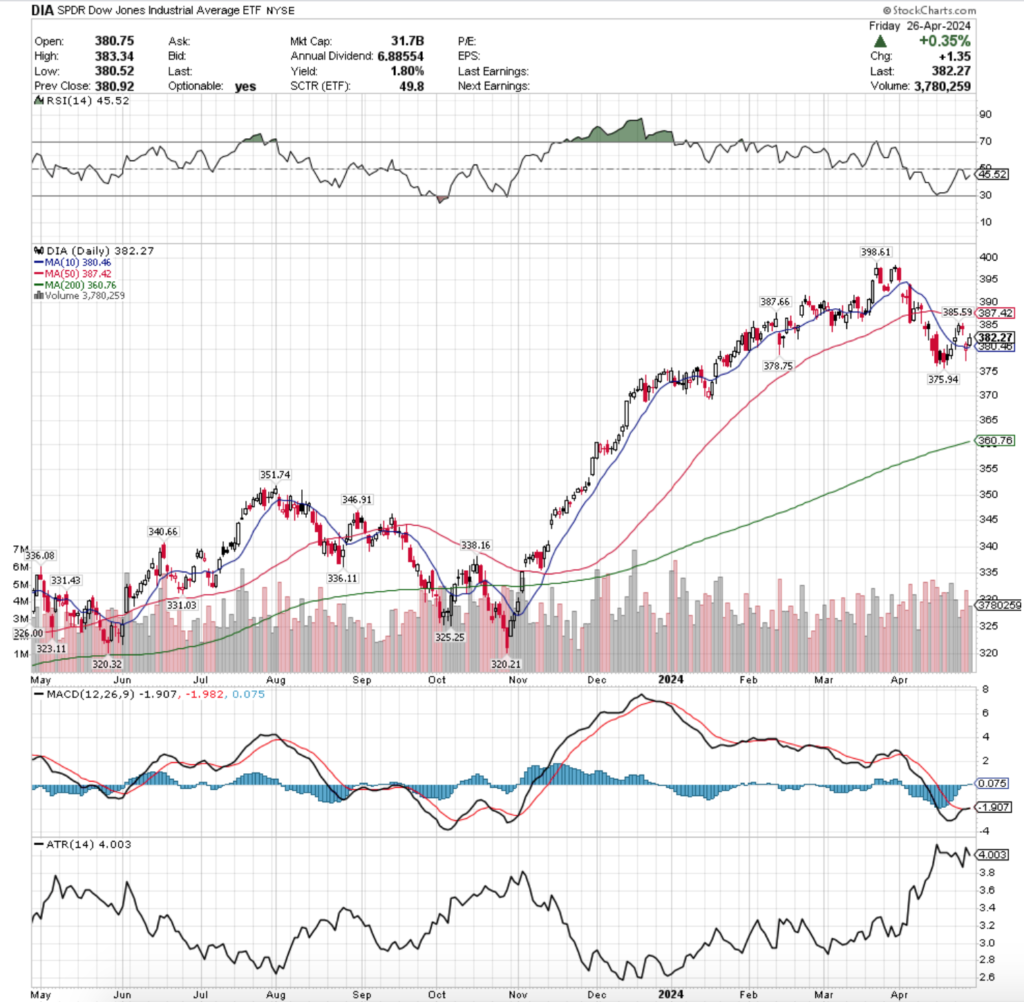
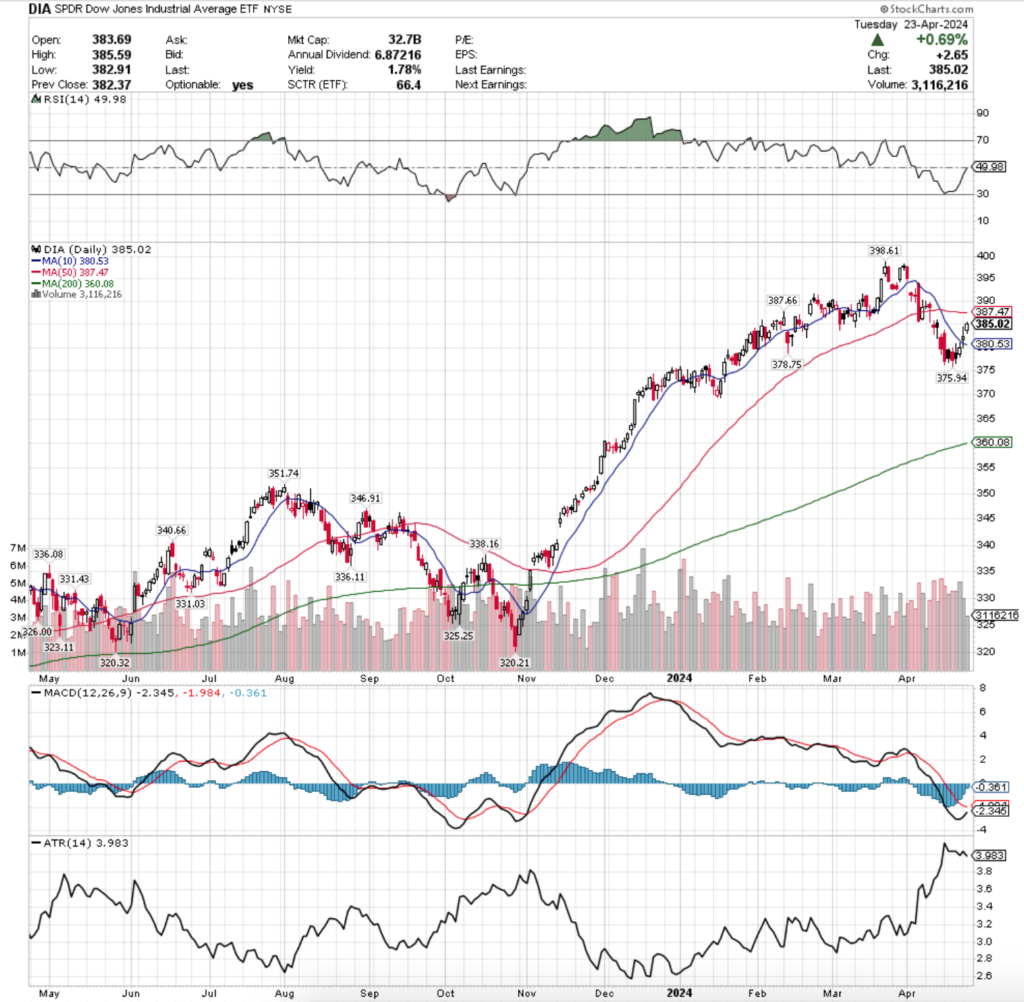
DIA, the SPDR Dow Jones Industrial Average ETF advanced +1.49% last week, having the strongest week of the major four index ETFs despite the continued low volume woes.
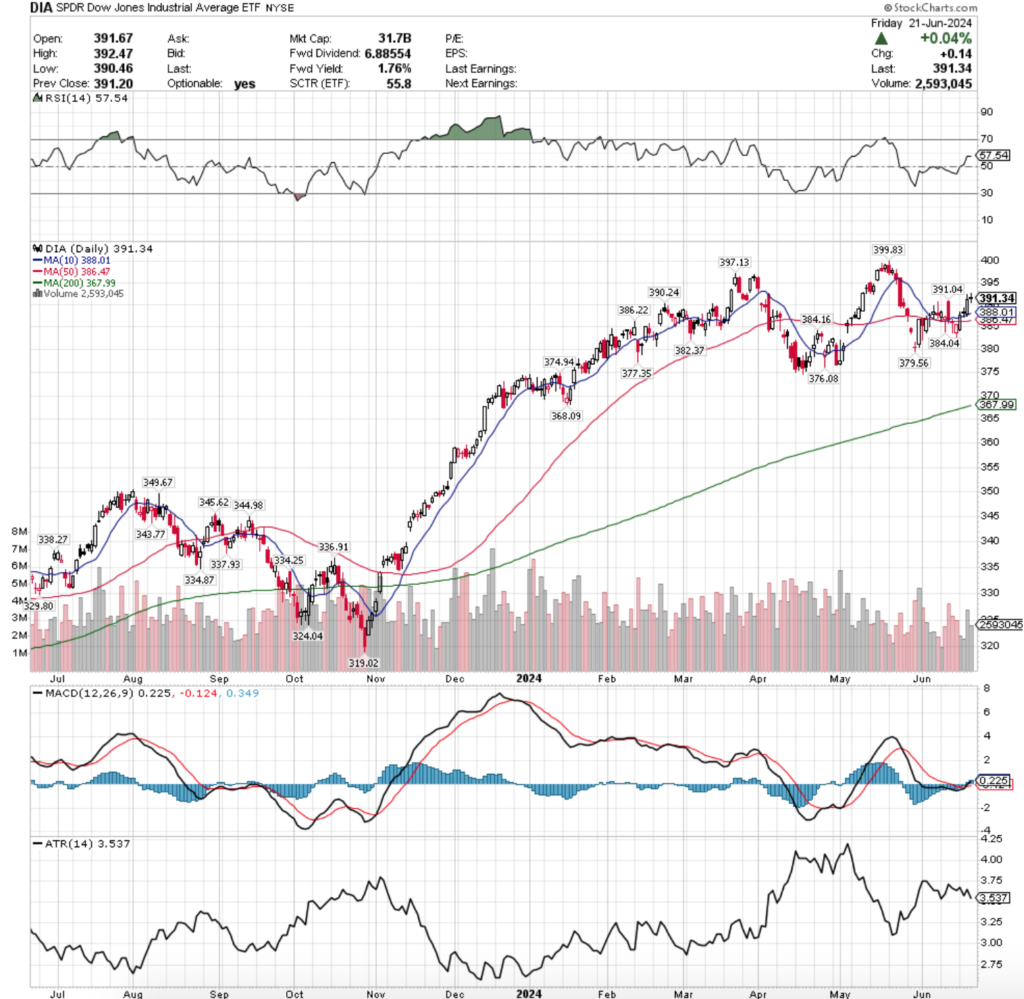
Their RSI is just above the neutral level at 57.54 & has flattened, while their MACD is bullish, but muted.
Volumes were -28.11% lower than the previous year’s average last week (2,513,525 vs. 3,496,240) as there was not a high rate of participation among investors.
DIA advanced during every session last week, beginning on Monday when a low volume day produced a wide-range candle, much like SPY, QQQ & IWM.
It should be noted that Monday’s session broke & stayed above both the 10 & 50 day moving averages.
Tuesday showed a bit of uncertainty as the session was also low volume & resulted in a doji, although it was able to remain above the support of the 10 DMA.
Thursday tested the 10 DMA’s support before rallying up for another wide-range candle on the highest volume of the week.
A key difference between Monday & Wednesday is the length of the candles’ shadows, as both the upper & lower shadow are larger on Thursday’s candle than Mondays.
This indicates that there is less conviction moving into these higher price levels & that neither the bulls nor the bears are completely in control & there is a bit of sentiment for prices to move in either direction at this level.
Friday confirmed this by resulting in a doji candle, indicating that there was a bit of indecision heading into the weekend.
This week will be interesting to see if they can continue higher towards the $397.13/share level, which would possibly set up a head & shoulders pattern in DIA.
In the event that they reach that high it will be beneficial to review where their RSI is at that time, as that will give insight into whether they make a run at their all-time high at $399.83 or if they’ll cool back off & consolidate.
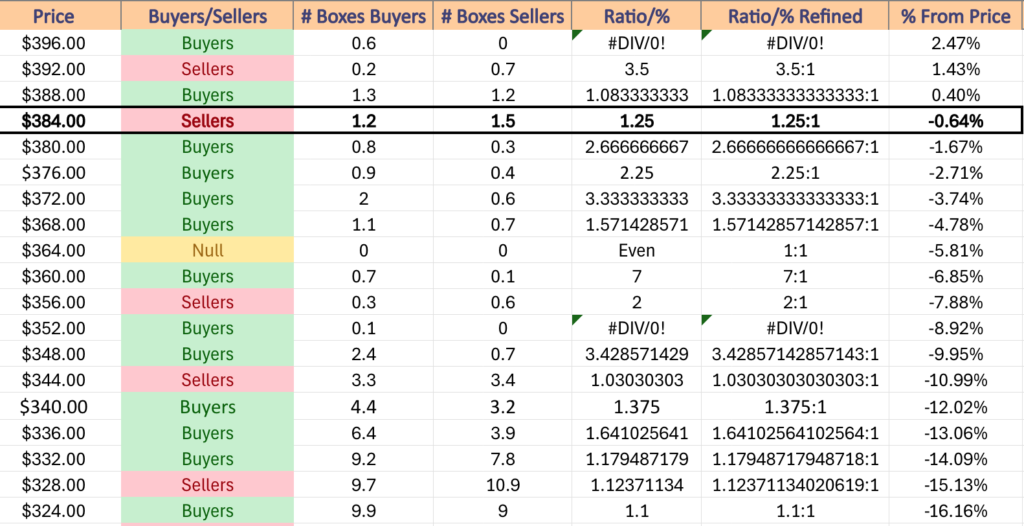
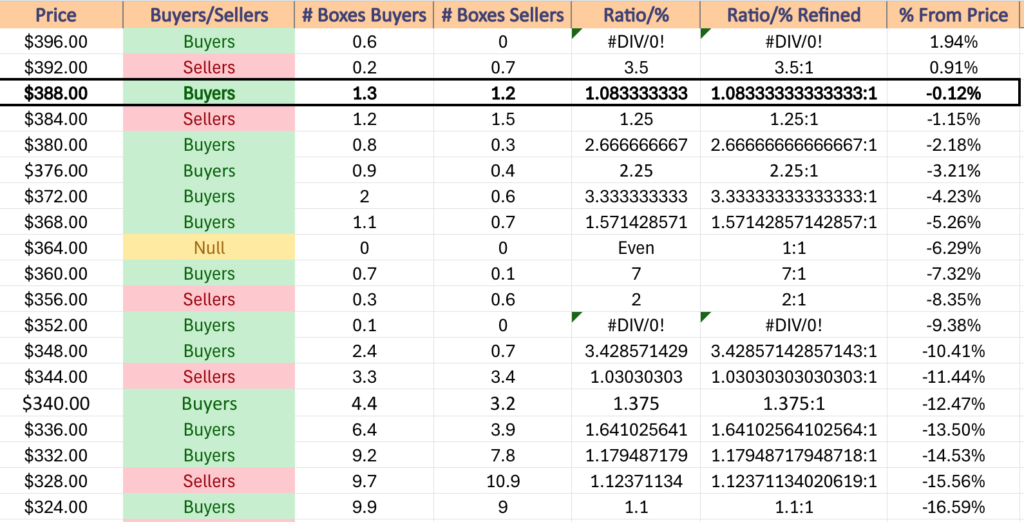
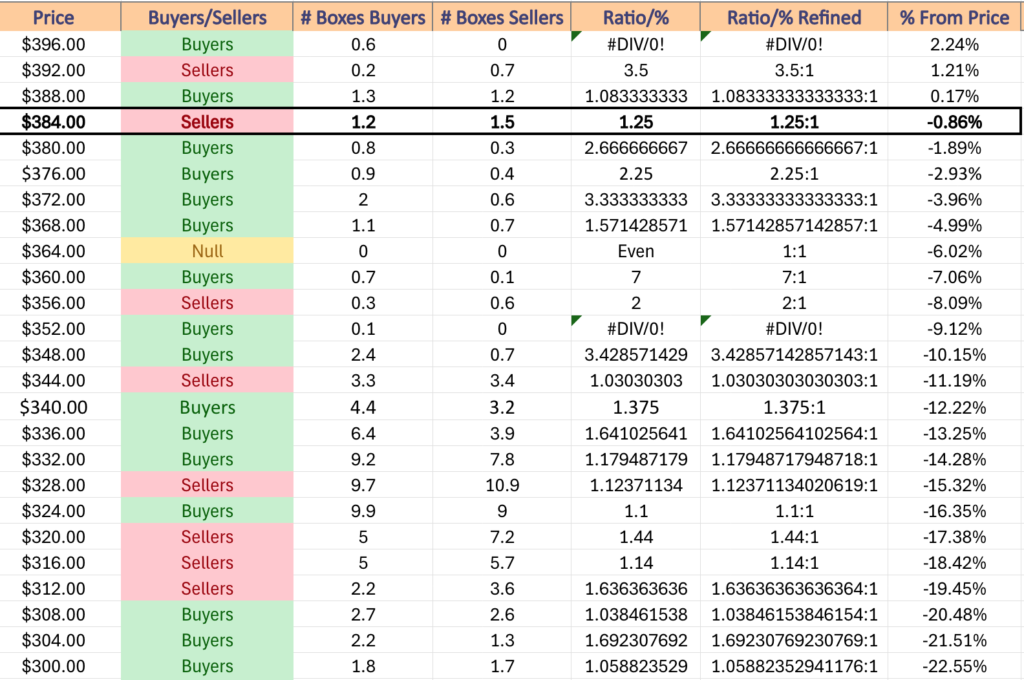
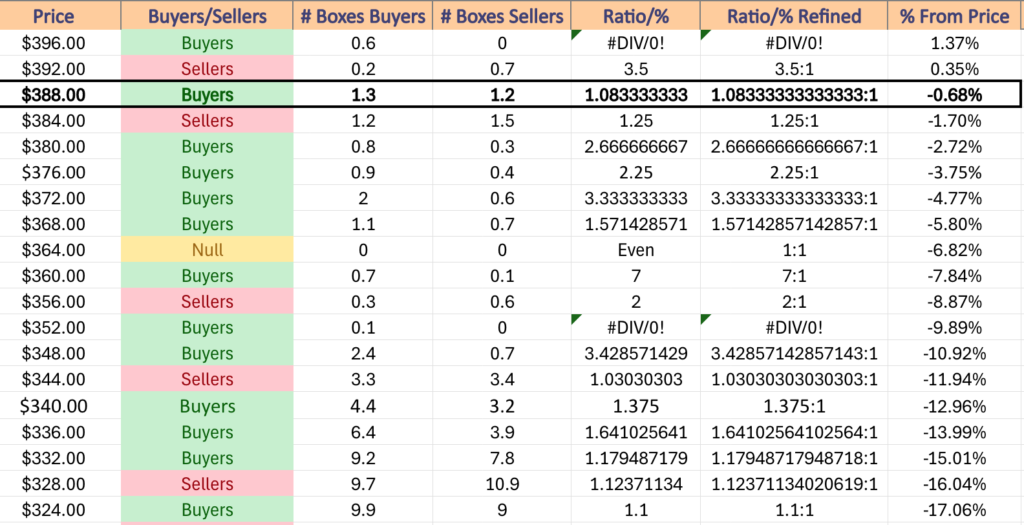
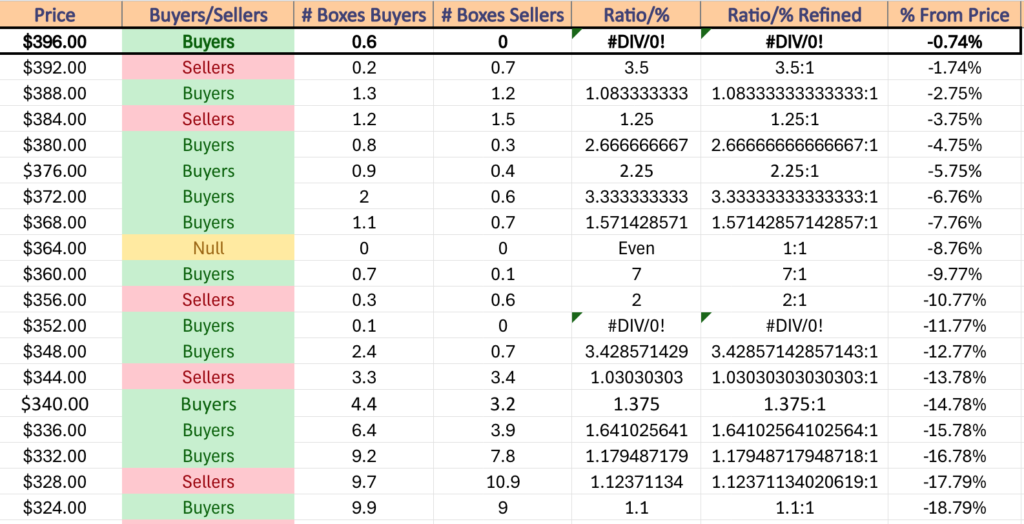
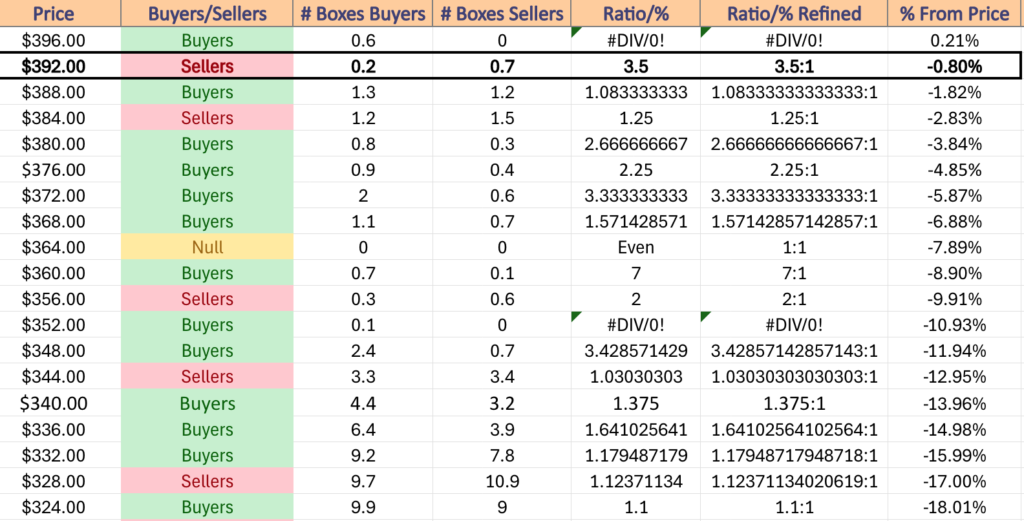
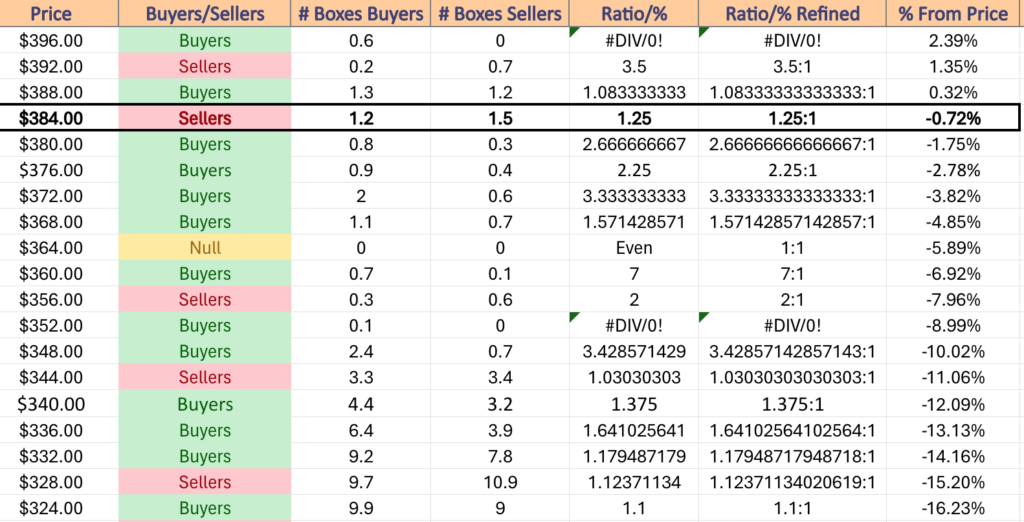
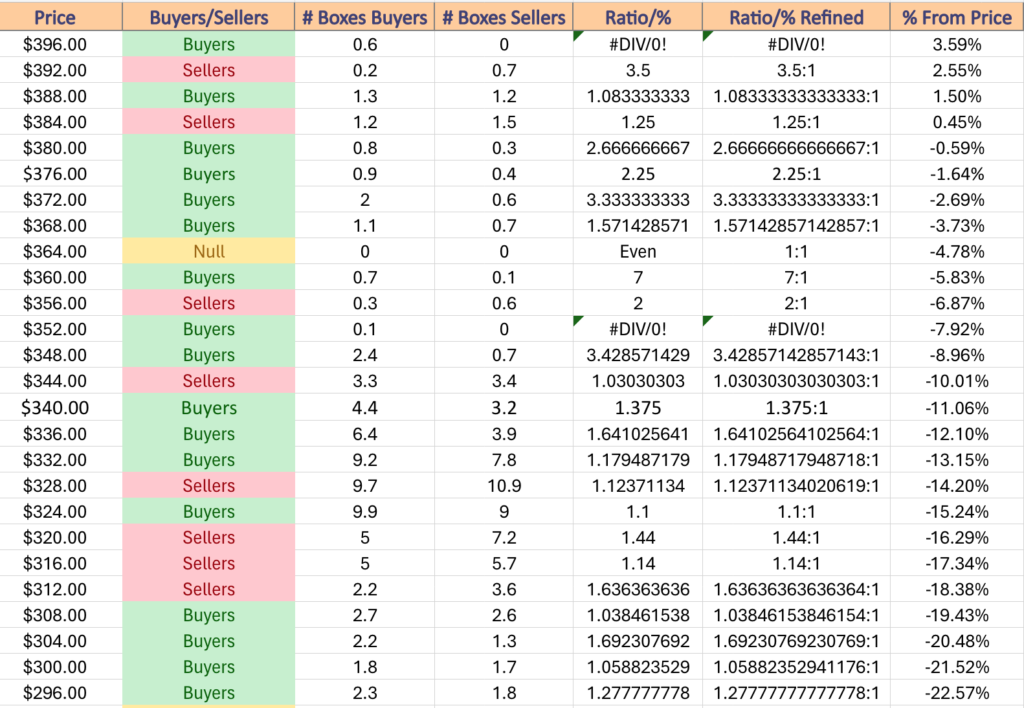
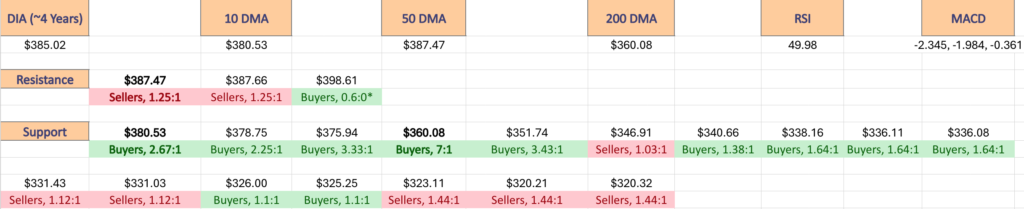
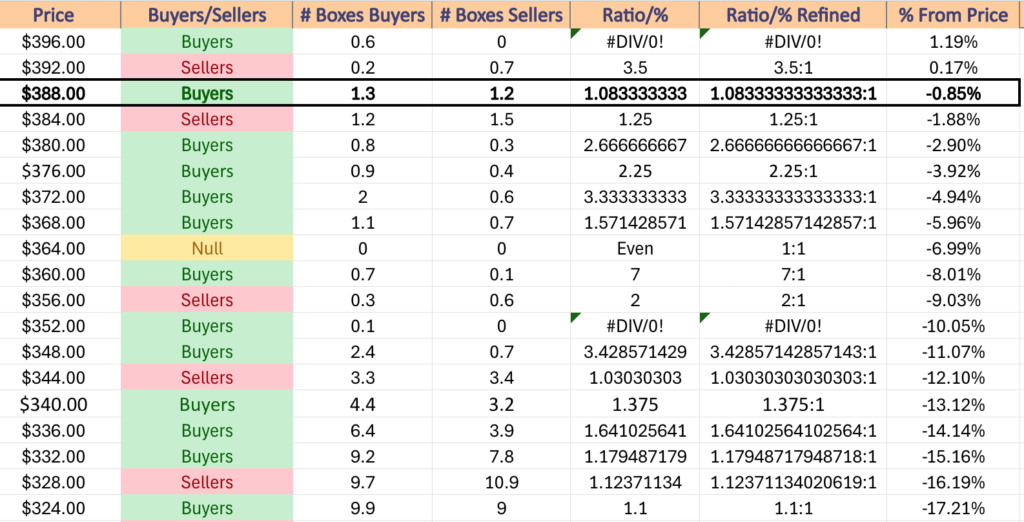
Otherwise, to the downside they do have a fair amount of support near-by & the 10 & 50 DMA’s strength of support will be key to watch.
DIA has support at the $391.04 (Volume Sentiment: Buyers, 1.08:1), $390.24 (Volume Sentiment: Buyers, 1.08:1), $388.01 (10 Day Moving Average, Volume Sentiment: Buyers, 1.08:1) & $386.47/share (50 Day Moving Average, Volume Sentiment: Sellers, 1.25:1) price levels, with resistance at the $397.13 (Volume Sentiment: NULL, 0:0*) & $399.83/share (All-Time High, Volume Sentiment: NULL, 0:0*) price level.
The Week Ahead
Monday the week kicks off with Fed Governor Waller speaking in Rome at 3 am, followed by San Francisco Fed President Daly speaking at 2pm.
There are no noteworthy earnings reports scheduled for Monday.
Fed Governor Bowman speaks at 7am Tuesday morning in London, followed by S&P Case-Schiller Home Price Index (20 Cities) data at 9 am, Consumer Confidence at 10 am & Fed Governor Cook speaking at 12 pm.
Tuesday morning TD Synnex is scheduled to report earnings, with Fed Ex, Progress Software & Worthington Enterprises due to report after the session’s close.
Wednesday morning at 10 am New Home Sales data is released.
General Mills, Paychex & UniFirst report earnings before Wednesday’s opening bell, with Micron Technology, AeroVironment, Concentrix, H.B. Fuller, Levi Strauss, MillerKnoll & Worthington Steel all scheduled to report after the session’s close.
Initial Jobless Claims, GDP (second revision), Durable-Goods Orders & Durable-Goods minus Transportation data are released Thursday at 8:30 am, with Pending Home Sales data after them at 10 am.
Acuity Brands, Apogee Enterprises, Lindsay, McCormick & Company, Simply Good Foods & Walgreens Boot Alliance all report earnings before the opening bell on Thursday, with Nike & Accolade due to report after the session’s closing bell.
Friday is the busiest day of the week on the data front, beginning with Richmond Fed President Barkin speaking at 6 am, Personal Income (nominal), Personal Spending (nominal), PCE Index, PCE Year-over-Year, Core PCE Index & Core PCE Index Year-over-Year at 8:30 am, Chicago Business Barometer (PMI) at 9:45 am, Consumer Sentiment (final) at 10 am & Fed Governor Bowman speaking at 12 pm.
There are no major earnings reports scheduled for Friday.
See you back here next week!
*** I DO NOT OWN SHARES OR OPTIONS CONTRACT POSITIONS IN SPY, QQQ, IWM OR DIA AT THE TIME OF PUBLISHING THIS ARTICLE ***