Weekly Stock & ETF Market Review 9/1/2024

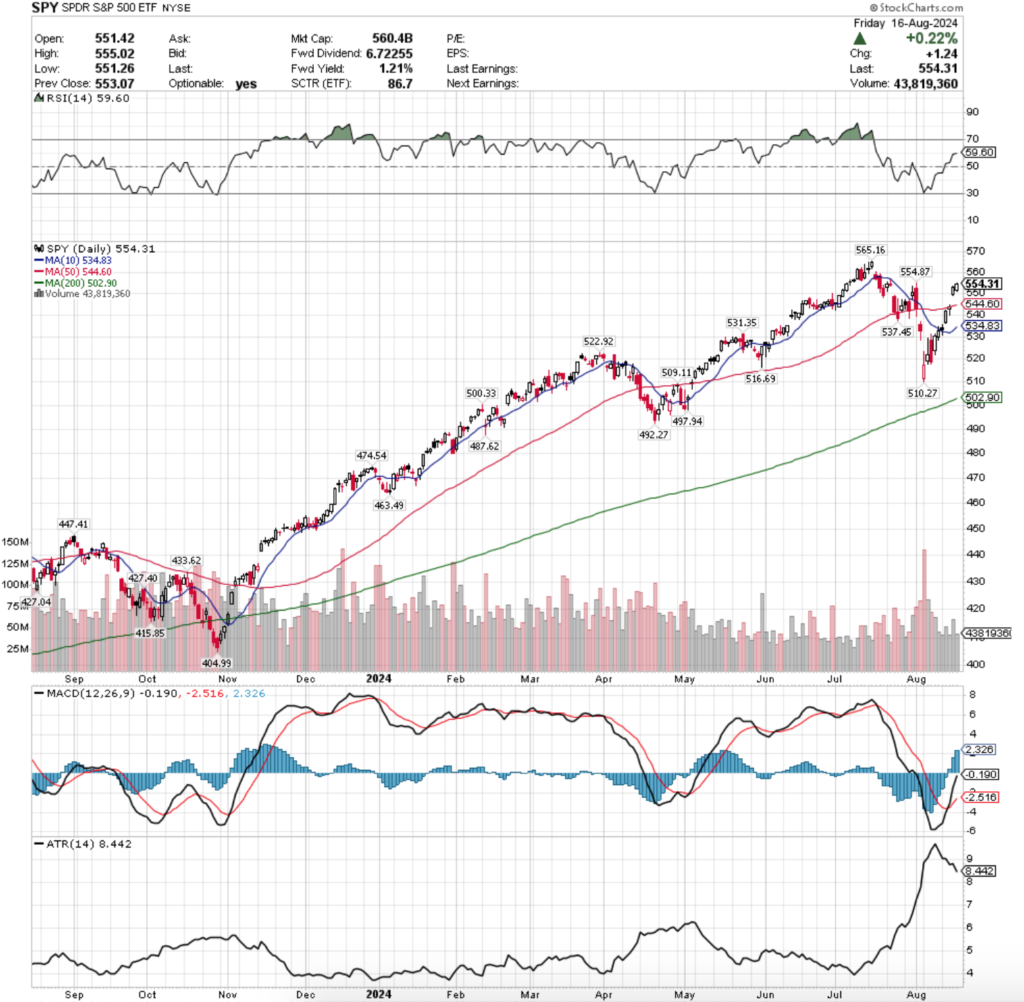
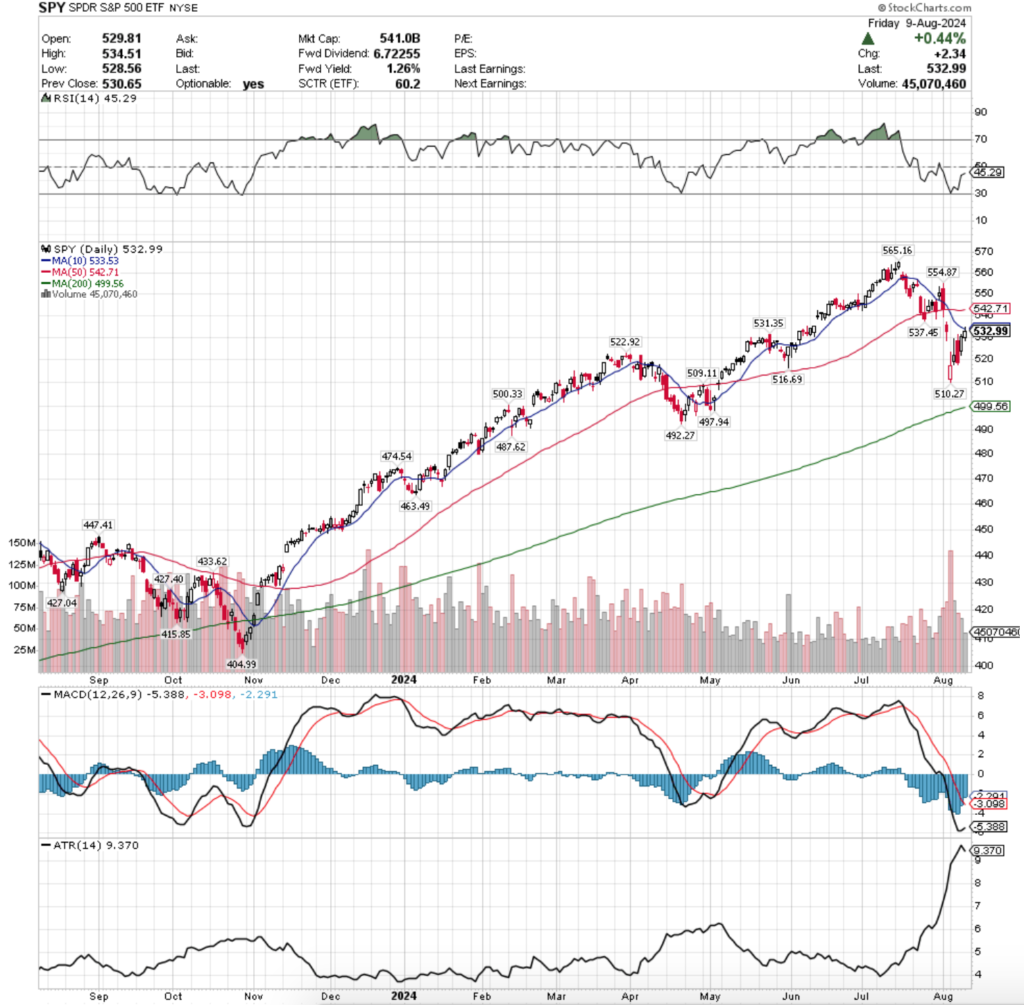
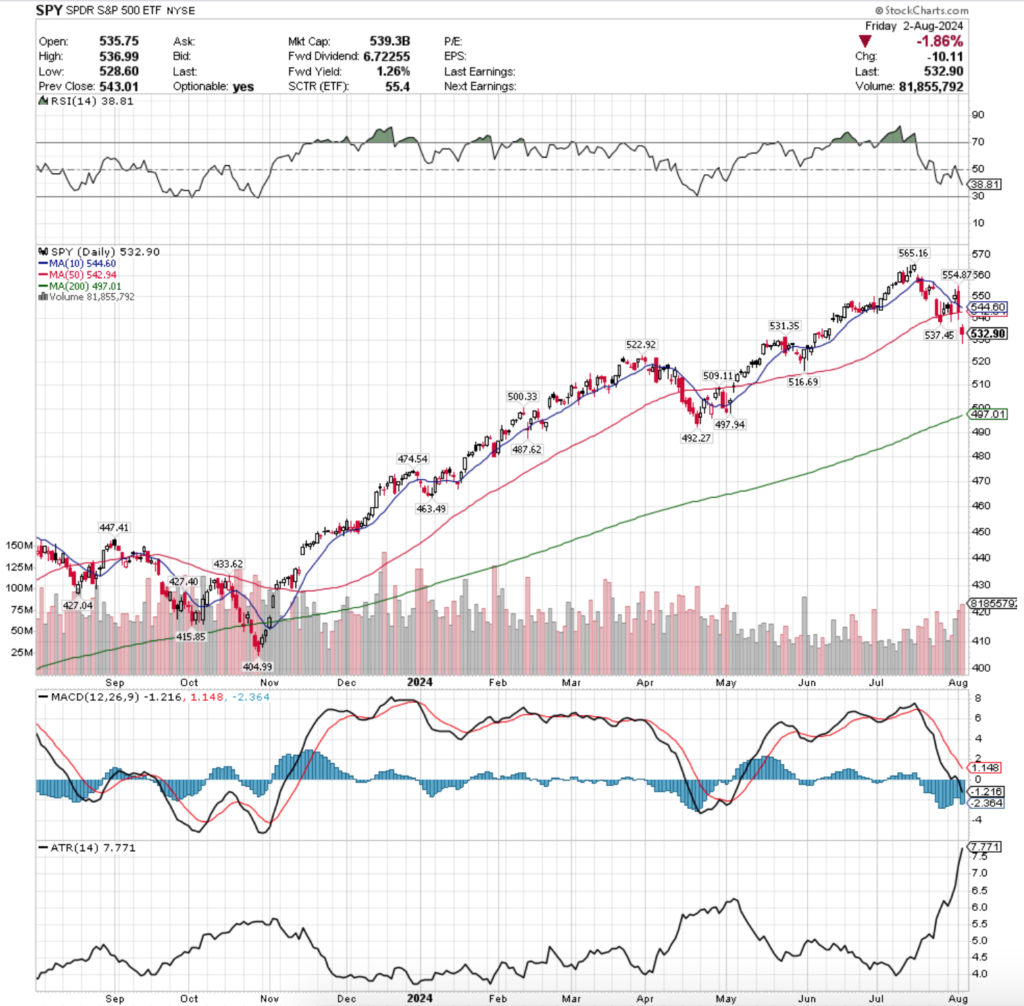
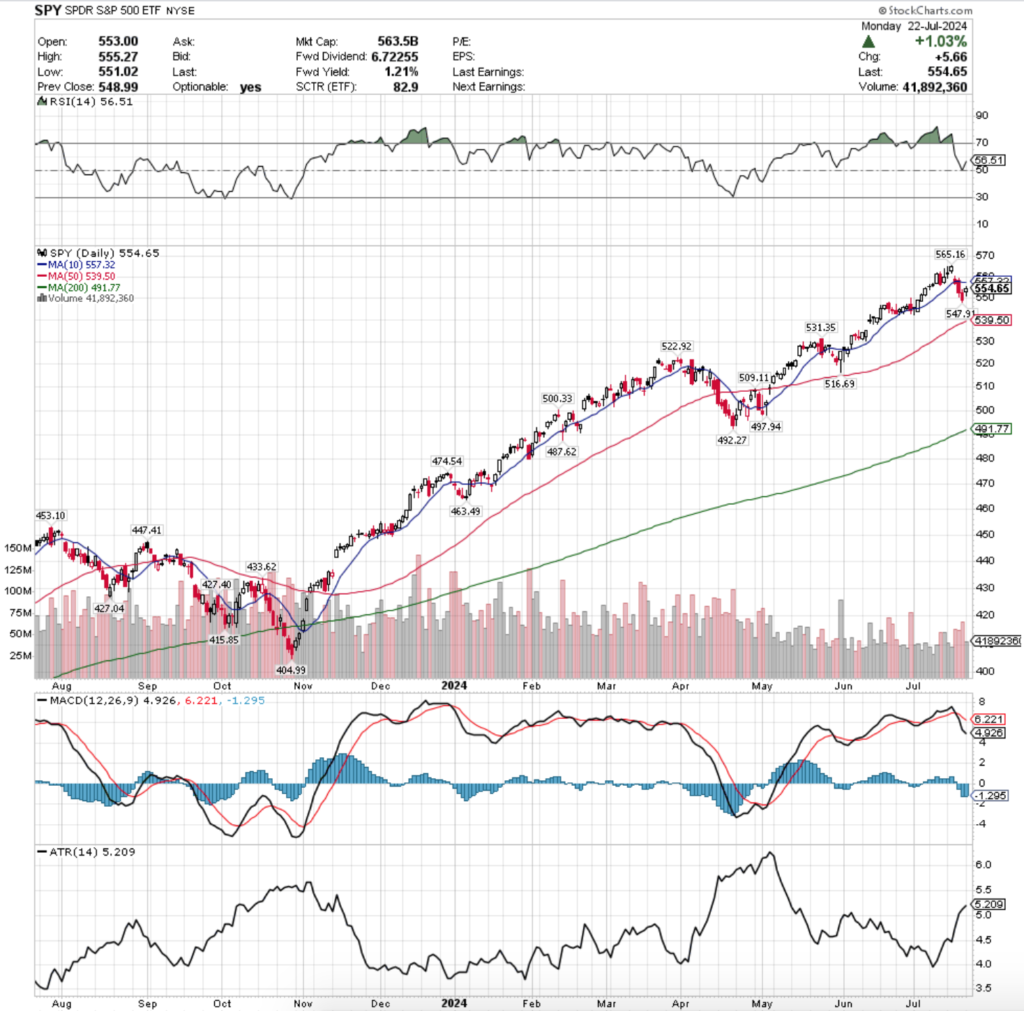
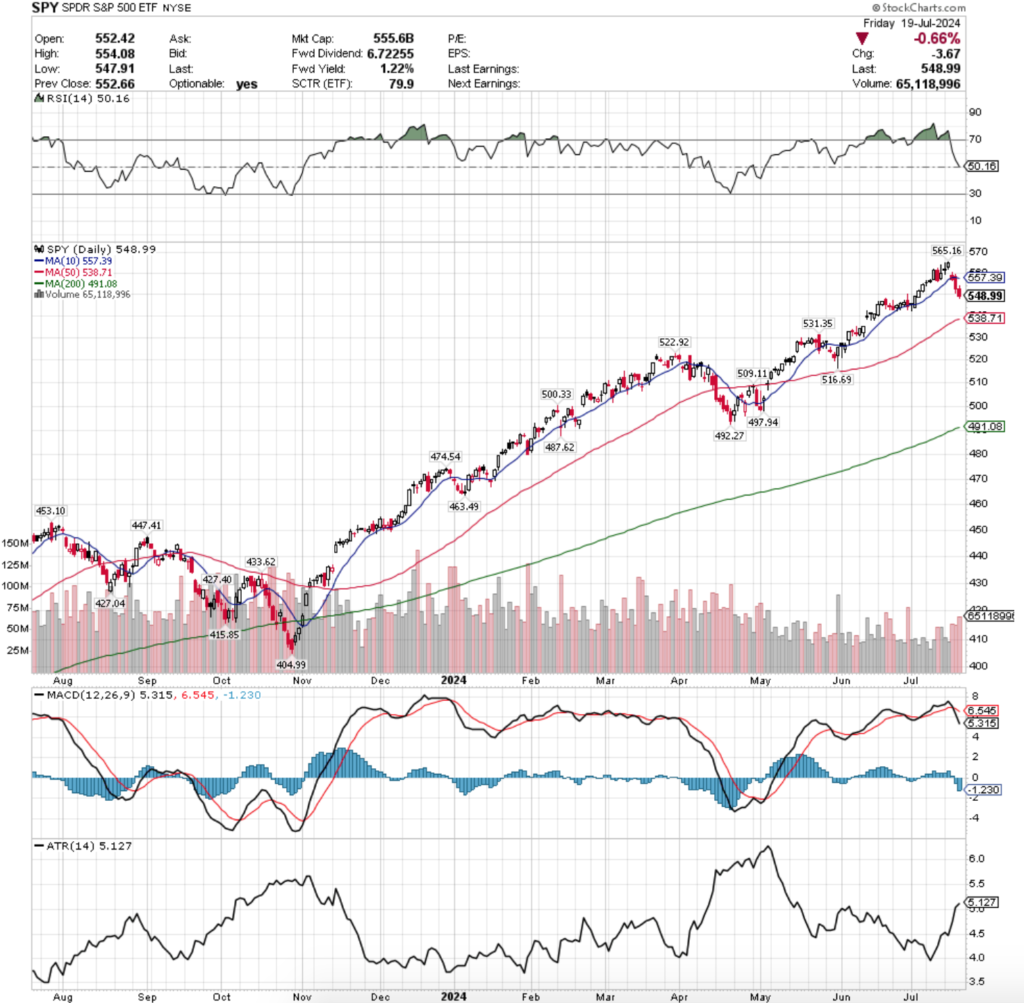
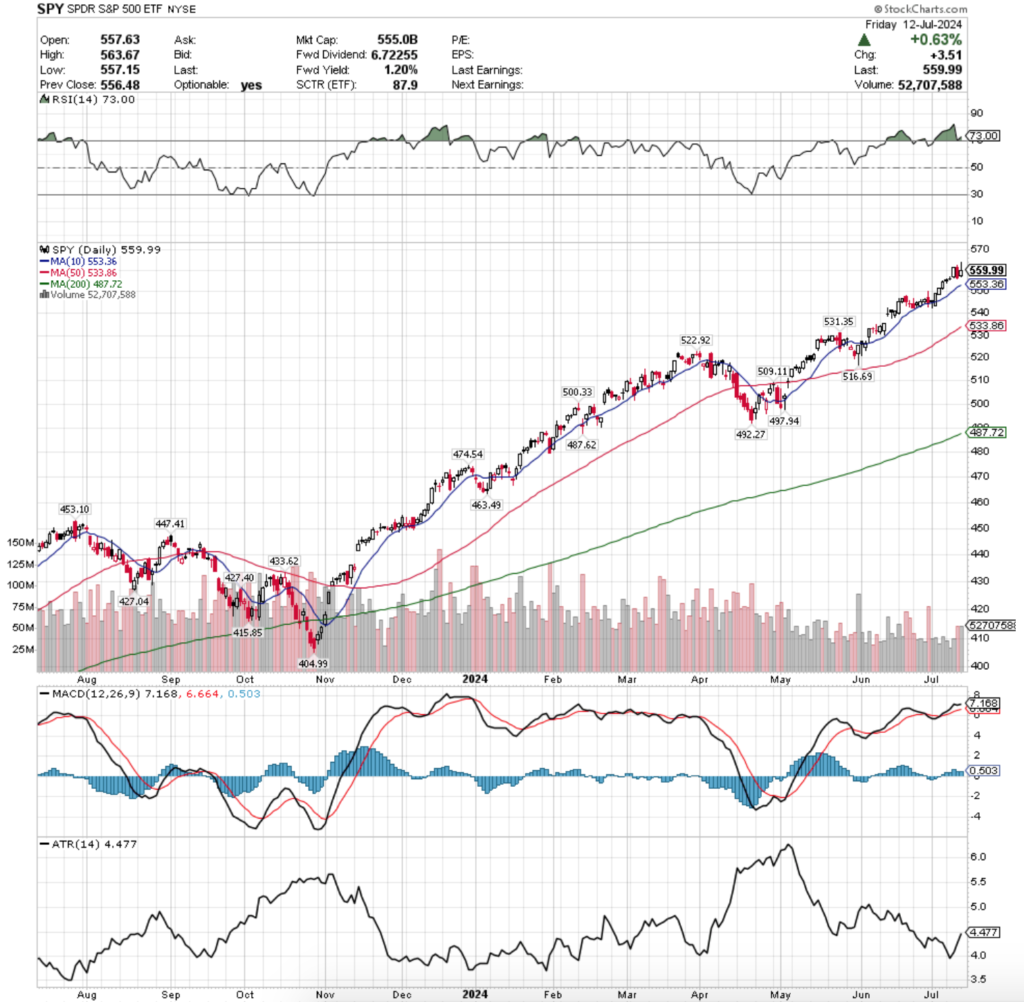
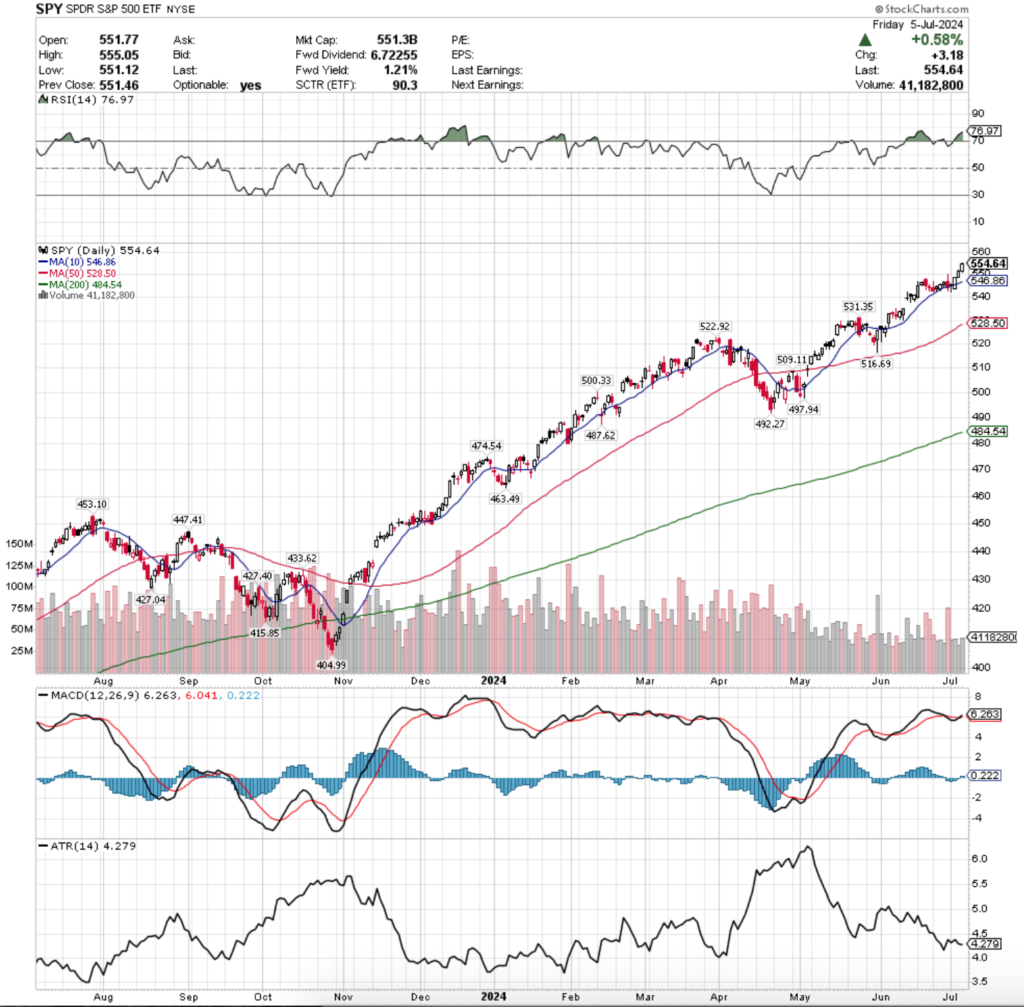
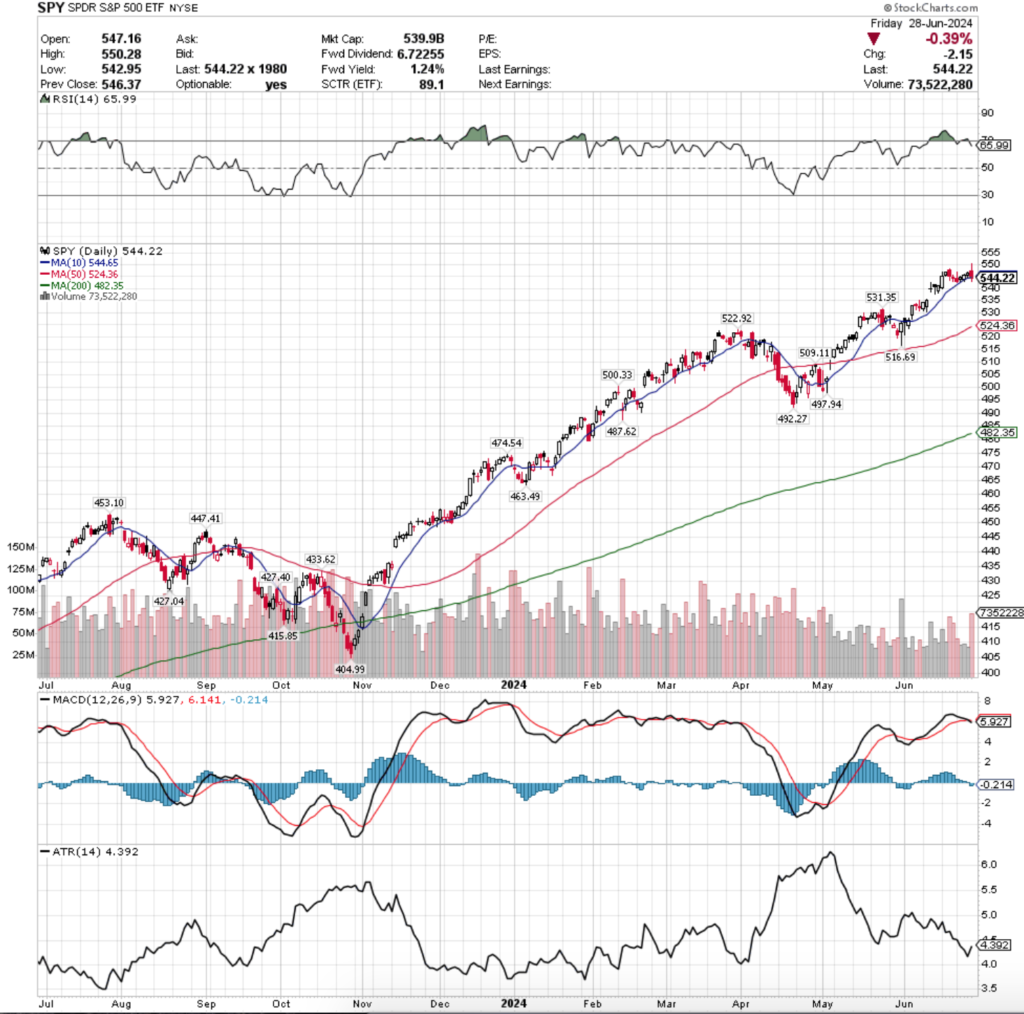
SPY, the SPDR S&P 500 ETF added +0.28% this past week, while the VIX closed the week at 15.00, indicating an implied one day move of +/-0.95% & an implied one month move of +/-4.34%.

SPY ETF - SPDR S&P 500 ETF's Technical Performance Over The Past Year
SPY ETF – SPDR S&P 500 ETF’s Technical Performance Over The Past Year

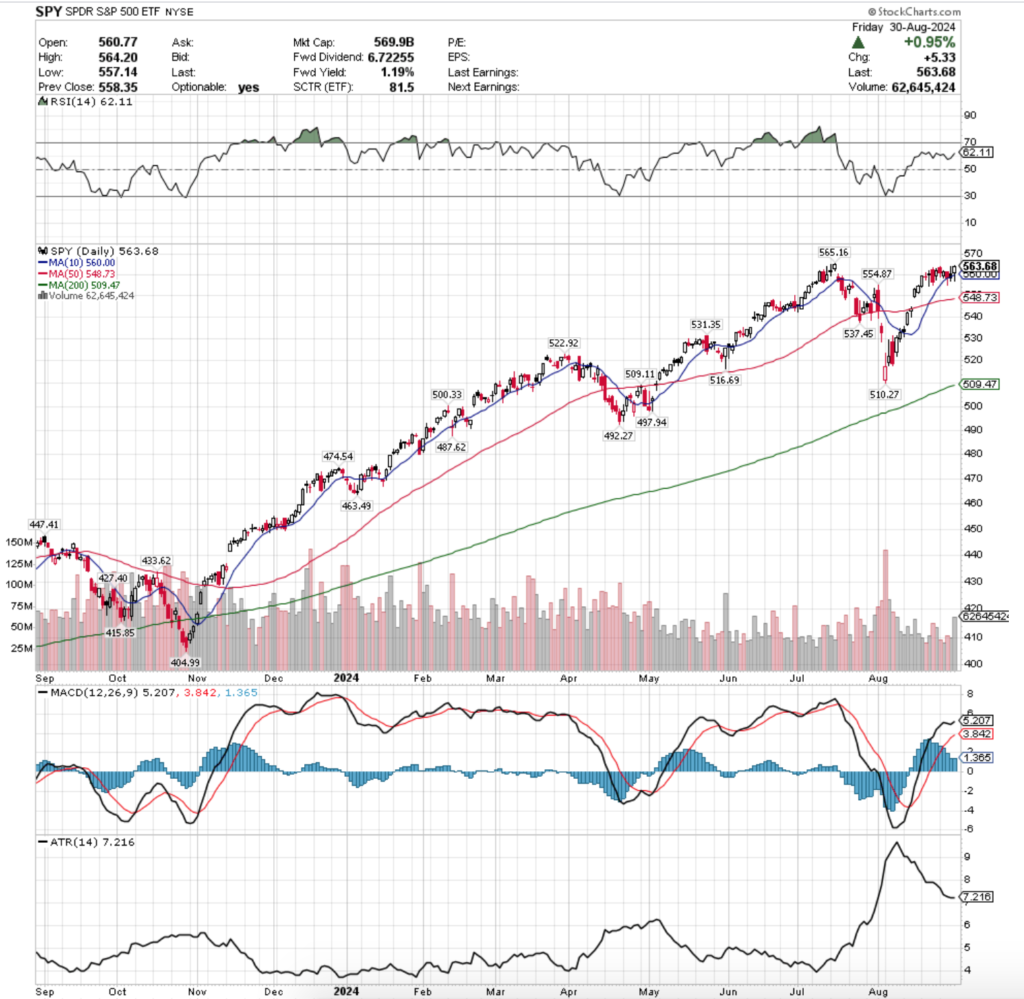
Their RSI is trending towards overbought conditions & sits at 62.11, while their MACD is bullish, but has been moving towards the signal line & its histogram is declining, indicating waning sentiment & an impending bearish crossover on the horizon.

Volumes were still weak, coming in -39.54% below the past year’s (diluted since May) average volume (41,456,061 vs. 68,568,837), as investors close out the summer months & brace for what looks set to be a more volatile September.

Monday started on as a declining day for SPY on low volume, before Tuesday recovered some of the losses but on very weak volume, indicating that there was still not much appetite for risk.

Wednesday is where the real cracks began to show for SPY, as the session resulted in a decline on the second highest volume of the week.

Recall that volume has been what we have been focusing on recently as it provides a measure of actual participation & sentiment behind the market’s movement & behavior.

When markets are off all-time highs & have limited support levels nearby the volume is going to be a great indicator of actual market sentiment.

The other warning sign that flashed on Wednesday was that while the market opened near Tuesday’s close, it tested below the support of the 10 day moving average during the day & closed in-line with it.

Given that the volume was second highest of the week, it became evident on Wednesday that we are entering another period of risk-off sentiment & what will likely become a time of heightened volatility.

Thursday continued this theme, as SPY opened at about the middle of Wednesday’s candle’s real body & tested higher, before collapsing, testing below the 10 DMA’s support again & closing lower than it opened, just beneath the 10 DMA.

Friday the bulls regained control though, although the day did test below the 10 DMA again, but at the end of the day a surge in volume compared to the rest of the week saw market participants squeeze prices higher as the day closed with a +0.95% advance.

Heading into the new week all eyes will be on the support of the 10 & 50 day moving averages for SPY, as well as its trading volume.

The consolidation range of the past couple of weeks has not shown much strength & with the low volumes that we are seeing it appears that we are due to a little break & some near-term declines.

While not all earnings disappointed, most companies have reported now leaving less chances for an upside catalyst in the near-term & the fact that neither Friday nor any day over the past month & a half have been able to reach SPY’s recent all-time high leaves little room for optimism.

Couple these points with the really low volumes we’ve been seeing & it begins to look even more bleak & less likely that we’ll find reason to begin trending upwards again in the near-term.

Given how spread out SPY’s support levels are up here, it’ll be wise to watch price in relation to the 50 DMA, as the support level is currently -2.56% (Friday’s closing levels) below their price.

While the spreads between the 10 & 50 DMA are not as narrow as they were in last September, there are certainly many similarities between what we are seeing in today’s market compared to just one year ago & it will be something to keep an eye on.

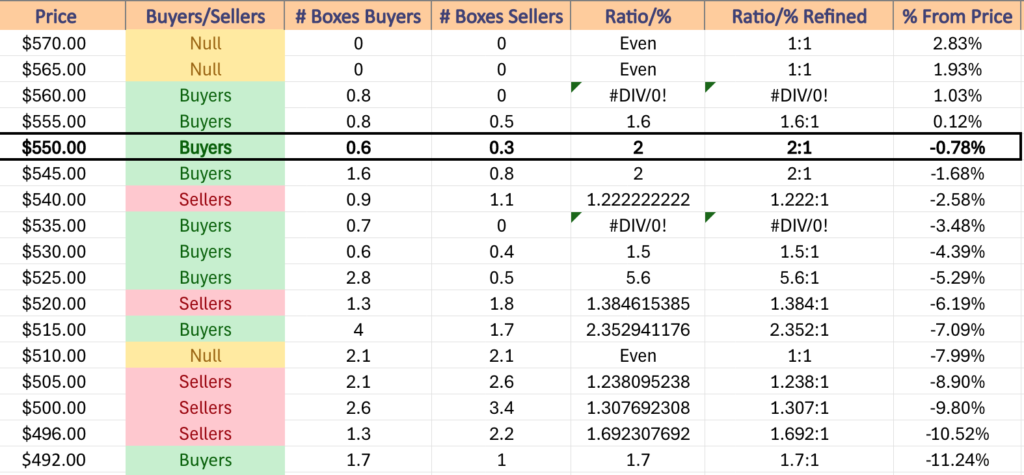
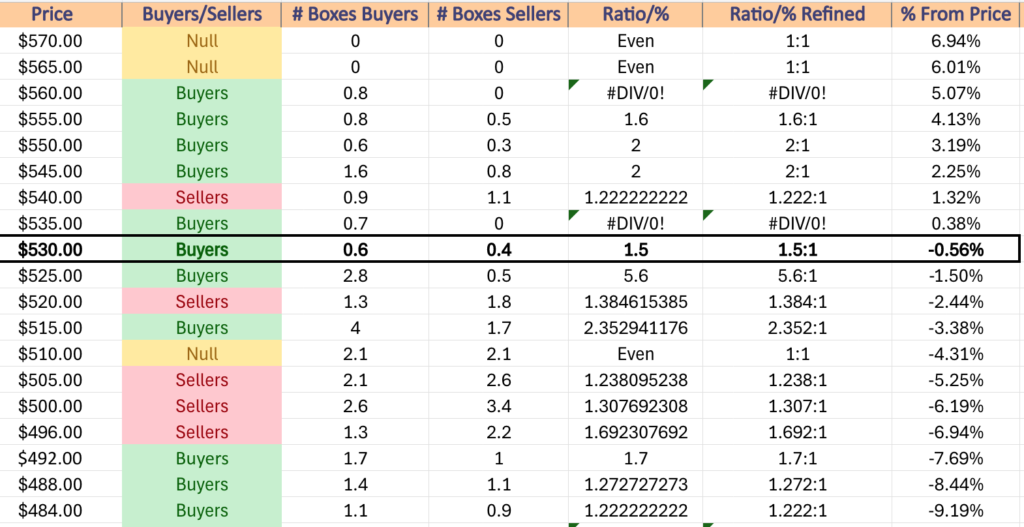
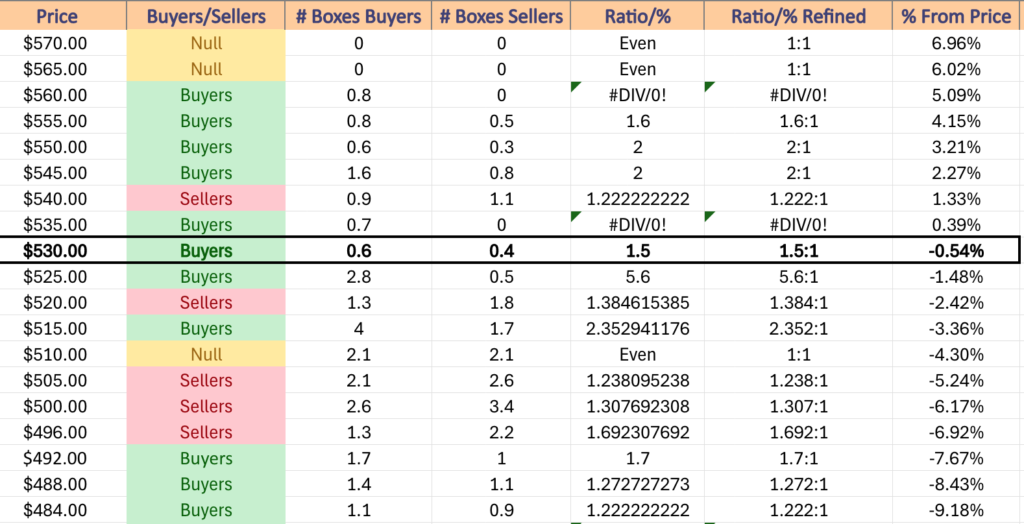
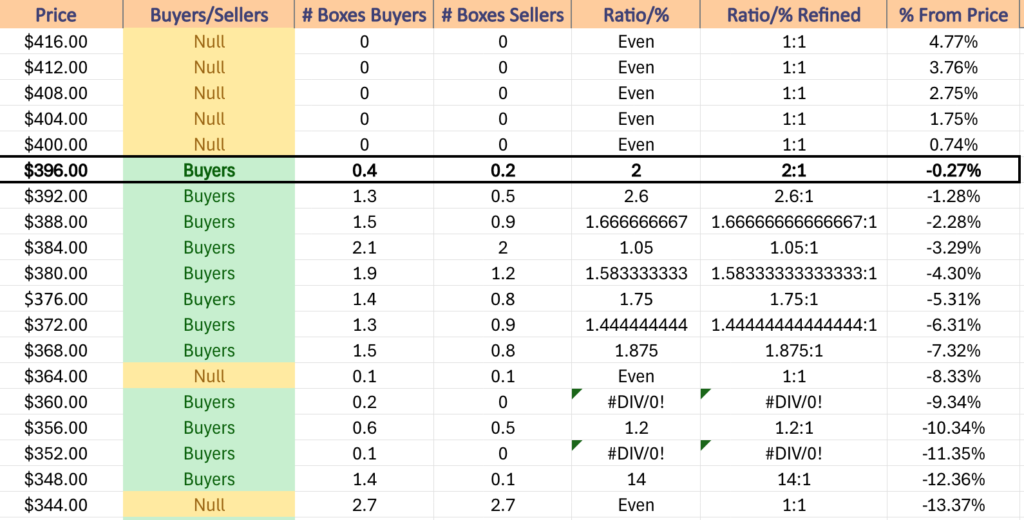
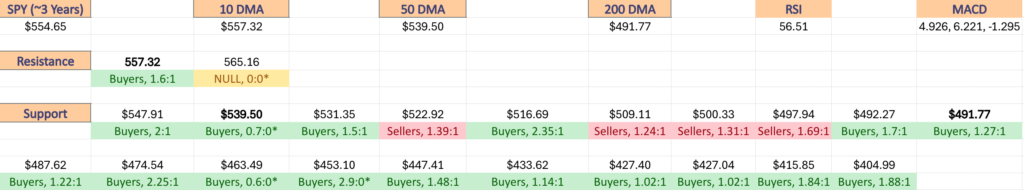
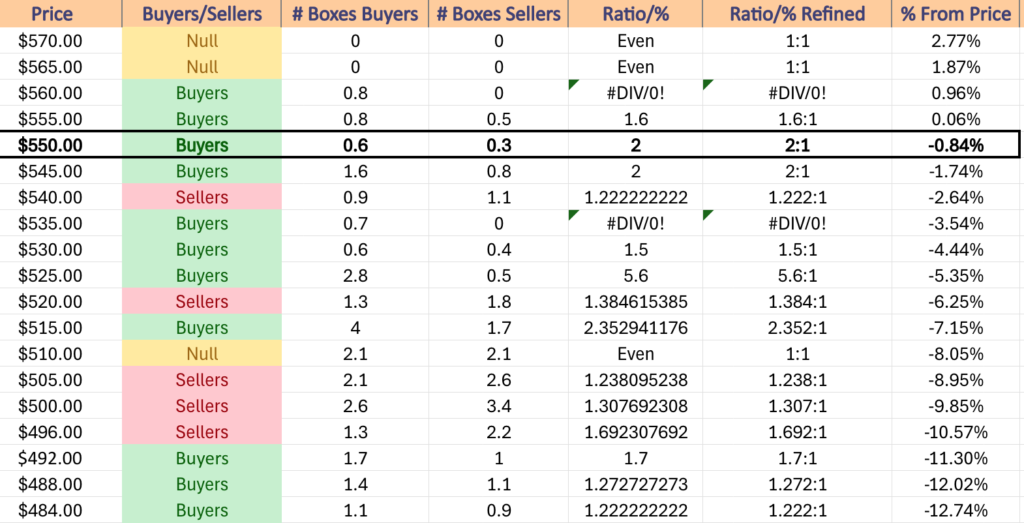
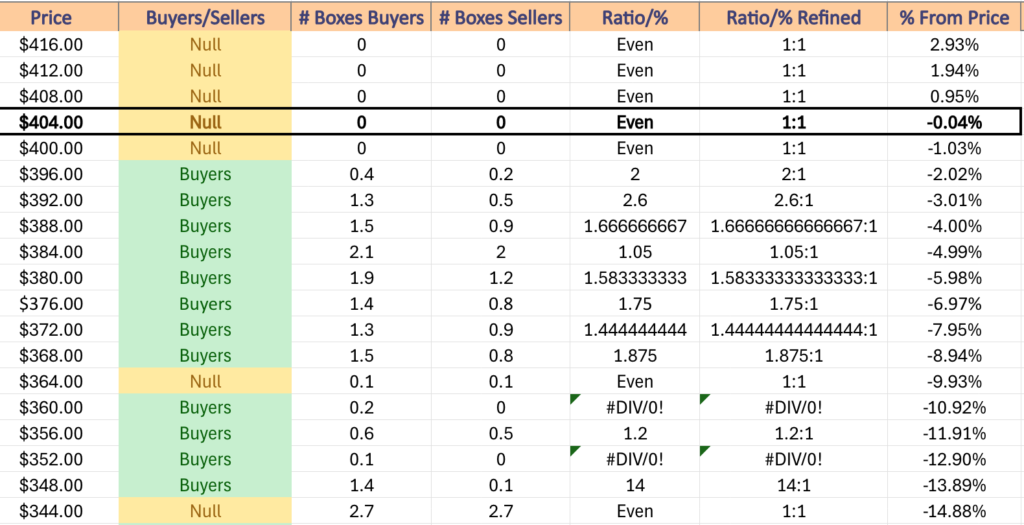
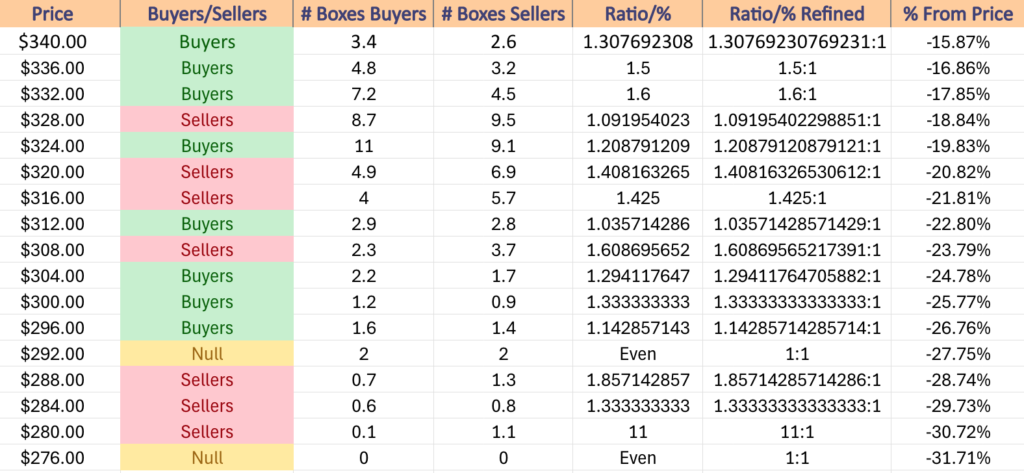
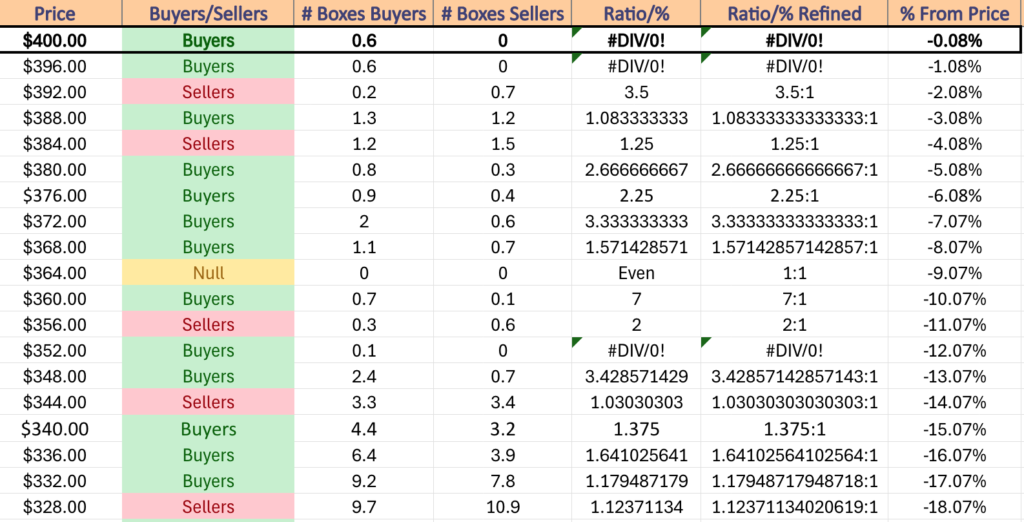
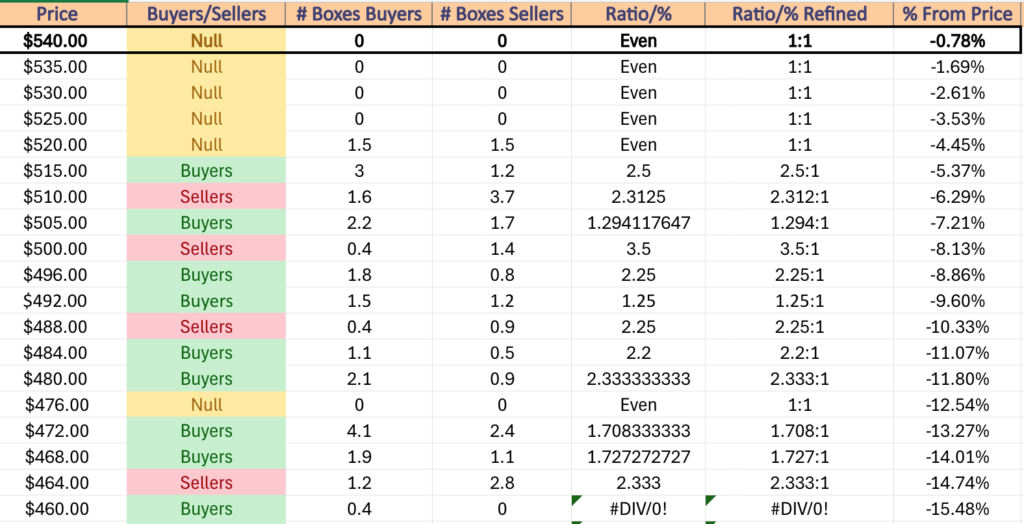
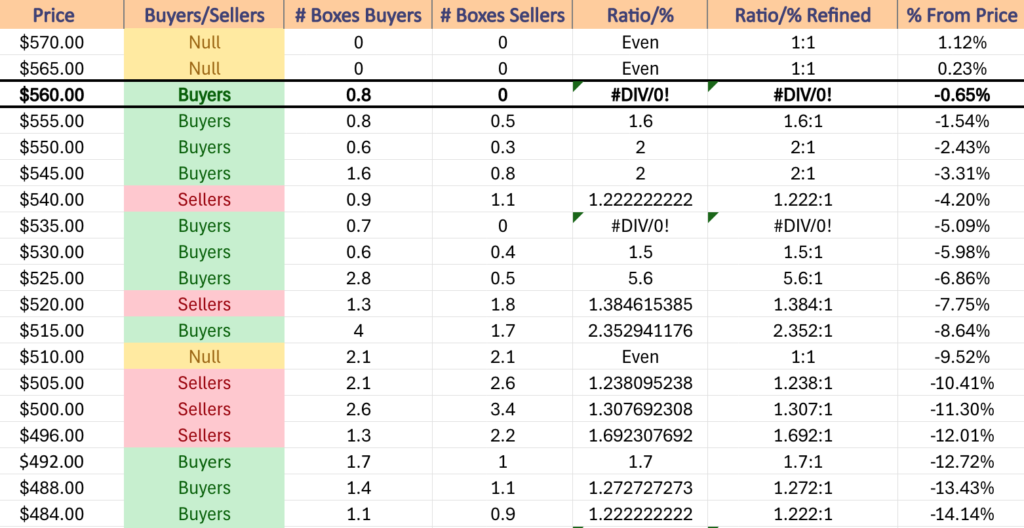
It is worth taking a look at the table below to assess the strength of their support levels, as the table displays the ratio of Buyers:Sellers (or Sellers:Buyers) at each price level SPY has traded at over the past 1-2 years & may shed light into how market participants will behave at these levels again.

SPY has support at the $560 (10 Day Moving Average, Volume Sentiment: Buyers, 0.8:0*), $554.87 (Volume Sentiment: Buyers, 2:1), $548.73 (50 Day Moving Average, Volume Sentiment: Buyers, 2:1) & $537.45/share (Volume Sentiment: Buyers, 0.7:0*) price levels, with resistance at the $565.16/share (All-Time High, Volume Sentiment: NULL, 0:0*) price level.

SPY ETF's Price Level:Volume Sentiment Over The Past 1-2 Years
SPY ETF’s Price Level:Volume Sentiment Over The Past 1-2 Years

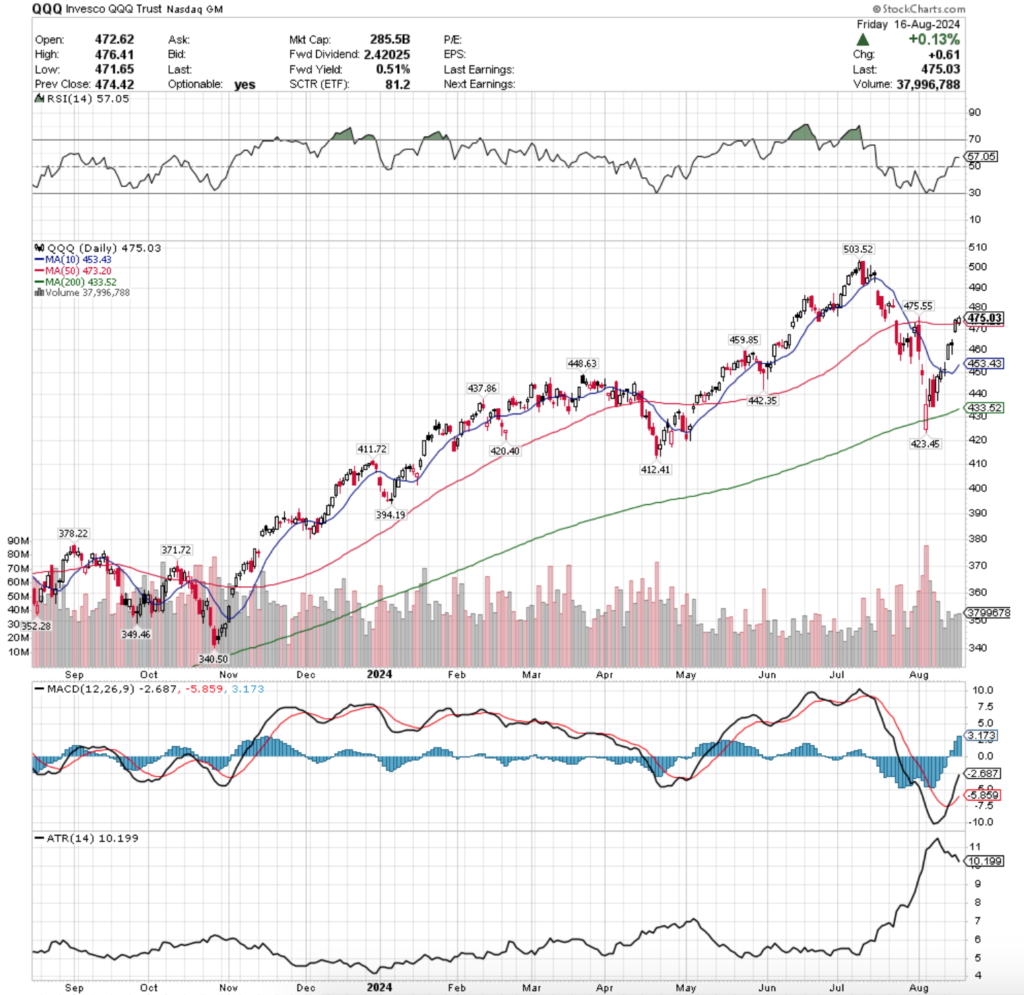
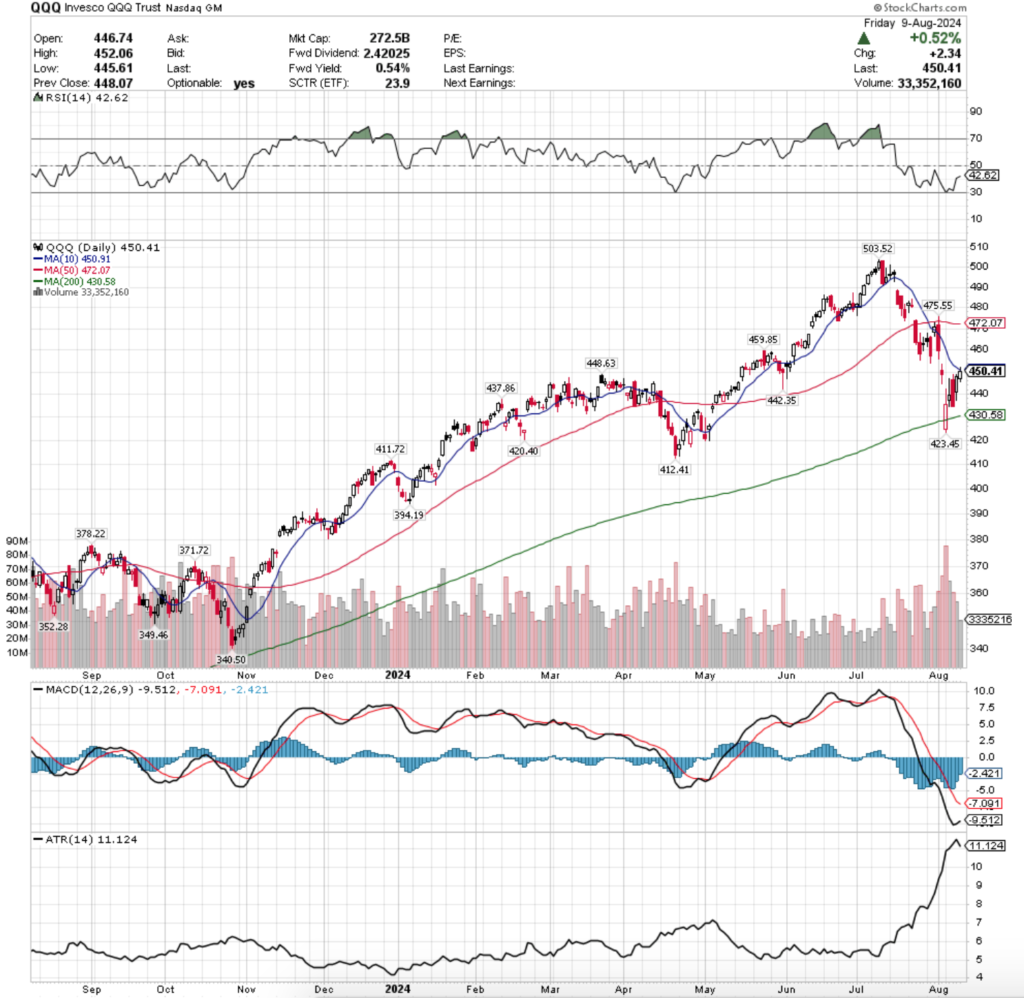
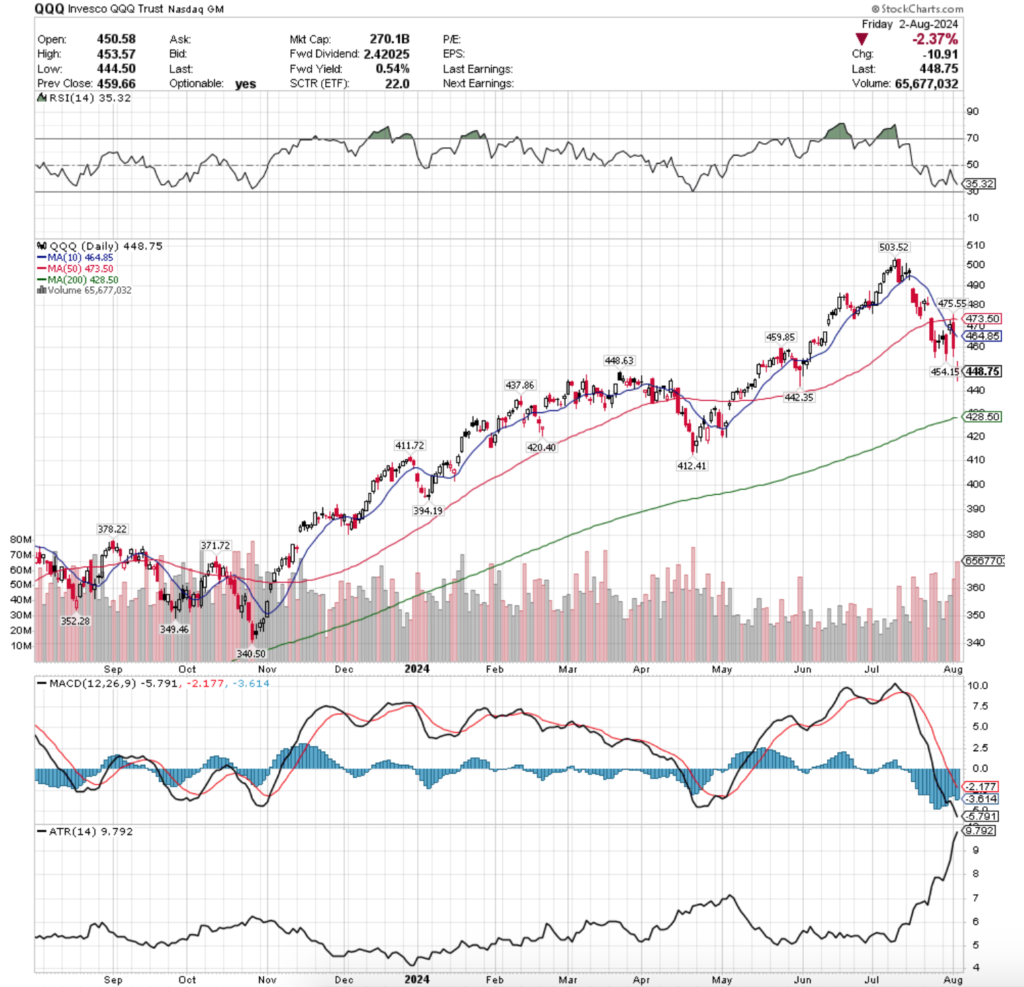
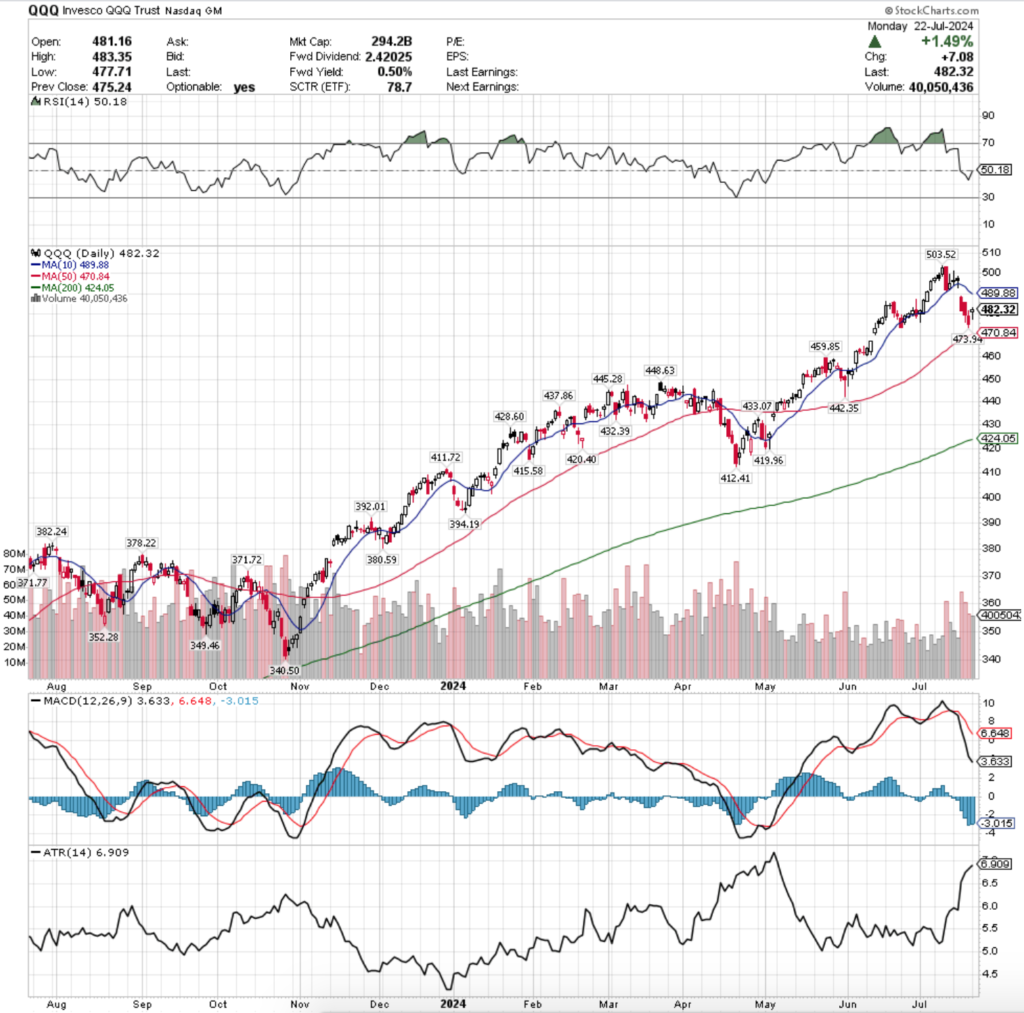
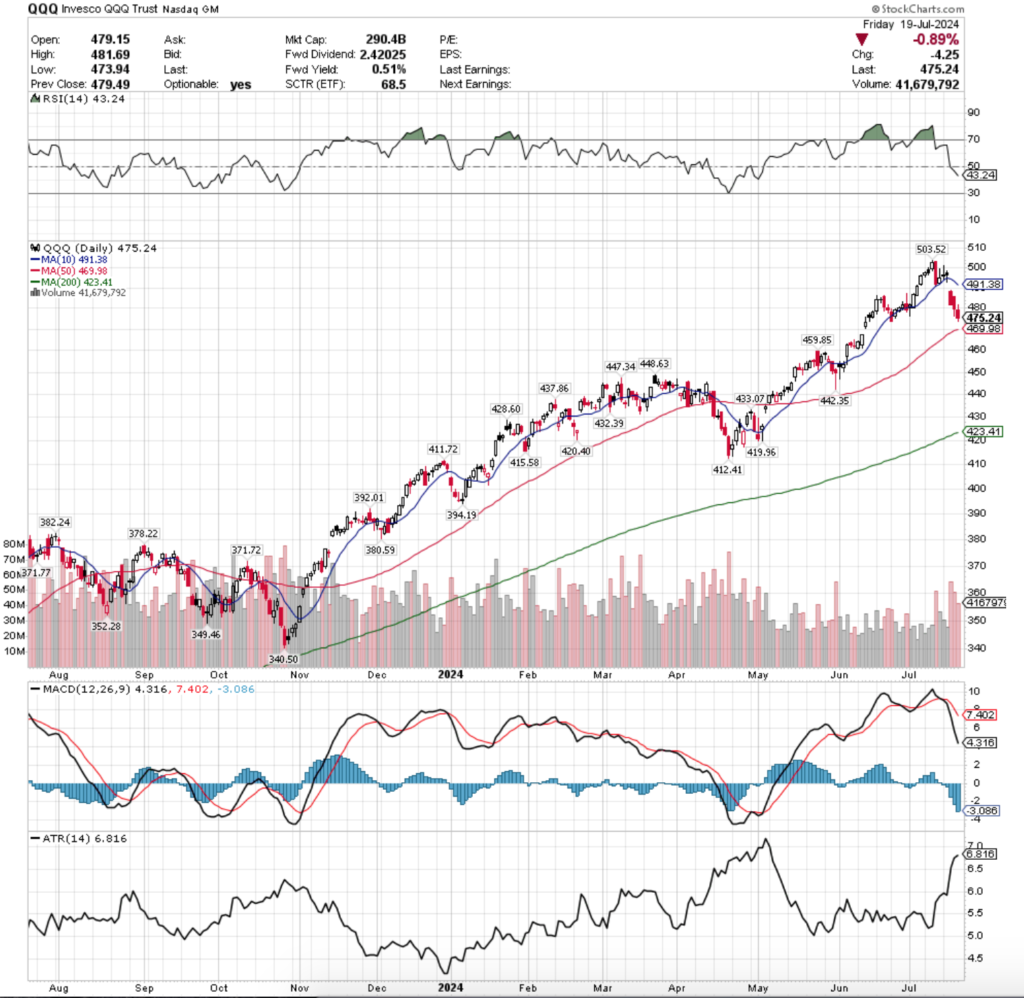
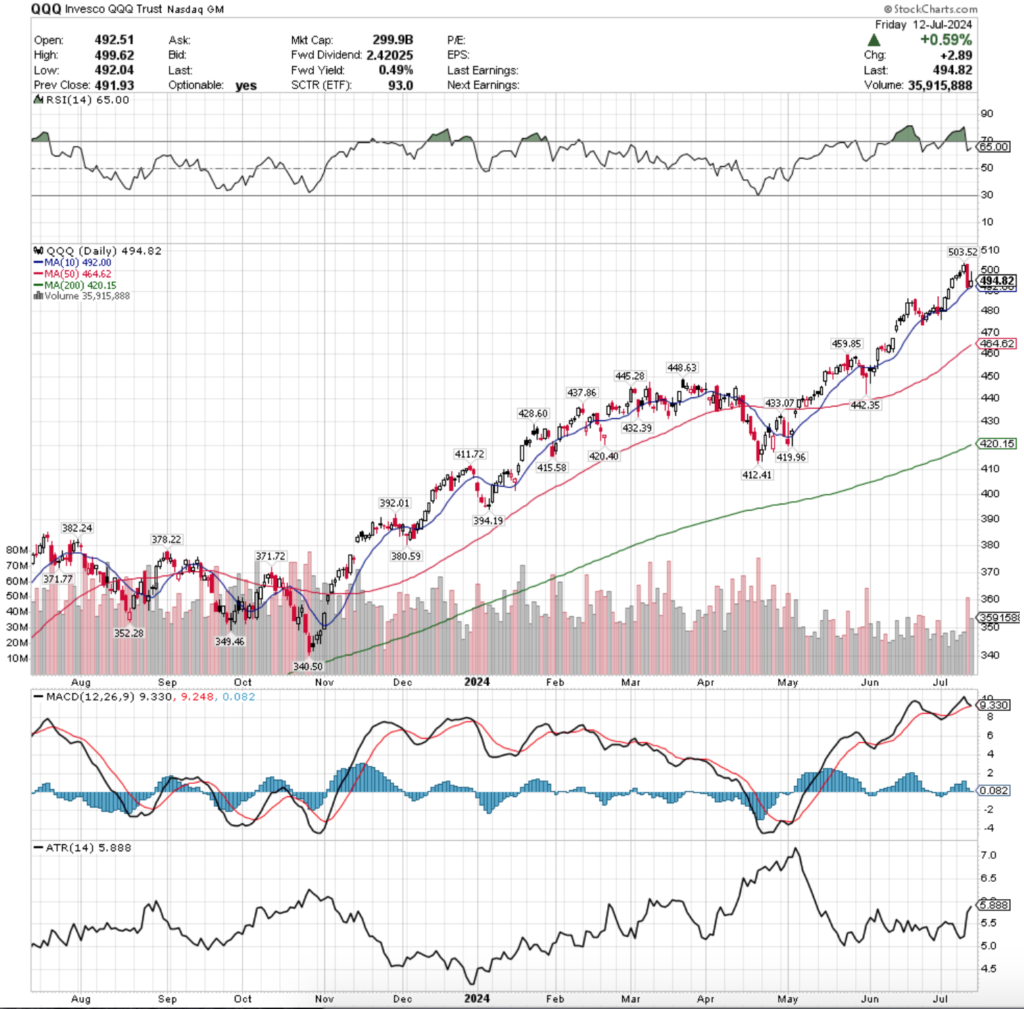
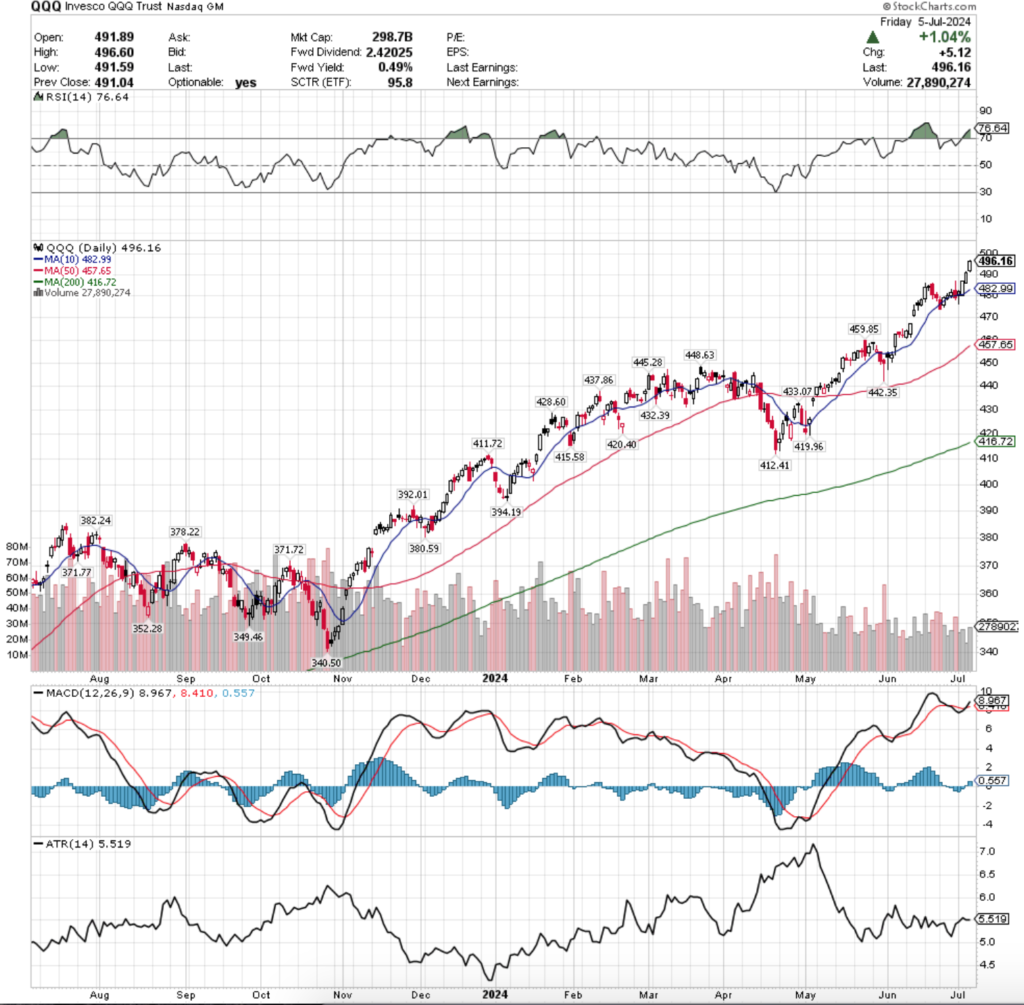
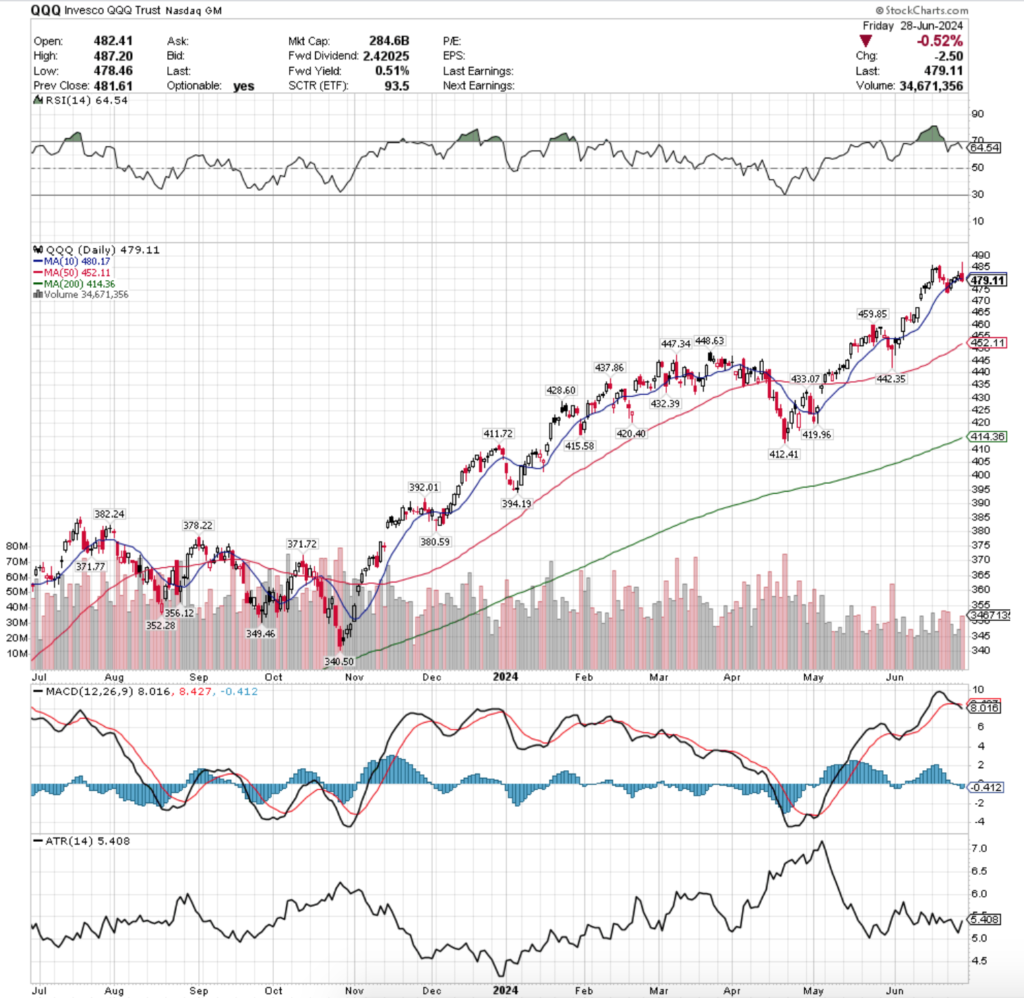
QQQ, the Invesco QQQ Trust ETF that tracks the NASDAQ 100 fared the worst of the major four index ETFs, declining -0.78% for the week.

QQQ ETF - Invesco QQQ Trust ETF's Technical Performance Over The Past Year
QQQ ETF – Invesco QQQ Trust ETF’s Technical Performance Over The Past Year

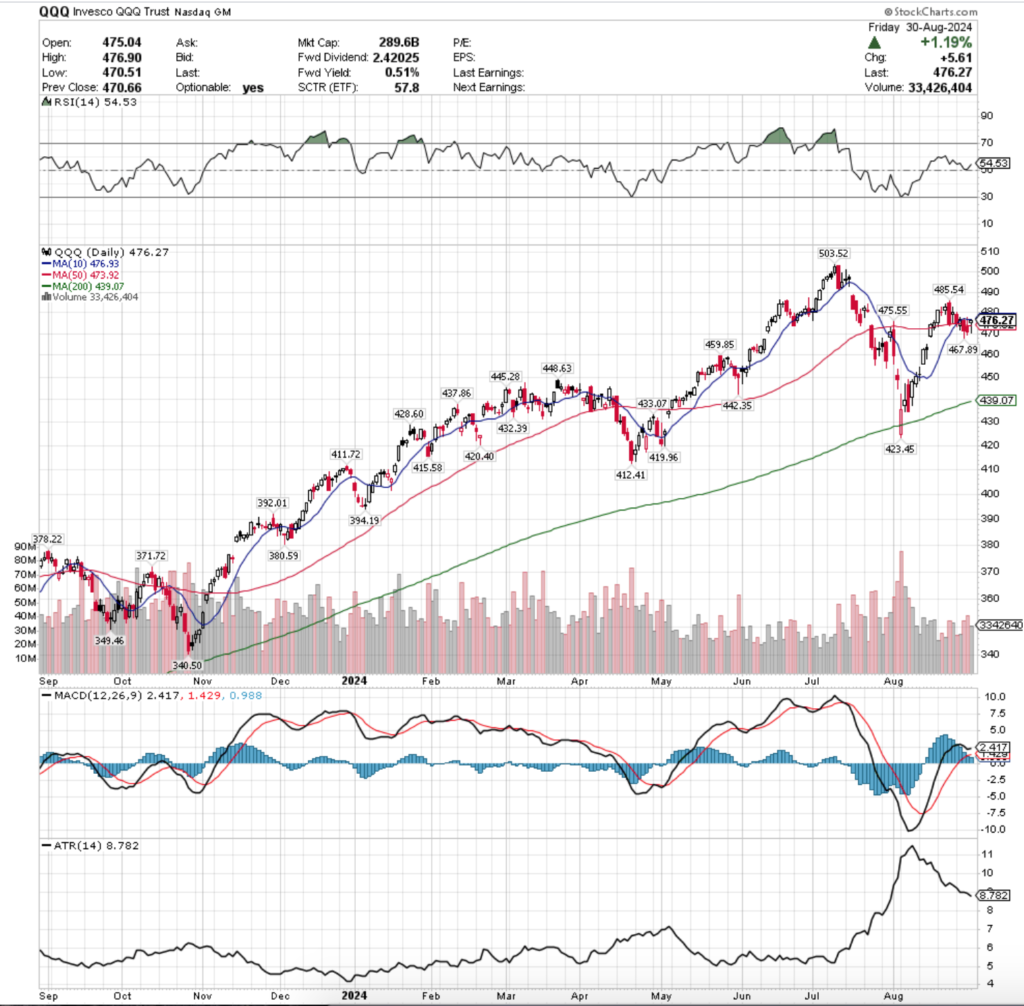
Their RSI is near the neutral 50 mark & sits currently at 54.53, while their MACD has recently remained bullish but is declining towards the signal line & looking ready to cross over bearishly in the coming day or two.

Volumes were also weak, coming in -22.79% below the prior year’s average volume (33,309,777 vs. 43,144,086), which is negative from both the perspective of a lack of participation vs. the comparison when made back in March (per 8/18/2024’s Weekly Review Note) & from the perspective of how bearish volume is standing taller at higher levels than volume does on many bullish days.

Much like SPY, QQQ’s week last week also started off on a bearish note, as Monday’s session declined to the support of their 50 DMA, which is closed near.

Tuesday opened lower but was able to break above the 50 day moving average’s resistance & briefly broke above the 10 DMA’s, but settled for the day near the 10 DMA.

Wednesday is when the fun broke out, as the session opened higher than Tuesday’s session, but ultimately sold off & formed a bearish engulfing pattern, indicating that there would be more difficulty on the horizon for QQQ.

Thursday confirmed this when QQQ declined again on the strongest volume of the week (Wednesday’s was second strongest, followed by Friday’s).

The session opened about midway through the range of Wednesday’s price action, tested higher, breaking above the 10 DMA’s resistance briefly before tumbling below the 50 DMA, testing further down & ultimately being unable to close above the 50 DMA’s resistance.

Friday’s candle would be characterized as a hanging man (bearish) if it came at the end of an uptrend & not a consolidation range, but prices were squeezed higher to celebrate the last session of August, despite the day’s lower shadow signaling that there is a lot more people are getting happy about to be found to the downside for QQQ.

As I’ve noted before, QQQ & SPY have very similar patterns, however QQQ did not ascend with as high of a velocity as SPY did over the past year, which gives them the benefit of more local support touch-points.

While this is good, one issue that they have is that even the slightest decline from Friday’s closing price puts them trading under their 10 & 50 DMA’s, with the 200 DMA only -7.8% below Friday’s close.

Still, the week ahead for QQQ might benefit from looking at their chart from this time last year & noting the similarities between September & October of 2023 to July & August 2024.

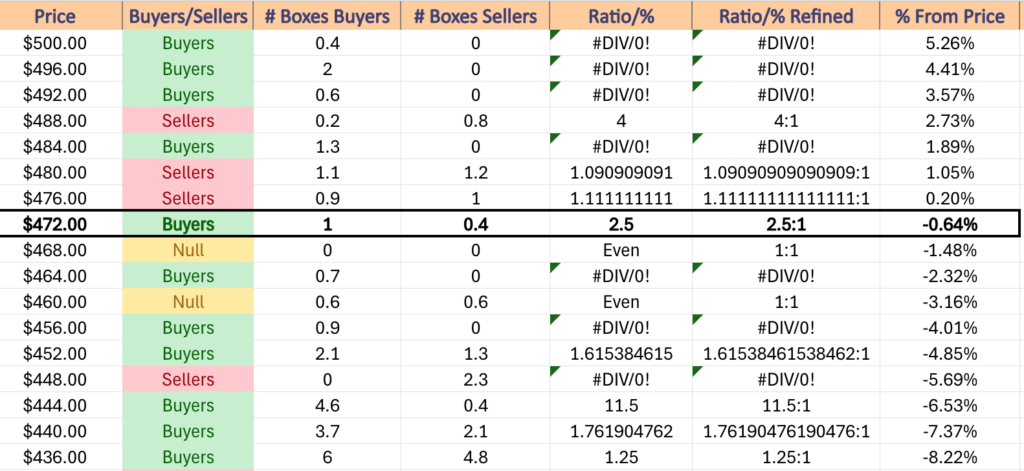
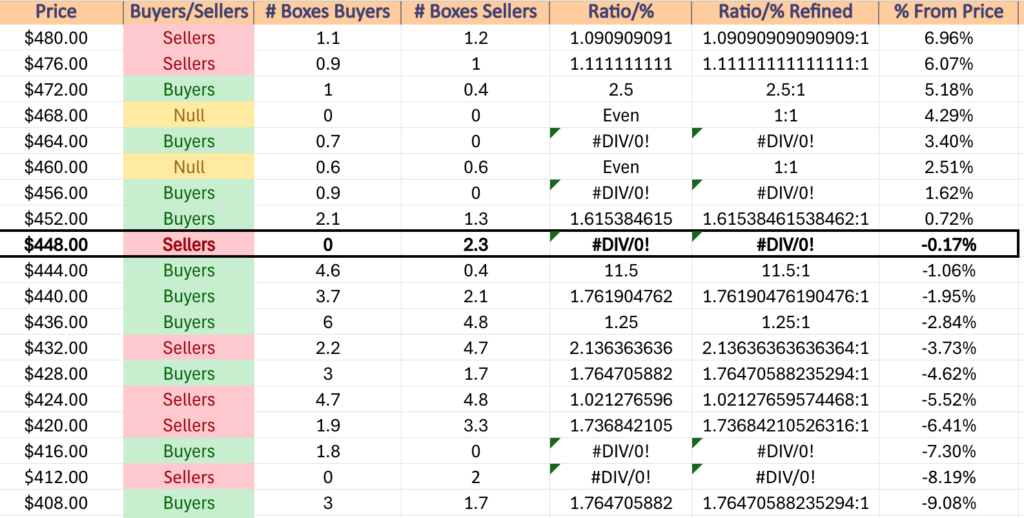
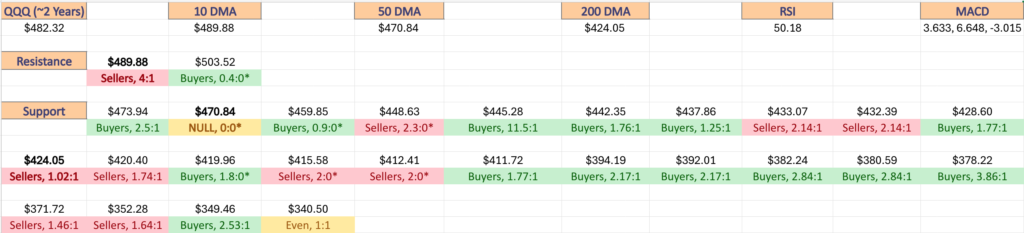
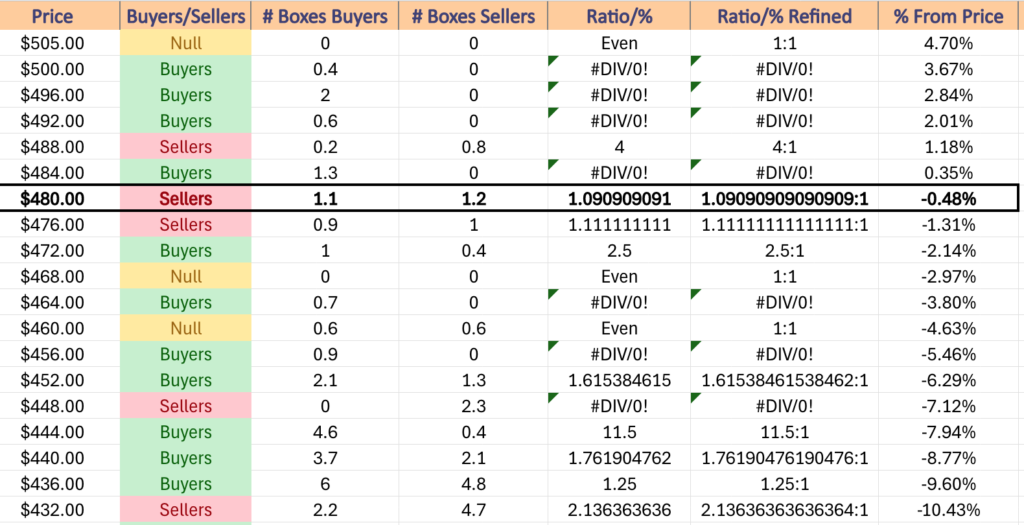
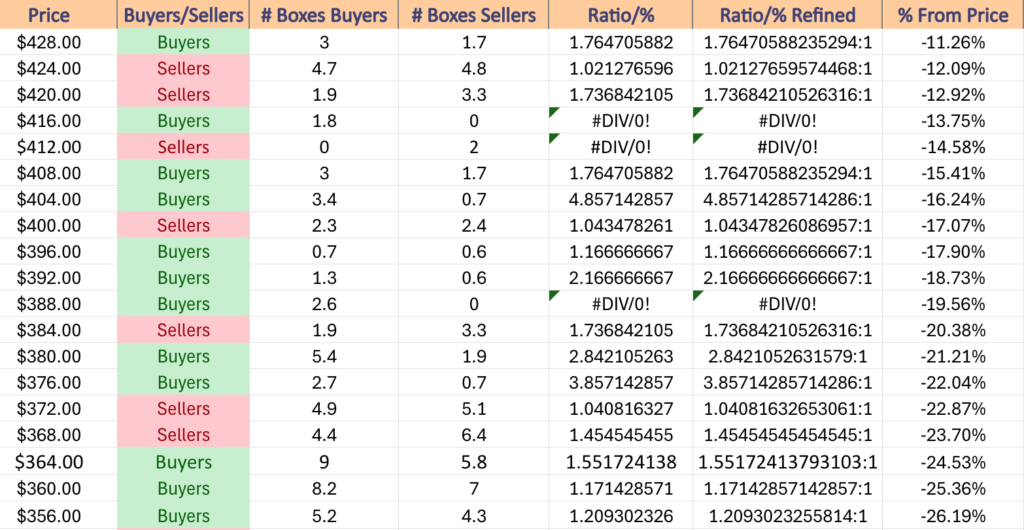
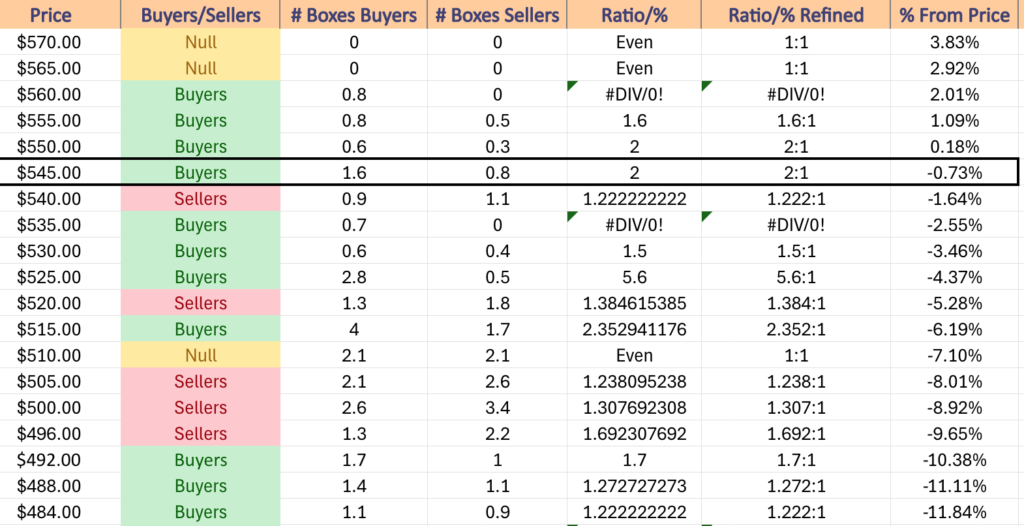
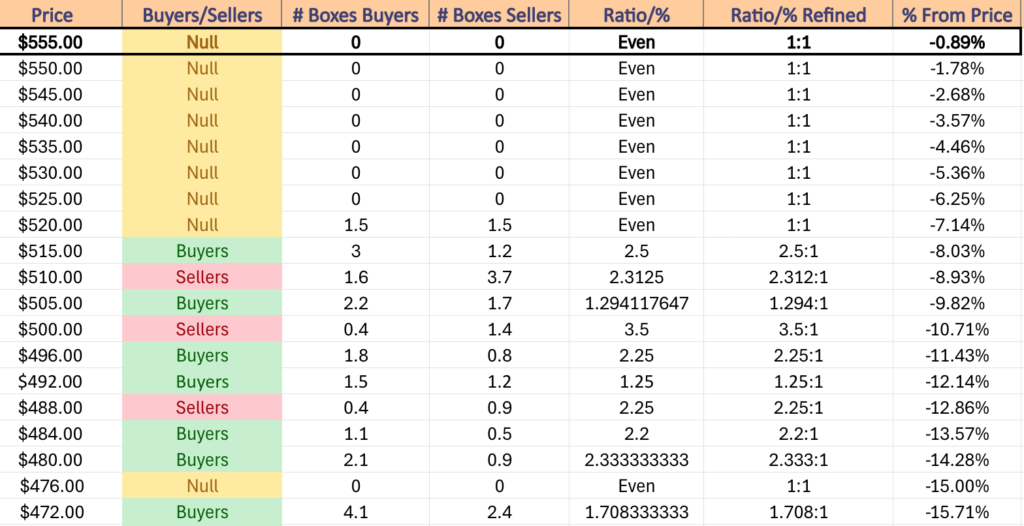
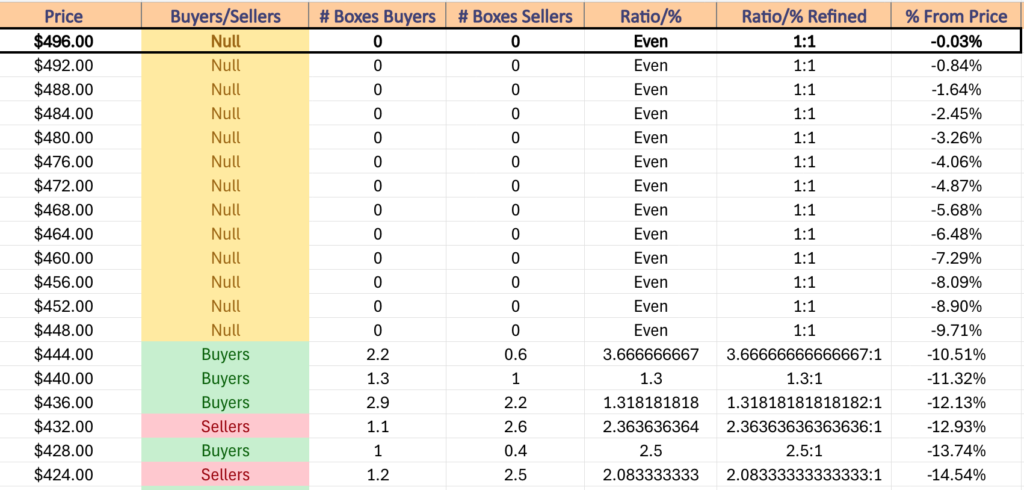
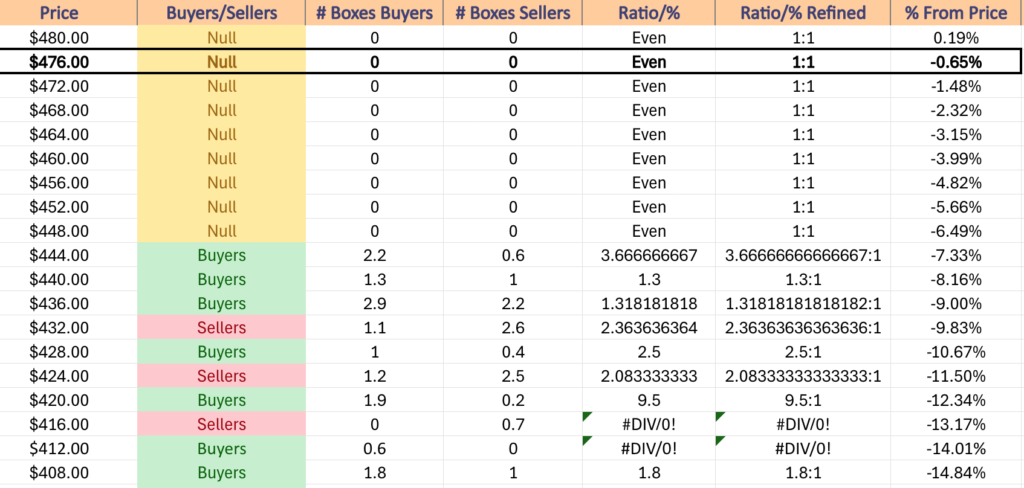
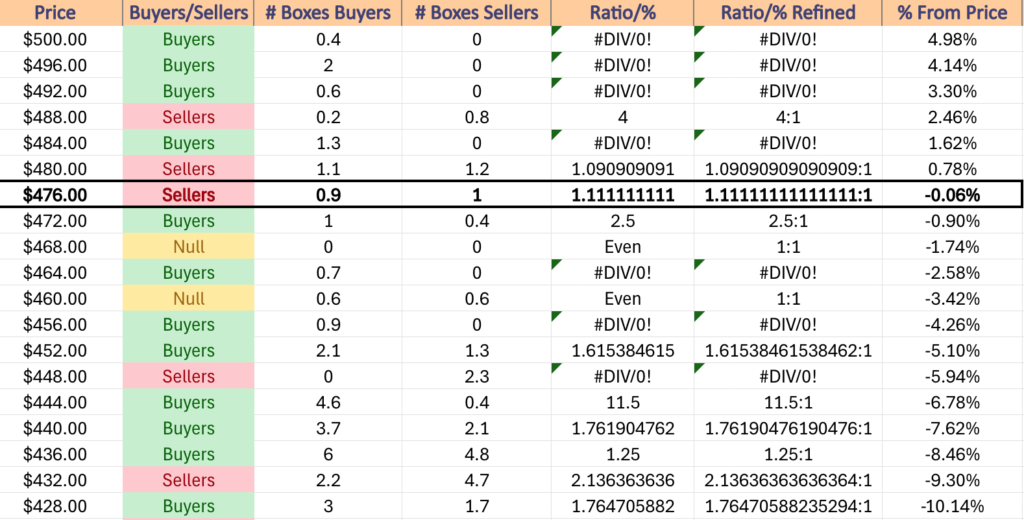
It would also be beneficial to familiarize yourself with the price level volume sentiment table below & to browse our breakdown of the buyers:sellers strength at their support & resistance levels.

It will also be interesting to see how long it takes for QQQ to begin filling its gaps from August given that their price is already getting downward pressure from the 10 & 50 DMAs & then keep track of how long it takes SPY to follow suit.

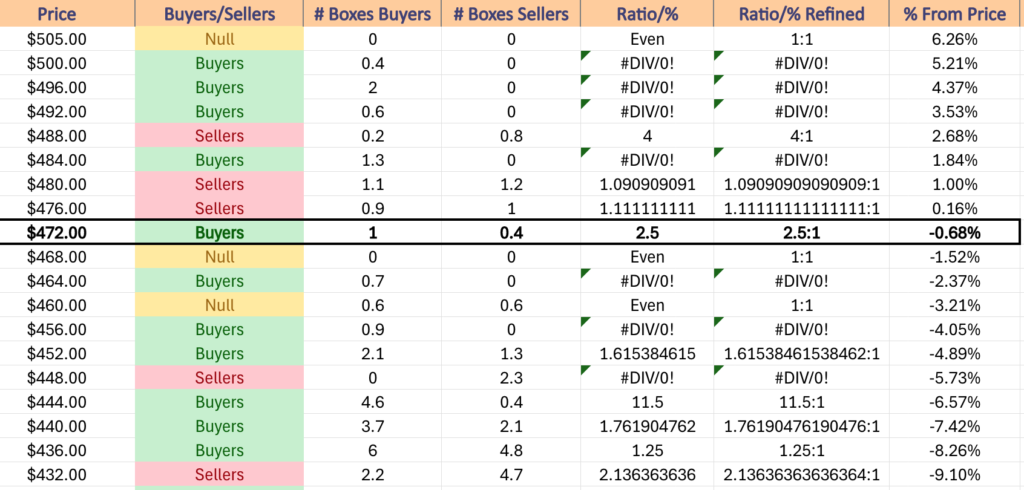
QQQ has support at the $475.55 (Volume Sentiment: Buyers, 2.5:1), $473.92 (50 Day Moving Average, Volume Sentiment: Buyers, 2.5:1), $467.89 (Volume Sentiment: Buyers, 0.7:0*) & $459.85/share (Volume Sentiment: Buyers, 0.9:0*) price levels, with resistance at the $476.93 (10 Day Moving Average, Volume Sentiment: Sellers, 1.11:1), $485.54 (Volume Sentiment: Buyers, 1.3:0*) & $503.52/share (All-Time High, Volume Sentiment: Buyers, 0.4:0*) price levels.

QQQ ETF's Price Level:Volume Sentiment Over The Past 1-2 Years
QQQ ETF’s Price Level:Volume Sentiment Over The Past 1-2 Years

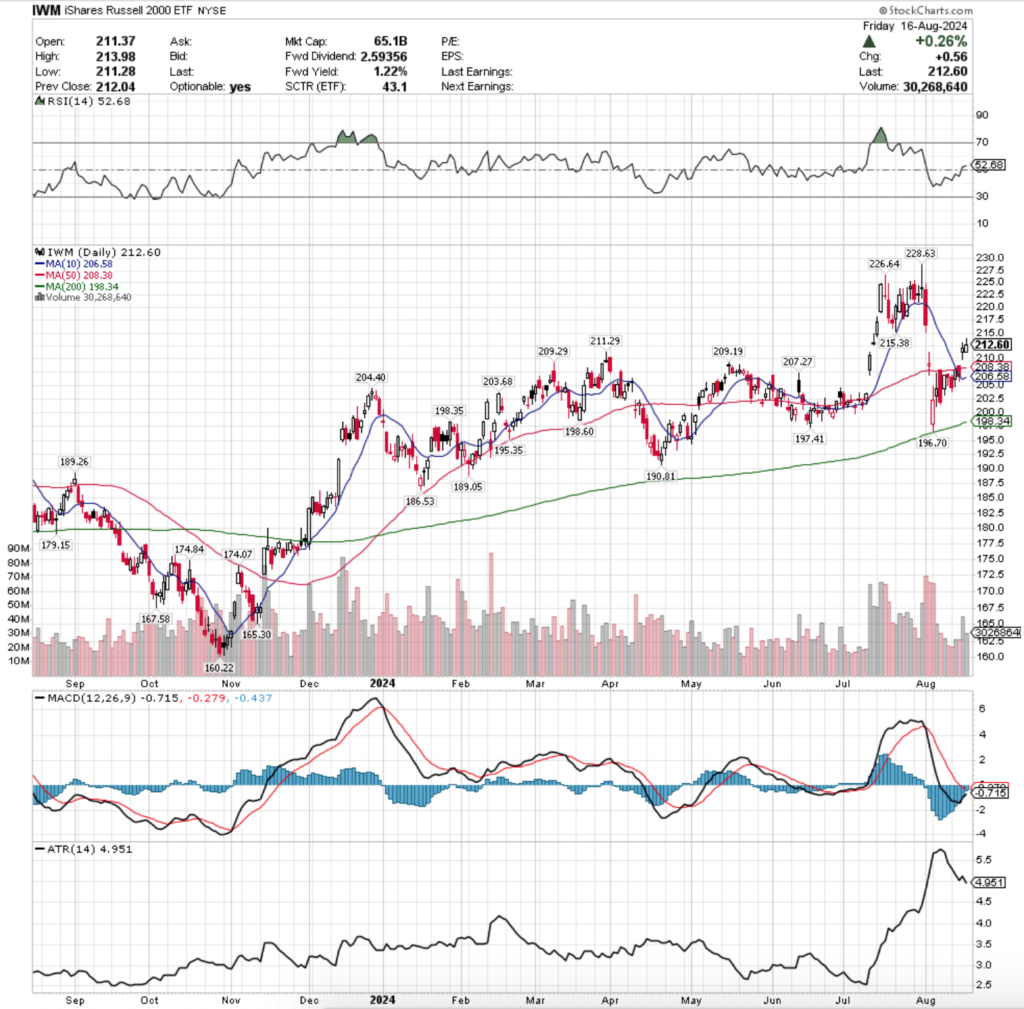
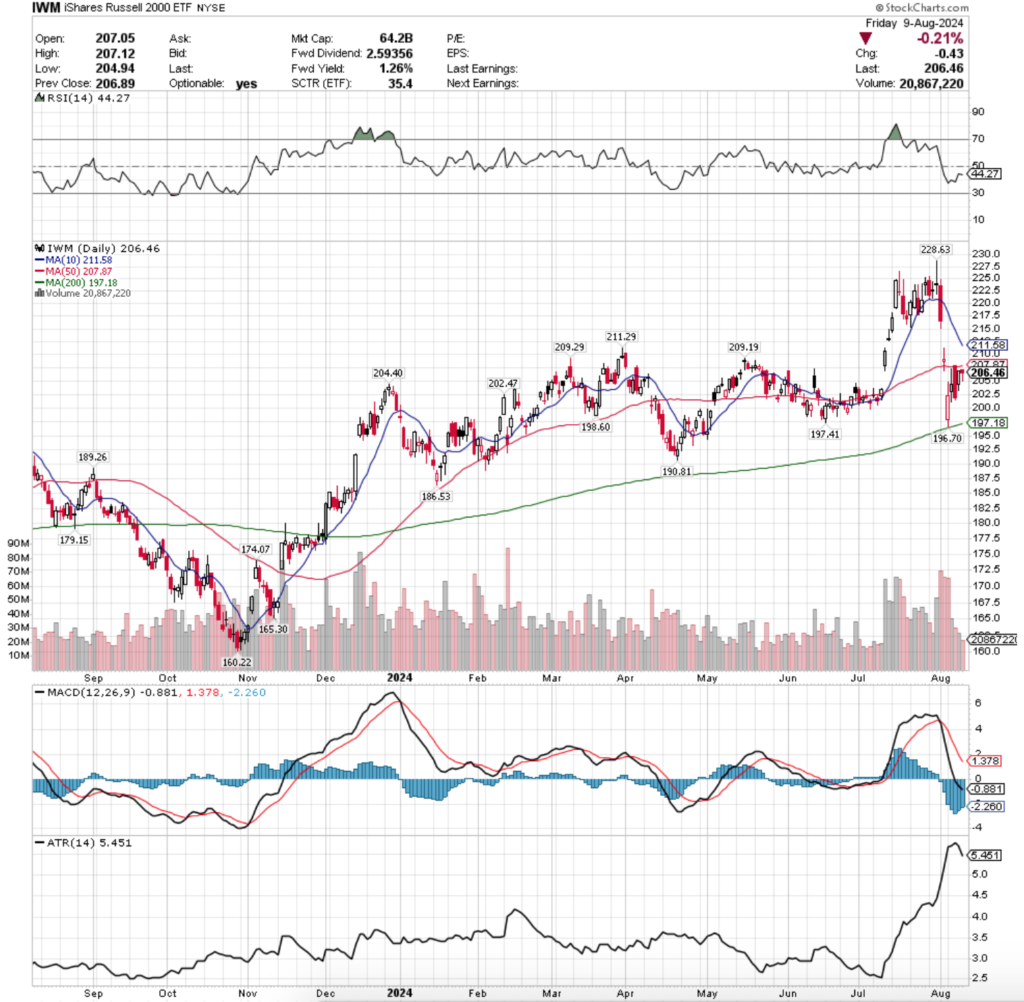
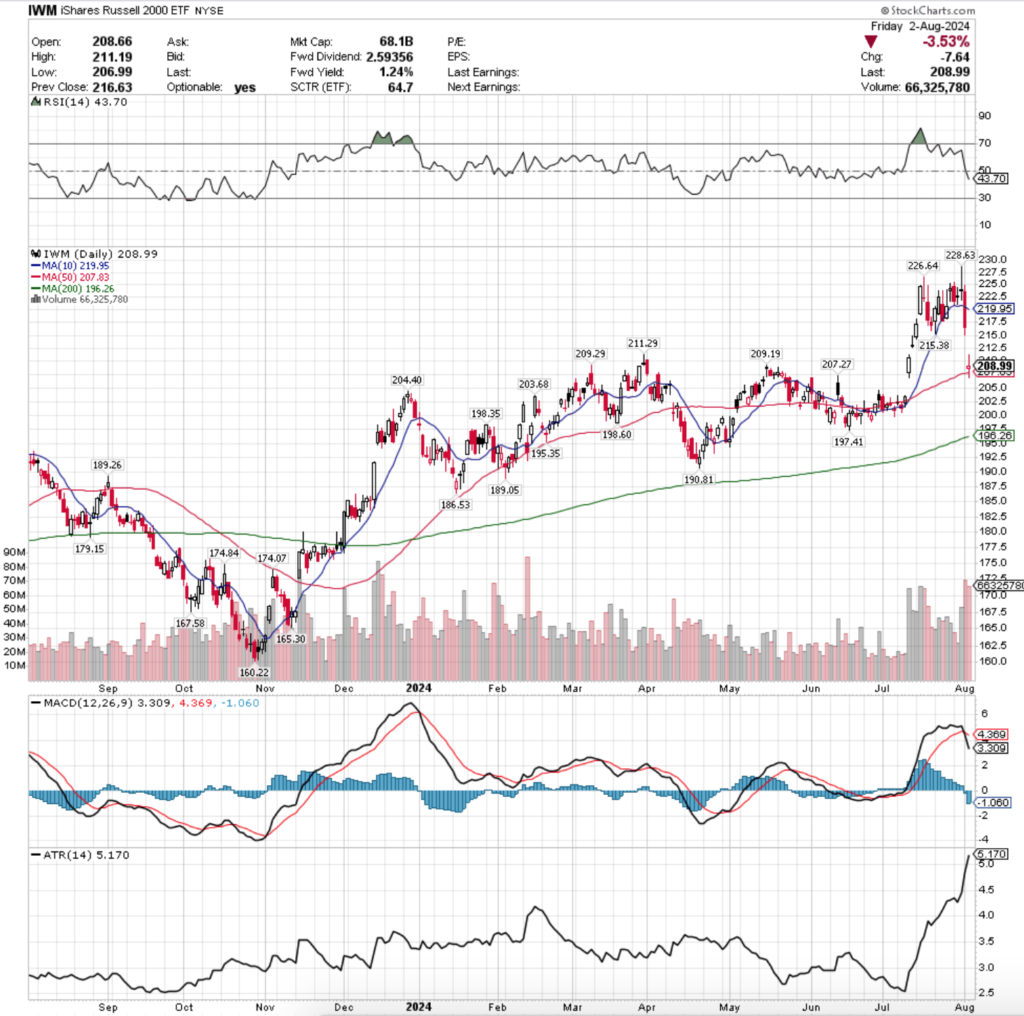
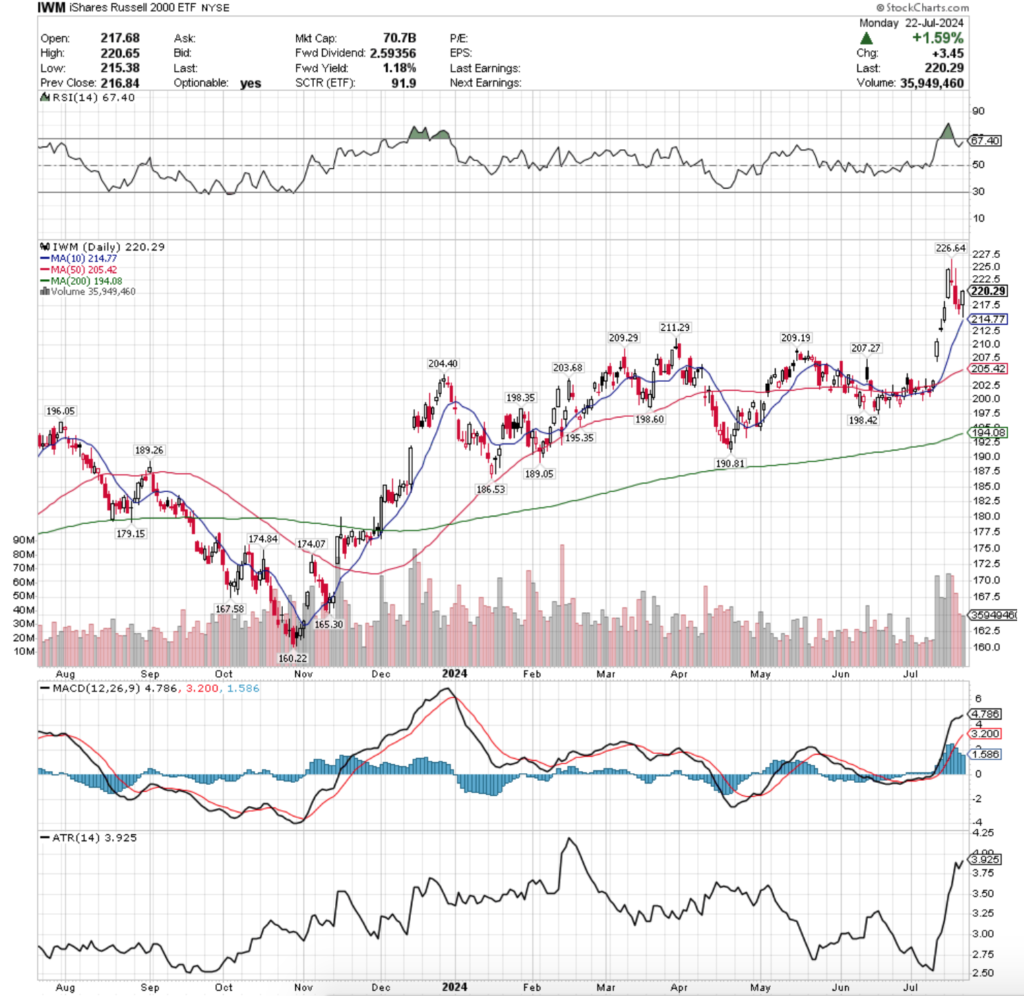
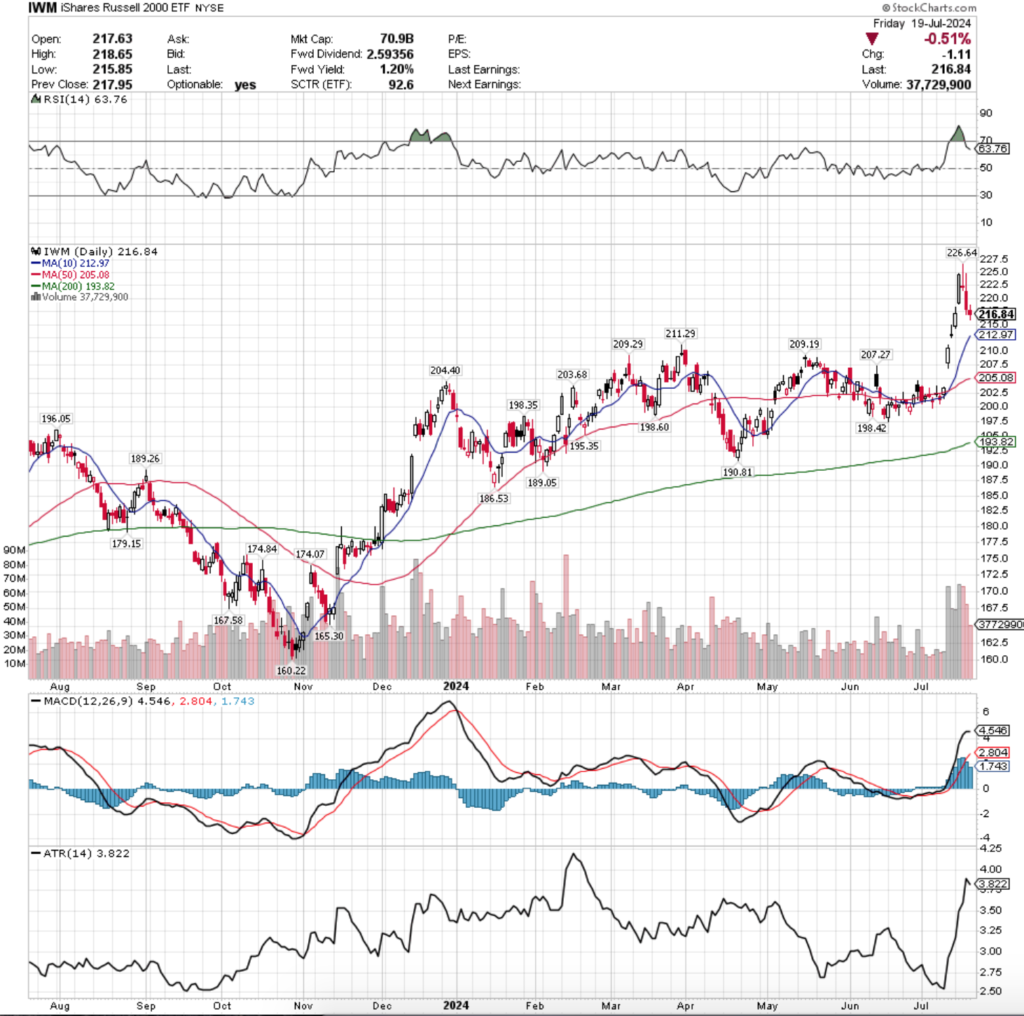
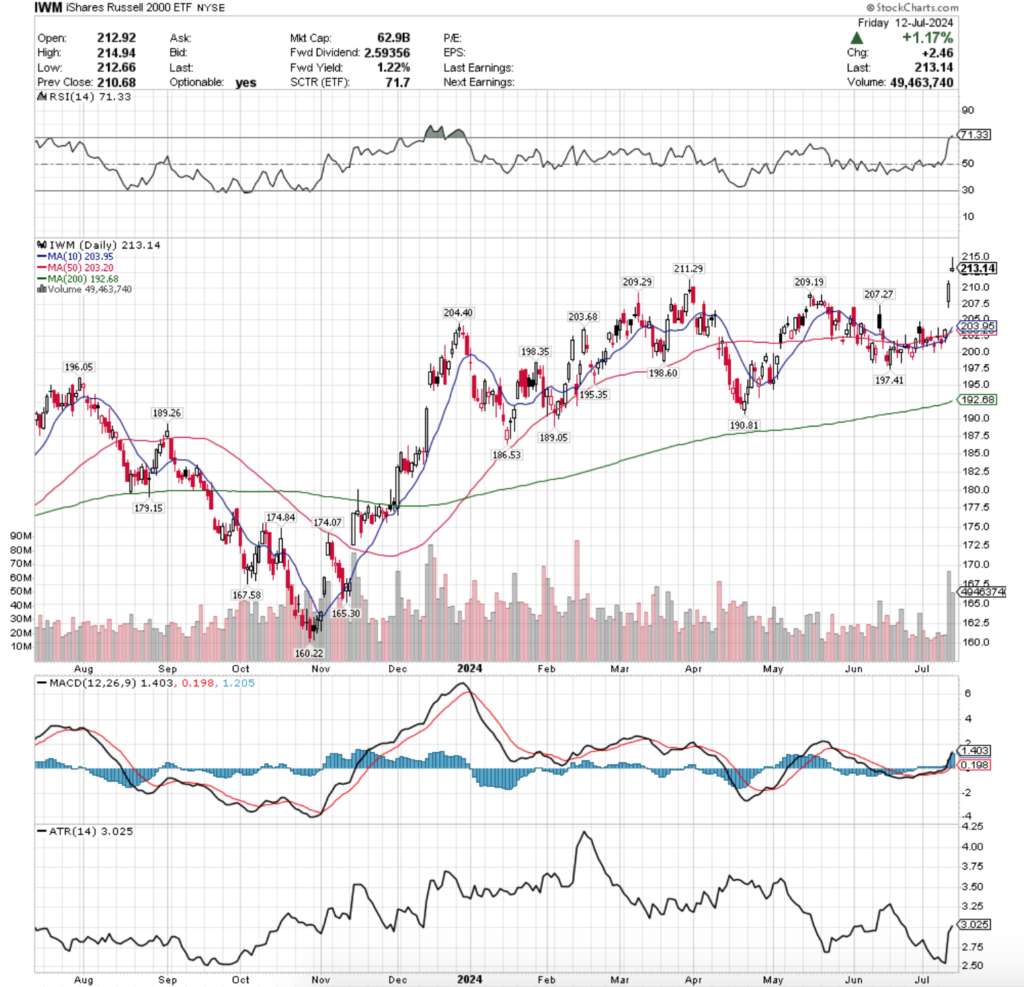
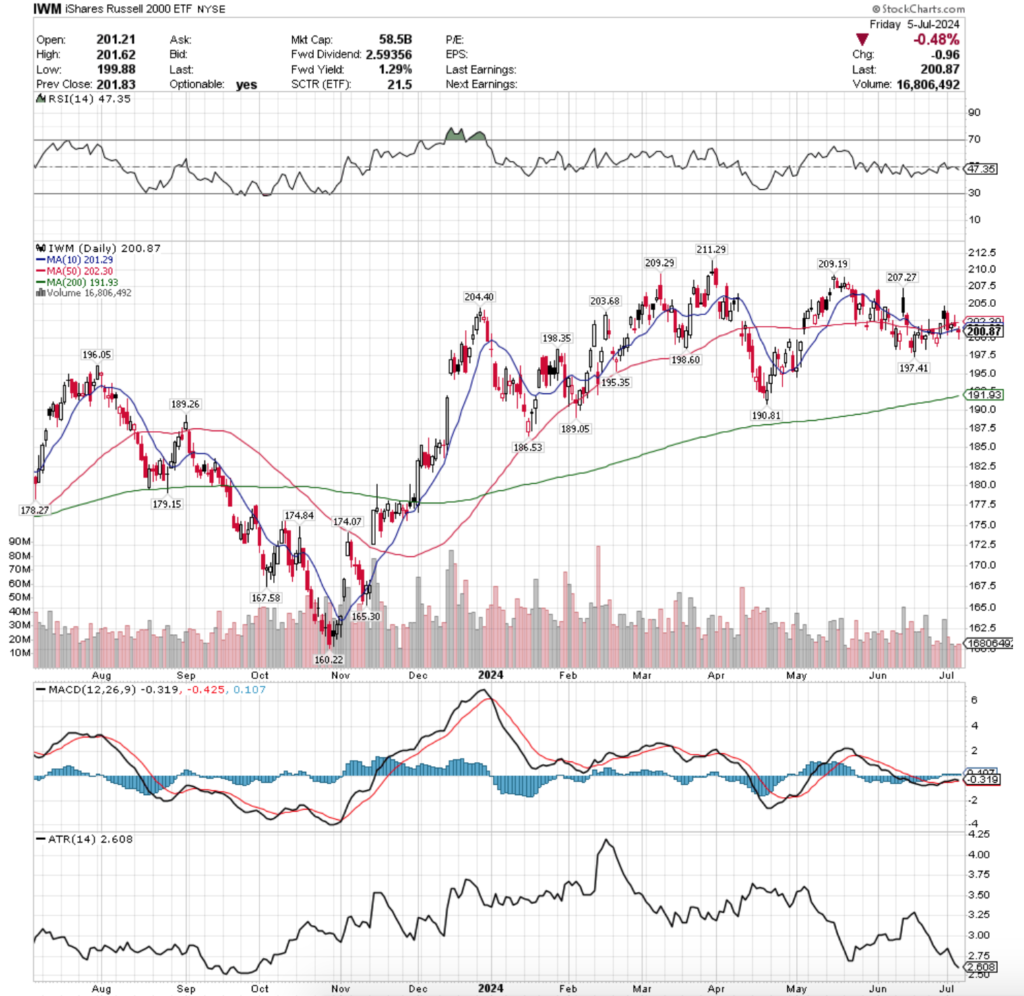
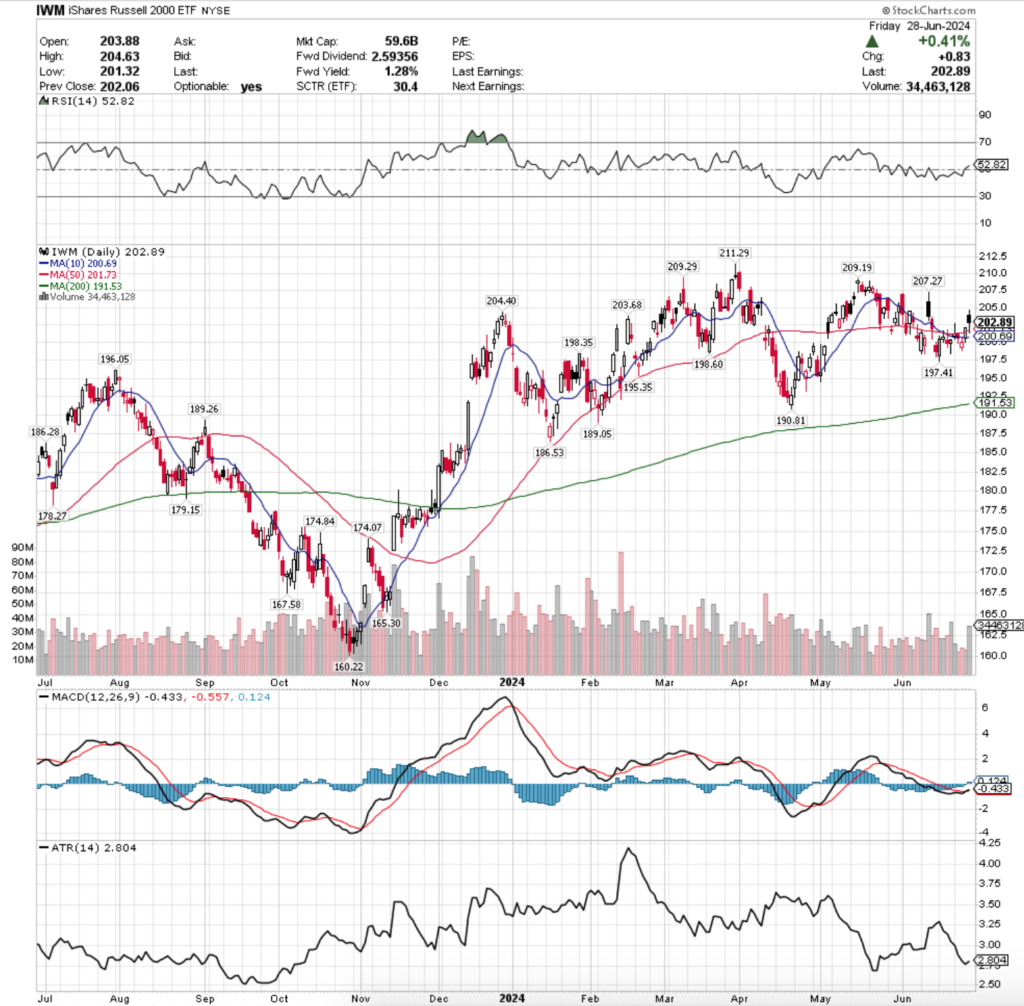
IWM, the iShares Russell 2000 ETF dipped -0.14% for the week, as small cap stocks remained relatively unchanged compared to the other major index ETFs.

IWM ETF - iShares Russell 2000 ETF's Technical Performance Over The Past Year
IWM ETF – iShares Russell 2000 ETF’s Technical Performance Over The Past Year

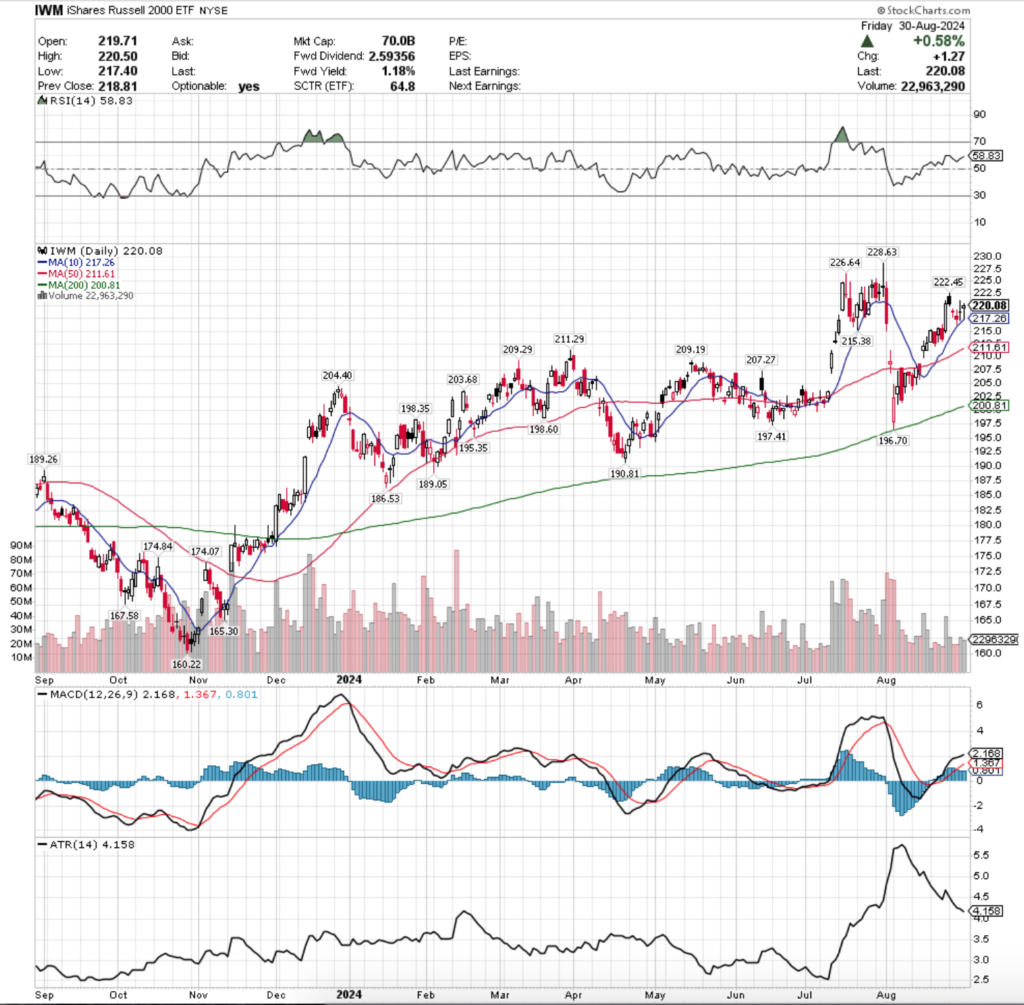
Their RSI is trending towards overbought levels & sits currently at 58.83, while their MACD is still bullish but their histogram is waning, which precedes periods of weakness.

Volumes were -36.27% below the past year’s average last week (22,325,177 vs. 35,030,586), which gives the same signals of weakness outlined for SPY & QQQ, although in a bright spot for IWM their declining days last week had the lowest levels of volume (not sure that’s much of a win, but worth noting).

Monday was a bullish day for IWM, however it was flashing bearish signals as well, as the session was unable to close above where it opened & it tested below the close of the previous Friday.

Tuesday the levy broke & IWM opened on a gap down that ended as a spinning top, indicating a great deal of indecision on the part of market participants (but on low volume, as noted earlier).

The downtrend continued on Wednesday with another spinning top candle that tested the support of the 10 day moving average, but was able to stay above it for the session.

Thursday showed that there was more confusion in the small caps, as the day ended on a long legged doji, where price was relatively unchanged from open to close but the upper & lower shadows show a wide range of prices were tested throughout the session.

Friday continued the “week of uncertainty” for IWM, as the week concluded on a spinning top candle that while the open/closing price action was concentrated in the upper end of the candle, the lower shadow tested down to the 10 day moving average’s support, meaning that we will likely see more retests of this support in the coming week.

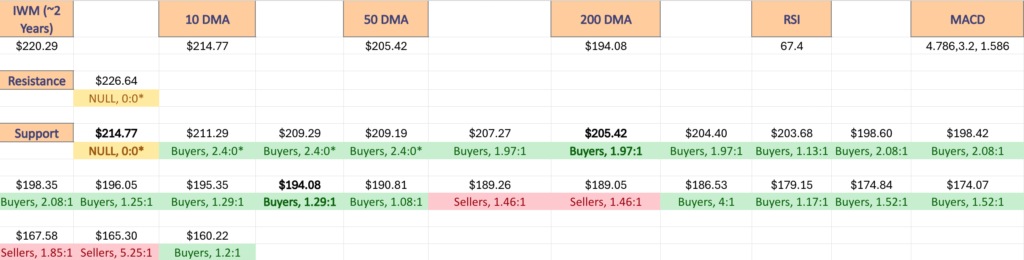
As frequently noted in the weekly posts, IWM tends to oscillate around a trading range then leg higher or lower much more than SPY or QQQ, so there is quite a bit of support for IWM at these price levels that are nearby.

However, it should be noted that the 200 day moving average has now moved into that support zone & is sitting right in the middle of it.

As the 200 DMA continues to climb, should IWM break down below it that would likely indicate that the support zone itself will break down & will be something to keep an eye on & to continue to reassess the strength of the price levels.

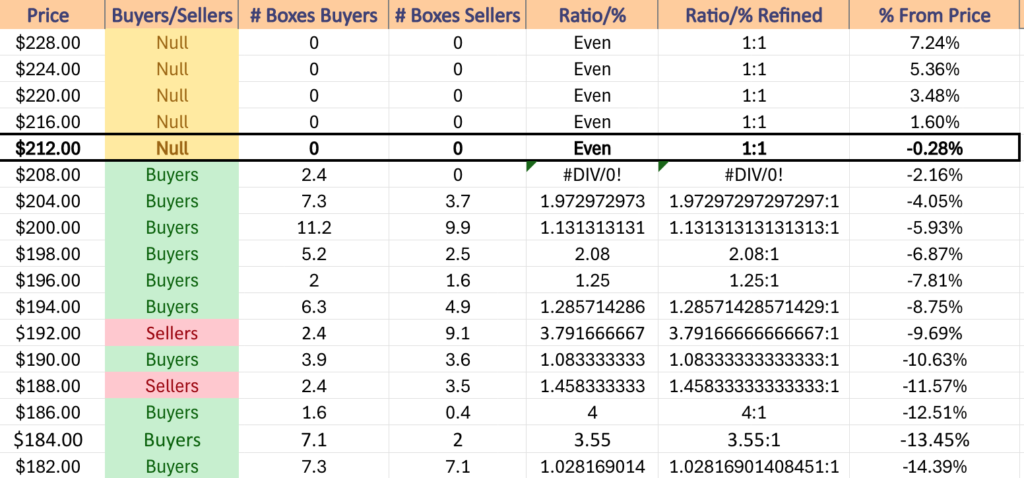
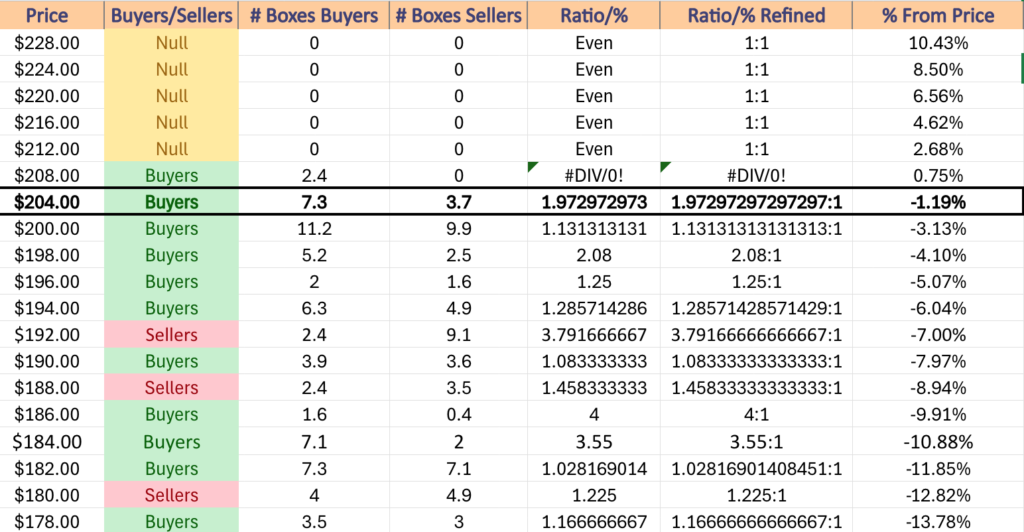
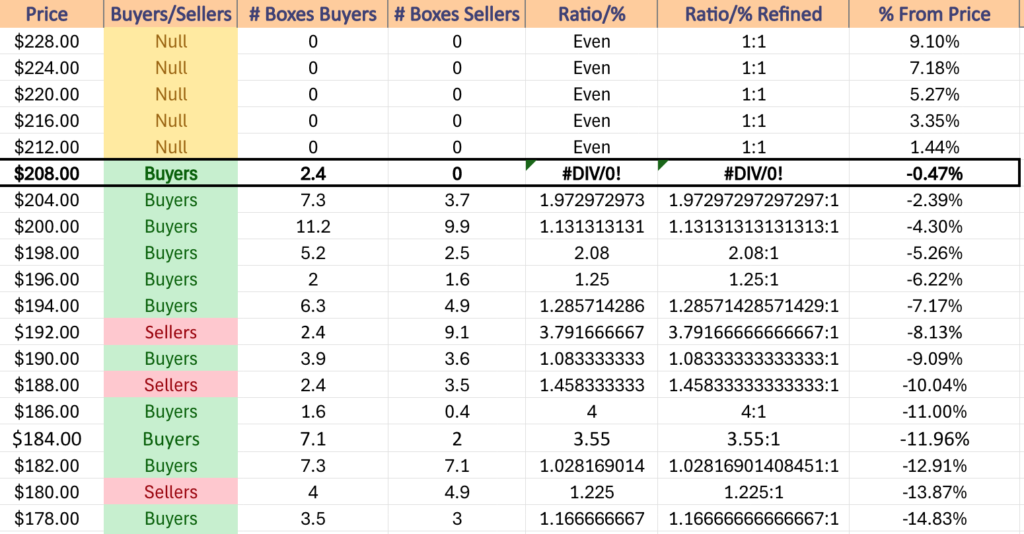
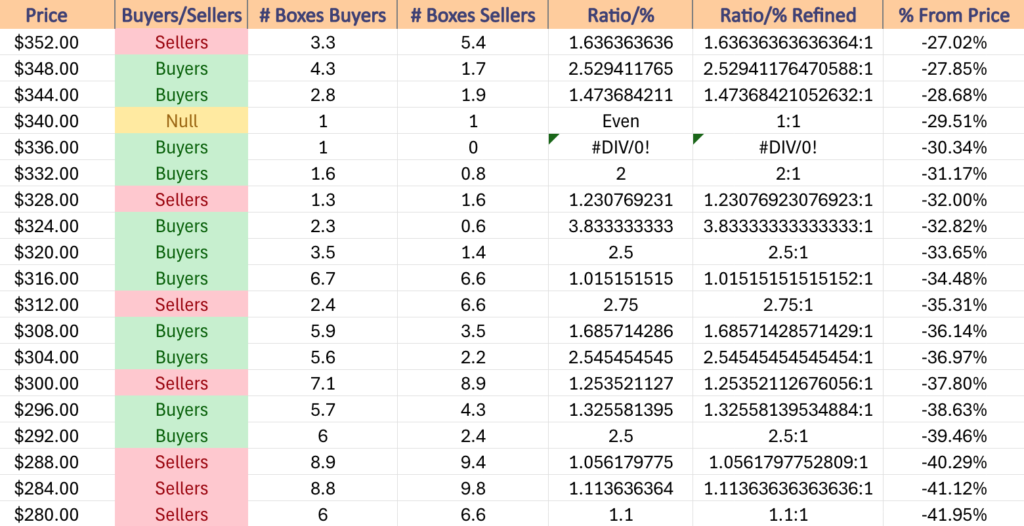
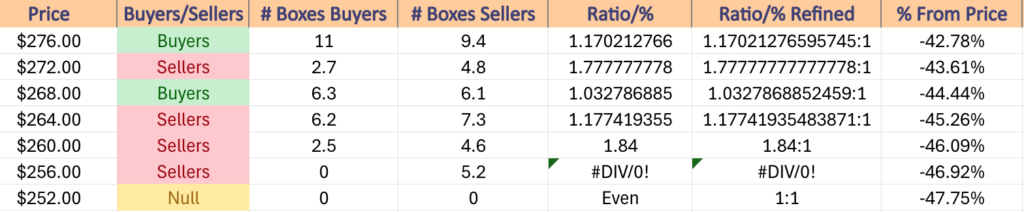
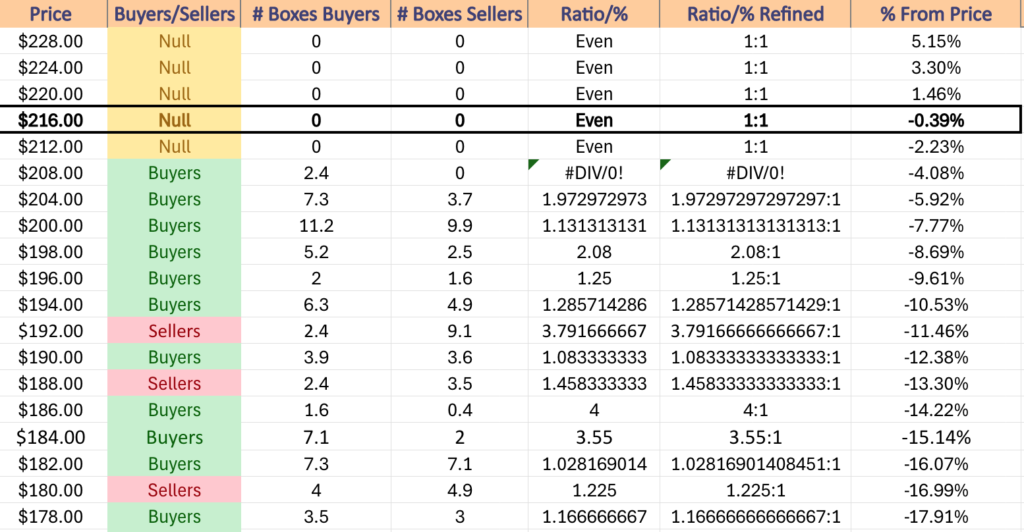
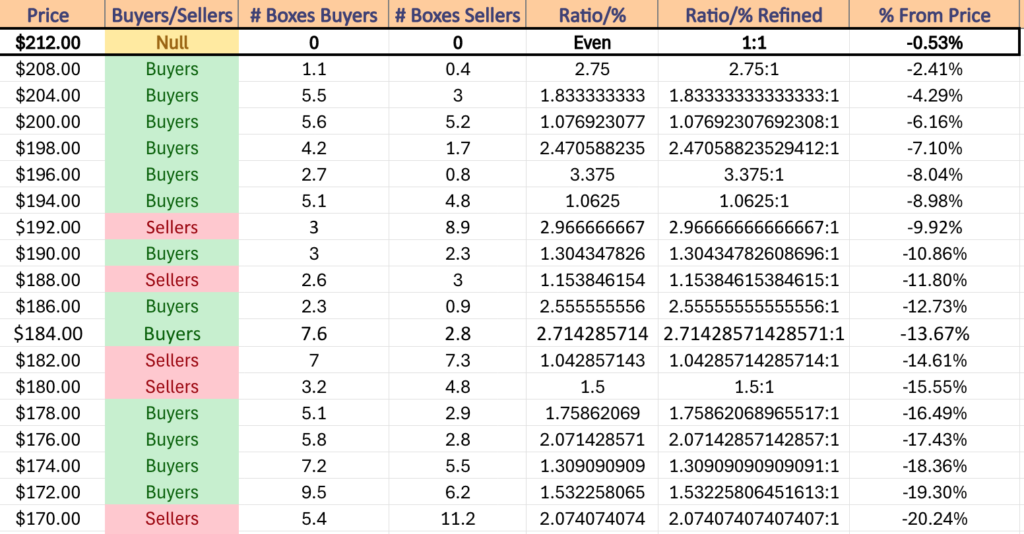
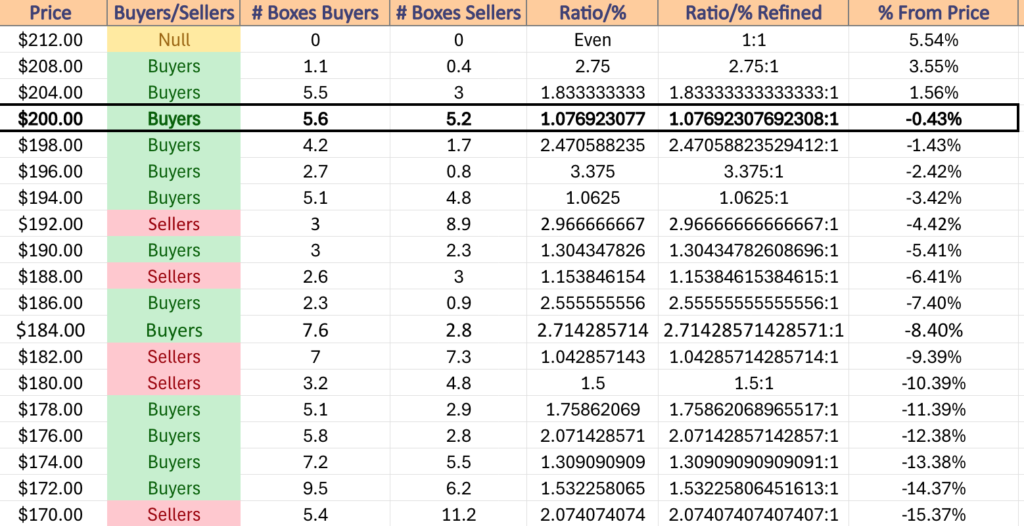
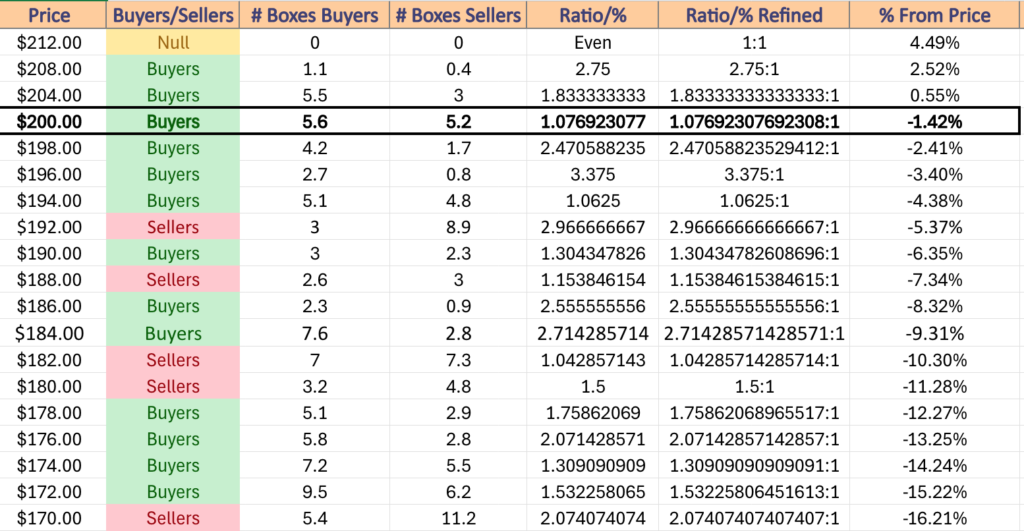
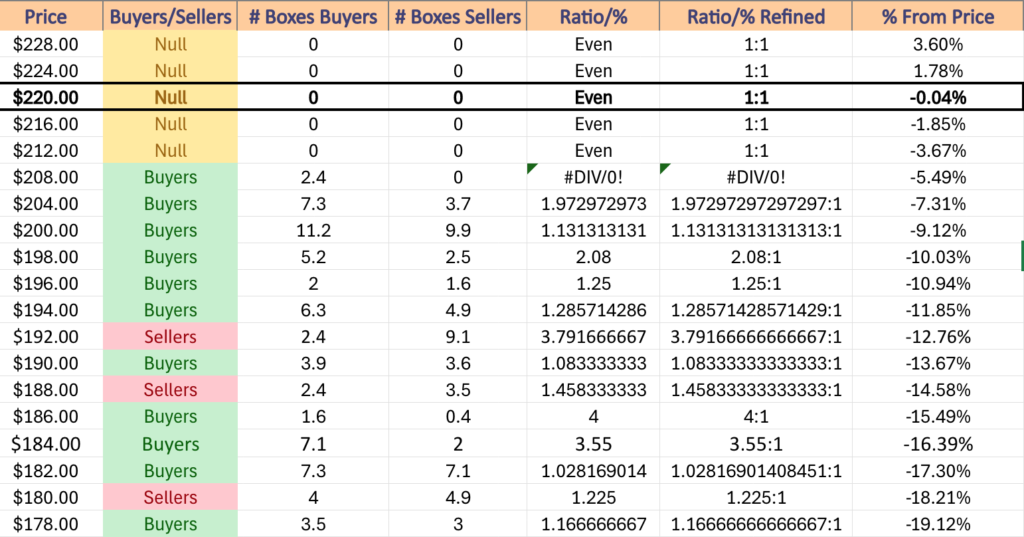
This is also highlighted in the table below where the $193.99/share price level begins a seller dominated zone where there have been 3.79 sellers:buyers in terms of volume sentiment, which would likely trigger a further sell off into the $189.99/share block where the Sellers:Buyers ratio has been 1.46:1 until the $187.99 price level.

Given IWM’s proximity to their 52-week high, expect to see some profit taking in the coming week & be mindful of how the larger cap indexes are moving, as with them all at all-time highs & IWM near a 52-week high that may be the recipe for folks exiting the pool altogether vs. rotating into small caps.

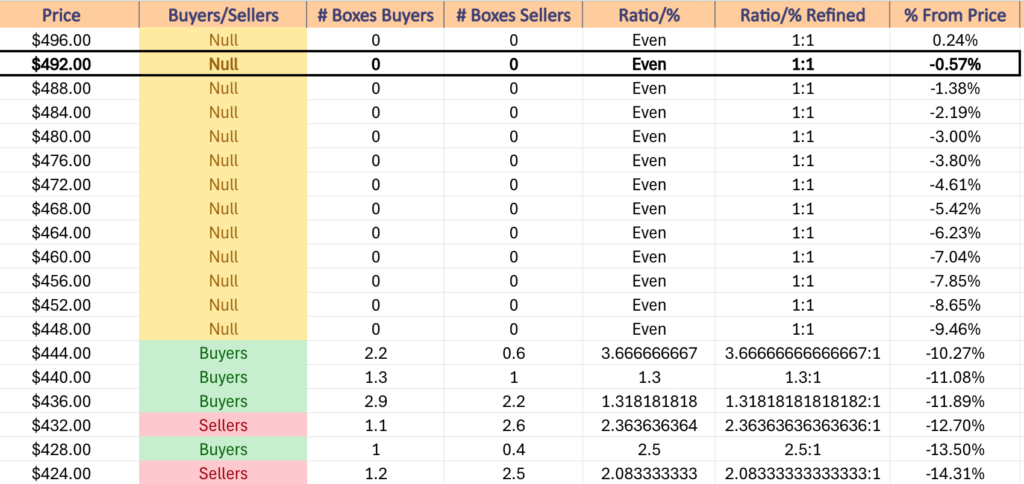
IWM has support at the $217.26 (10 Day Moving Average, Volume Sentiment: NULL, 0:0*), $215.38 (Volume Sentiment: NULL, 0:0*), $211.61 (50 Day Moving Average, Volume Sentiment: Buyers, 2.4:1) & $211.29/share (Volume Sentiment: Buyers, 2.4:0*) price levels, with resistance at the $222.45 (Volume Sentiment: NULL, 0:0*), $226.64 (Volume Sentiment: NULL, 0:0*) & $228.63/share (52-Week High, Volume Sentiment: NULL, 0:0*) price levels.

IWM ETF's Price Level:Volume Sentiment Over The Past 1-3 Years
IWM ETF’s Price Level:Volume Sentiment Over The Past 1-3 Years

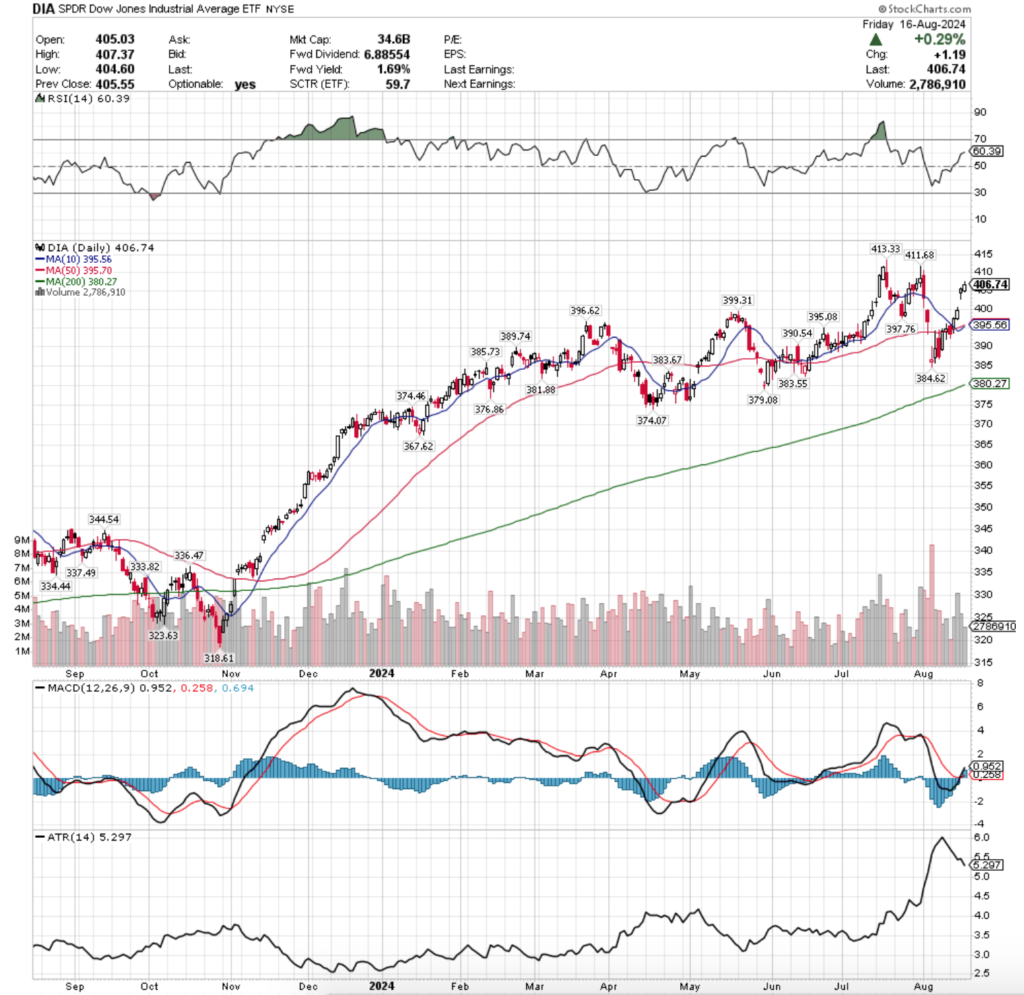
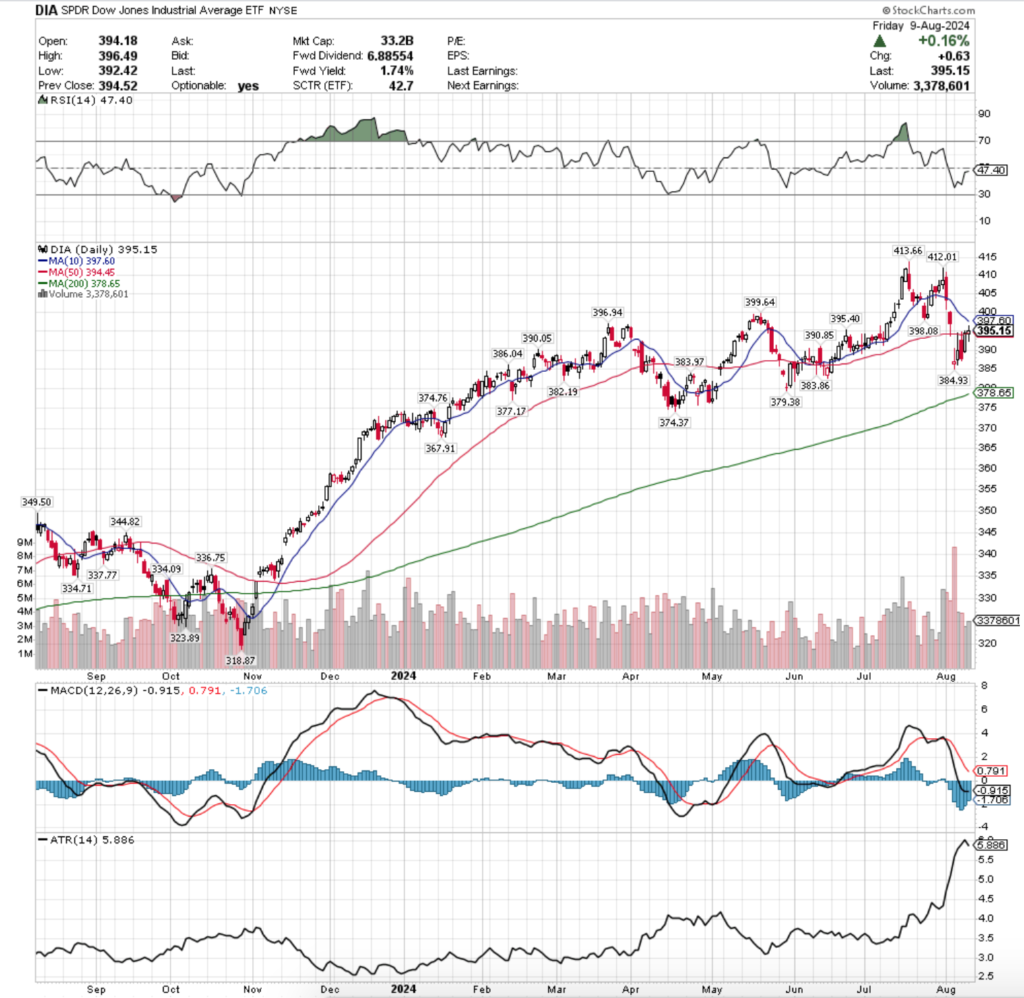
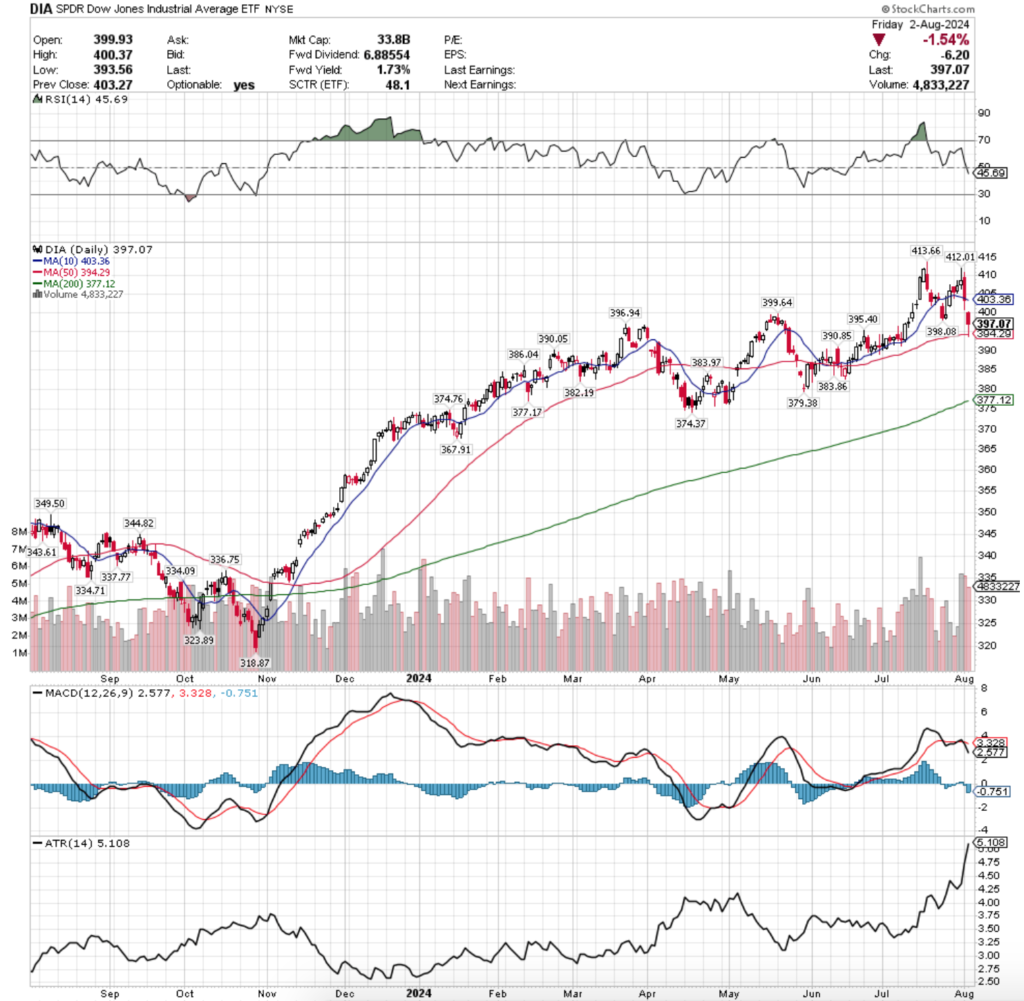
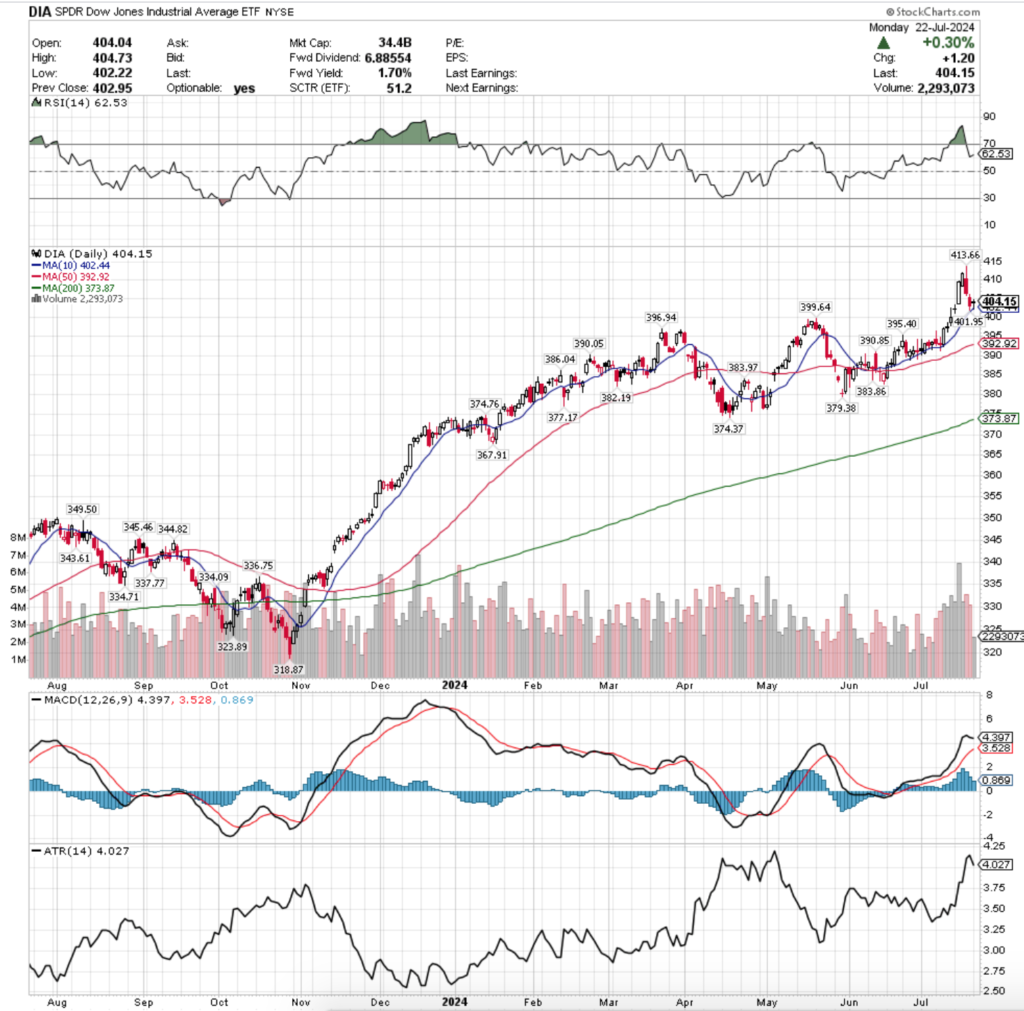
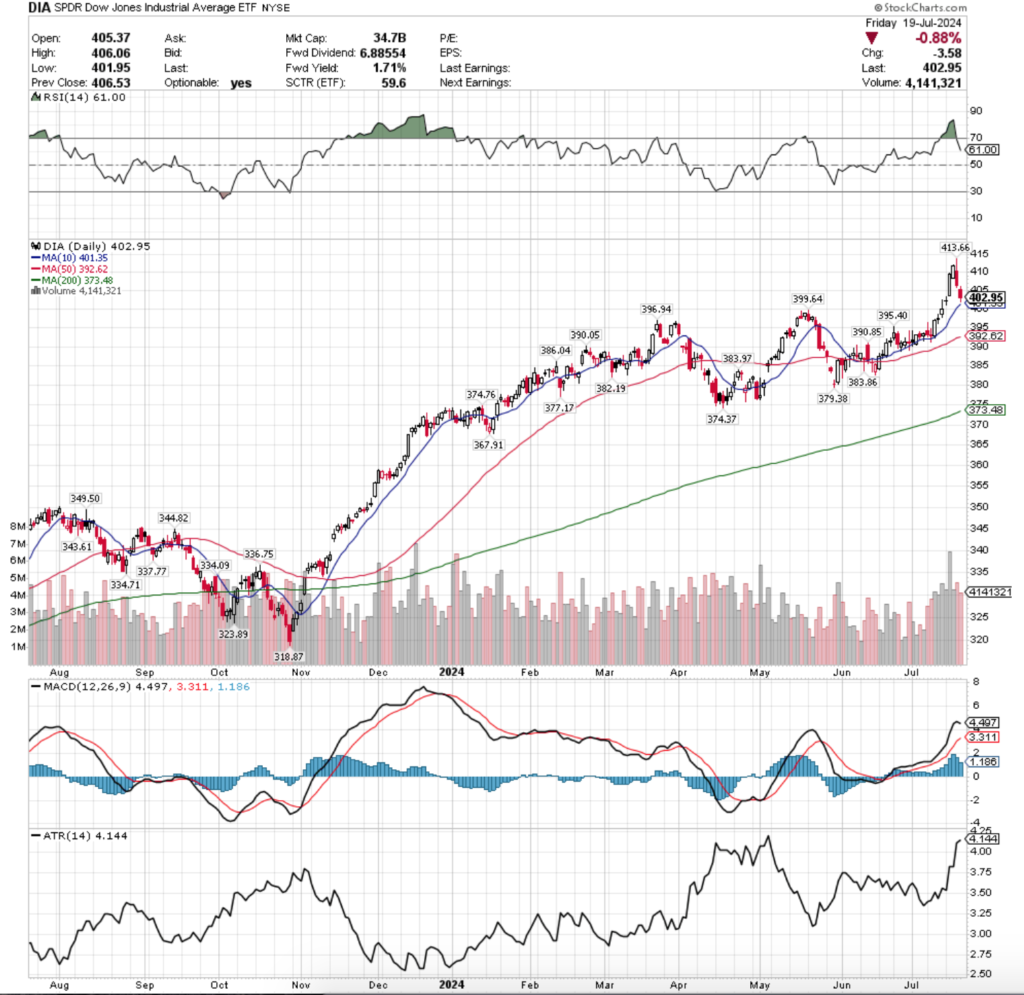
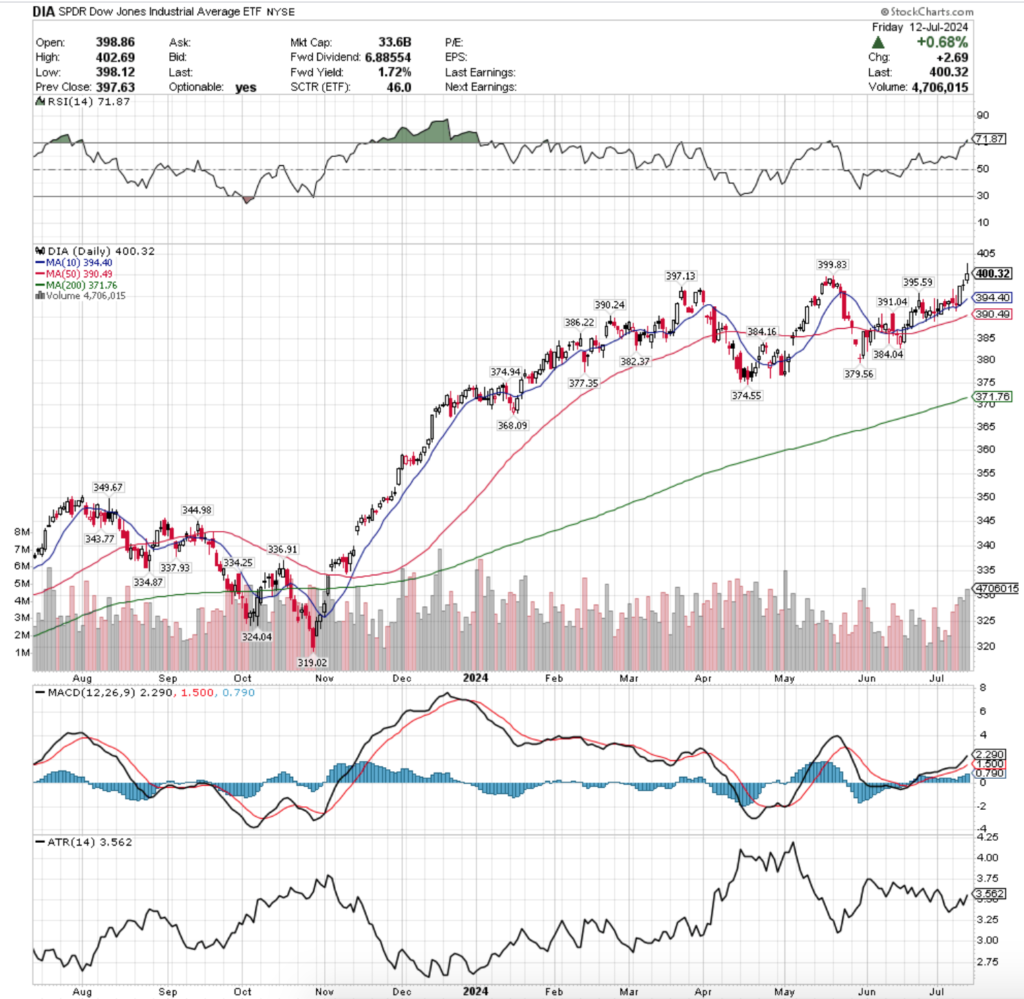
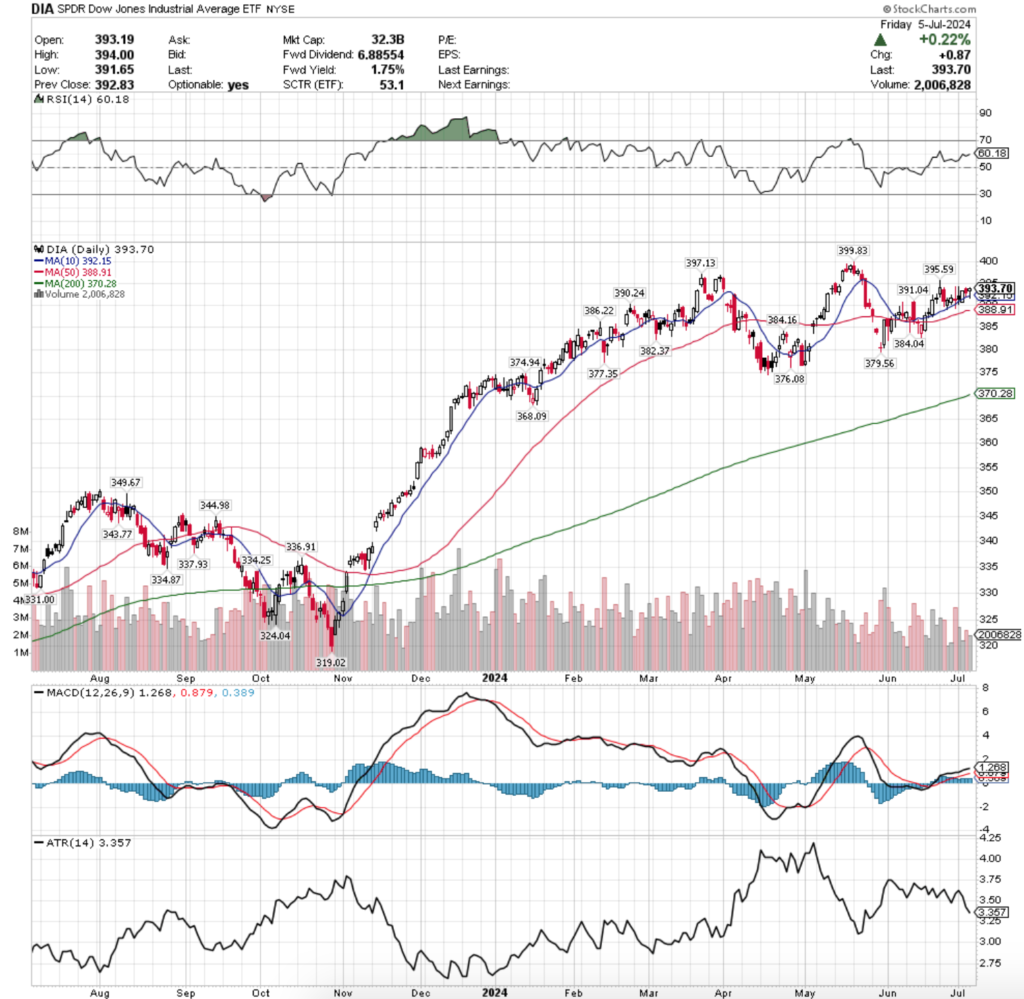
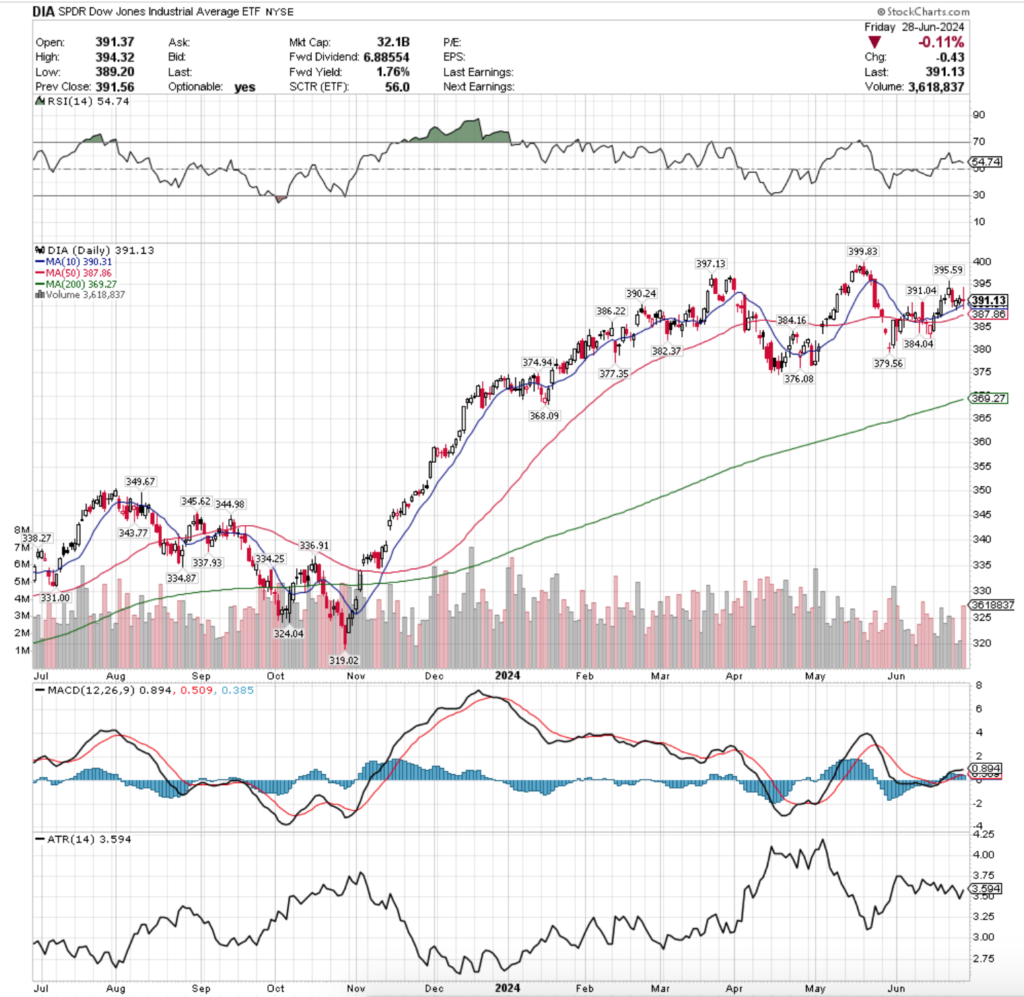
DIA, the SPDR Dow Jones Industrial Average ETF had the strongest week of the major four indexes, advancing +1.06% for the week as the blue chip names weathered the semiconductor storm fallout the best.

DIA ETF - SPDR Dow Jones Industrial Average ETF's Technical Performance Over The Past Year
DIA ETF – SPDR Dow Jones Industrial Average ETF’s Technical Performance Over The Past Year

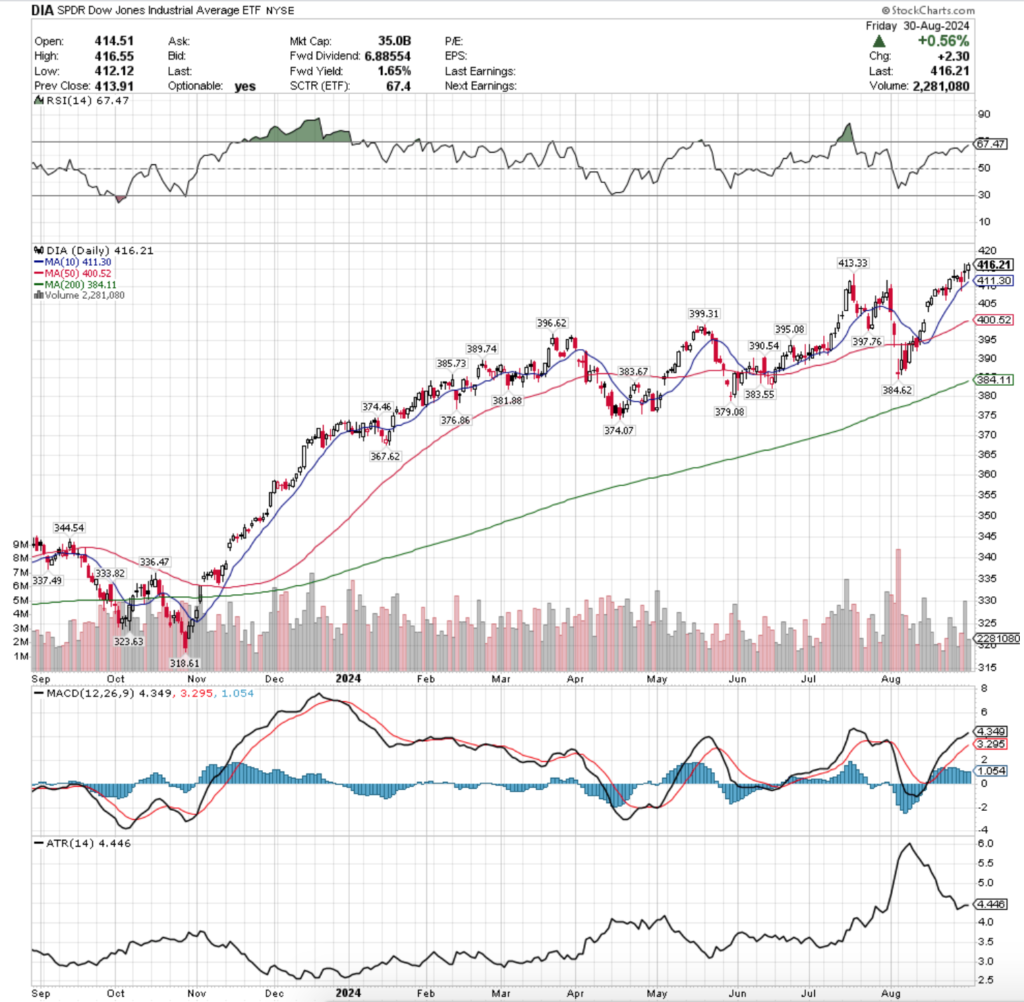
Their RSI is trending towards overbought conditions & sits at 67.47, while their MACD is still bullish, but beginning to look overextended & their histogram is weakening, indicating that there is likely a bearish crossover coming by Thursday of this week.

Volumes were -15.72% below the past year’s average volume (2,978,636 vs. 3,525,088), as DIA has managed to maintain the closest semblance of normal volumes of the major four index ETFs all year, while the others have waned.

DIA closed the week out at a new all-time high, but the path to get there was certainly filled with uncertainty.

Aside from Thursday which eclipsed the rest of the week’s volumes their trading volumes were unremarkable, and given the way Thursday’s candle closed out as a high wave spinning top that closed lower than it opened, it appears a lot of people were taking profits there & that the bull run up is in jeopardy.

The long lower shadow on Friday’s candle also gives off that sentiment, especially when paired with the second lowest volumes of the week.

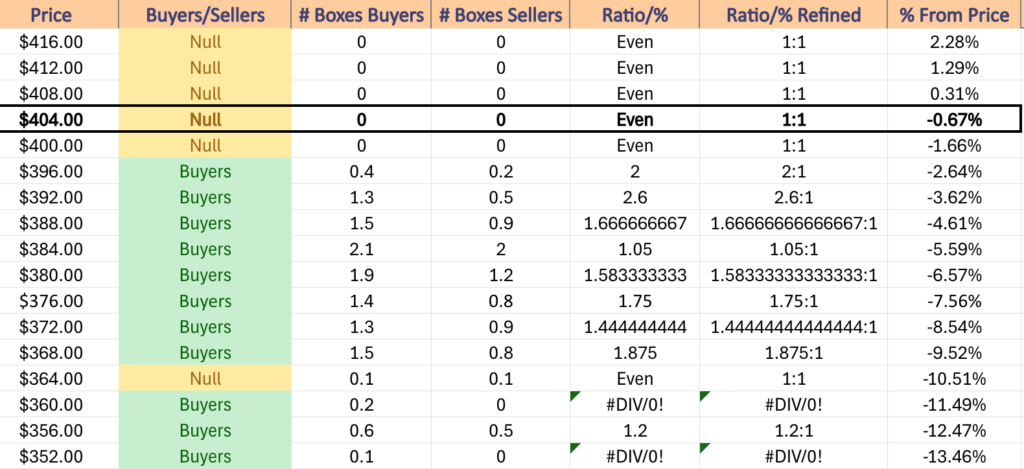
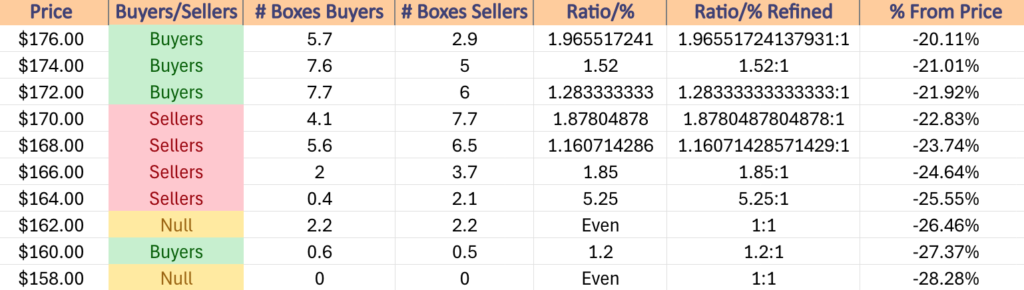
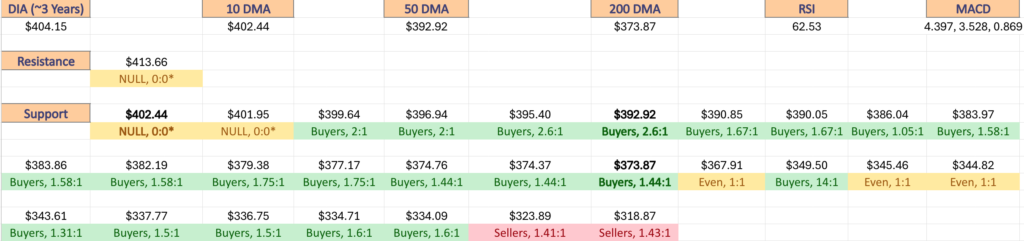
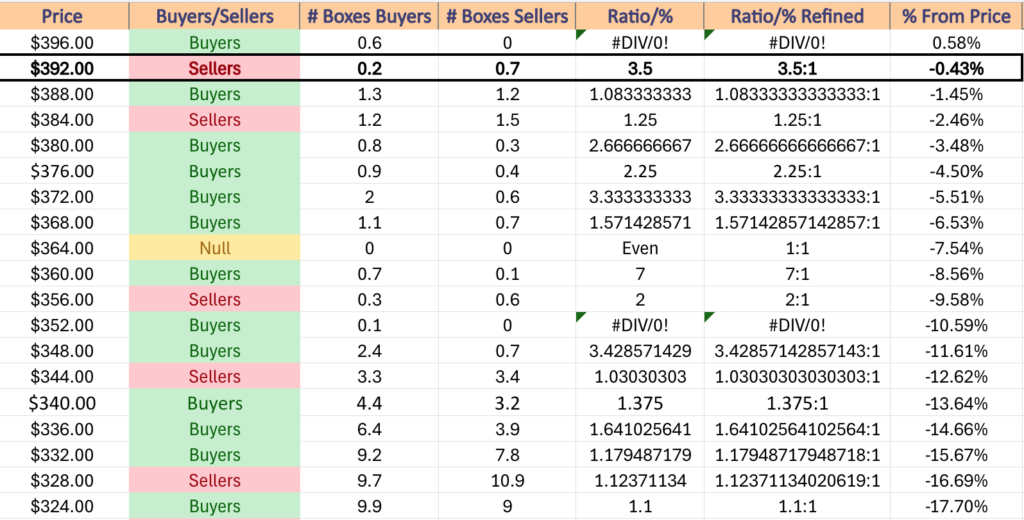
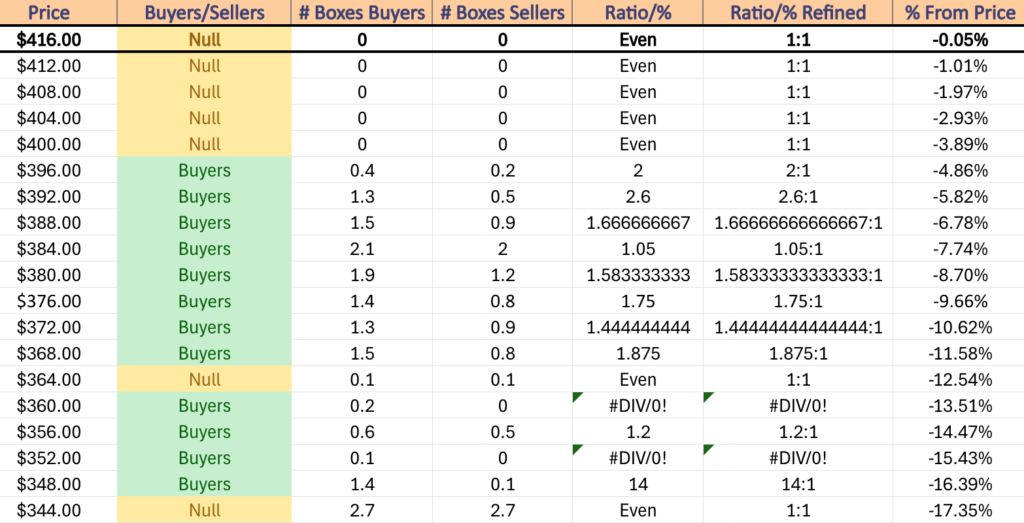
While there is a cluster of support levels not too far down from DIA’s current price, the same moving average relationships & strength of sentiment at different price levels will be what to watch in the coming week, along with what the current week’s volumes do.

DIA may have lost the least amount of average volume of the major four index ETF’s we’ve compared here, but given that it was so highly concentrated just on being from Thursday it is hard to say that this is a sign of strength.

If this continues into this week it should be a reason for investors to be looking at markets with a very skeptical eye & be viewed as a signal of a lack of confidence overall.

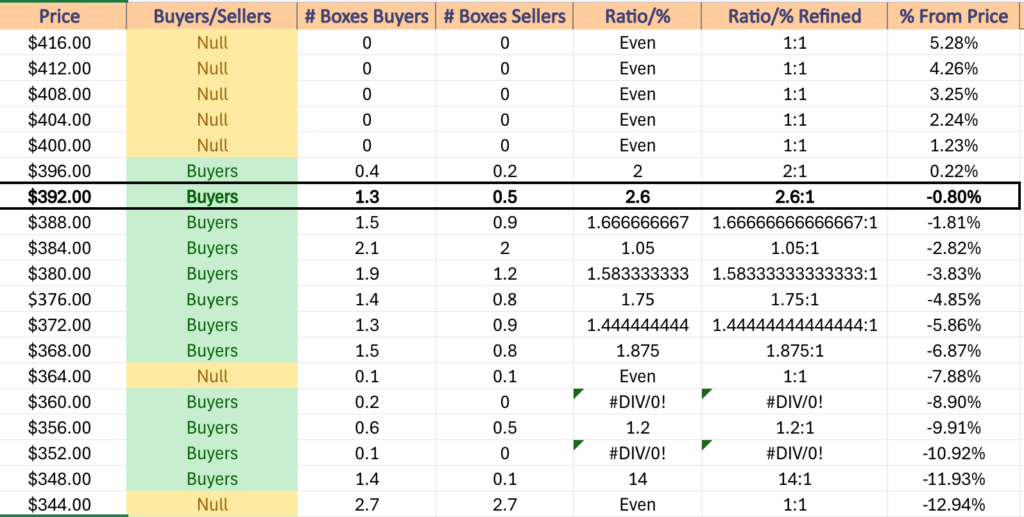
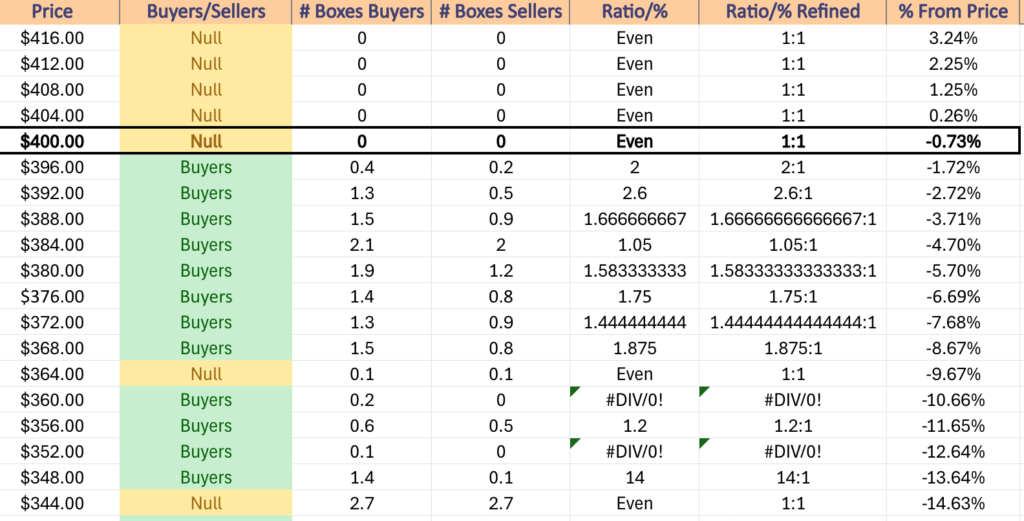
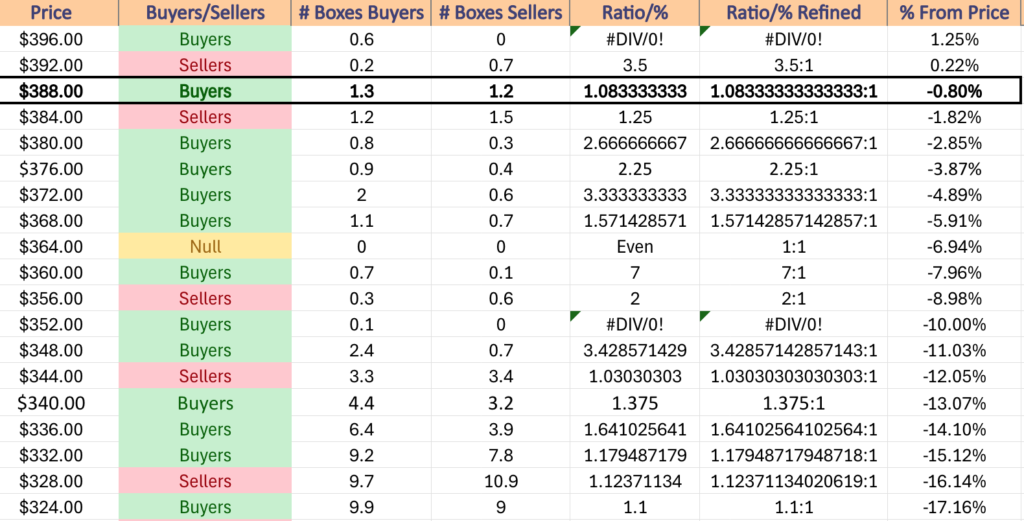
DIA has support at the $413.33 (Volume Sentiment: NULL, 0:0*), $411.30 (10 Day Moving Average, Volume Sentiment: NULL, 0:0*), $400.52 (50 Day Moving Average, Volume Sentiment: NULL, 0:0*) & $399.31/share (Volume Sentiment: Buyers, 2:1) price levels, with resistance at the $416.55/share (All-Time High, Volume Sentiment: NULL, 0:0*) price level.

DIA ETF's Price Level:Volume Sentiment Over The Past 3-4 Years
DIA ETF’s Price Level:Volume Sentiment Over The Past 3-4 Years

The Week Ahead

There are no major economic data announcements or earnings reports on Monday as it is Labor Day in the U.S.

S&P Final U.S. Manufacturing PMI is announced Tuesday at 9:45 am, followed by Construction Spending & ISM Manufacturing data at 10 am.

Hello Group reports earnings Tuesday morning, with GitLab, PagerDuty & Zscaler reporting after the closing bell.

Wednesday begins with U.S. Trade Deficit data at 8:30 am, followed by Job Openings & Factory Orders data at 10 am & the Fed’s Beige Book at 2pm.

Dick’s Sporting Goods, Dollar Tree, America’s Car Mart, Ciena, Core & Main, Hormel Foods, REV Group & Torrid all report earnings before Wednesday’s opening bell, with AeroVironment, C3.ai, Casey’s General, ChargePoint, Copart, Couchbase, Credo Technology Group, Descartes, Hewlett Packard Enterprise, Phreesia, Sprinklr, Verint Systems & Yext all scheduled to report earnings after the closing bell.

ADP Employment, Initial Jobless Claims & U.S. Productivity (revision) data all come out Thursday at 8:30 am, with S&P final U.S. Services PMI data coming out at 9:45 am & ISM Services data at 10 am.

Thursday kicks off with earnings from Korn Ferry, Nio, Science Applications International, Shoe Carnival & The Toro Company, with Broadcom, Argan, Braze, DocuSign, Guidewire Software, Smartsheet, Smith & Wesson Brands, UiPath, Veradigm & Zumiez due to report after the session’s close.

U.S. Employment Report, U.S. Unemployment Rate, U.S. Hourly Wages & Hourly Wages Year-over-Year are all released Friday at 8:30 am, followed by New York Fed President Williams speaking at 8:45 am.

Friday morning’s earnings reports include ABM Industries, Brady, BRP Inc. & Genesco.


See you back here next week!

*** I DO NOT OWN SHARES OR OPTIONS CONTRACT POSITIONS IN SPY, QQQ, IWM OR DIA AT THE TIME OF PUBLISHING THIS ARTICLE ***

Weekly Stock & ETF Market Review 8/18/2024

SPY, the SPDR S&P 500 ETF gained +4% this past week, although volumes became heavily muted again, while the VIX closed the week at 14.8, indicating an implied one day move of +/-0.93% & a one month implied move of +/-4.28%.

SPY ETF - SPDR S&P 500 ETF's Technical Performance Over The Past Year
SPY ETF – SPDR S&P 500 ETF’s Technical Performance Over The Past Year

Their RSI has recently flattened out after climbing up to 59.6, while their MACD has crossed over bullishly in the wake of the run up of the past couple of weeks.

Volumes were dismal, coming in -32.36% below average for the week vs. the previous year (47,394,583 vs. 70,064,027), which as noted last week is even lower than what it appears, given that last week’s average annual volume (70,443,801) is -9.54% less than what the annual average volume was on 3/31/2024 (77,829,780).

Due to the low volumes since May dragging the average down this average volume is -39.1% down from March of 2024’s average, indicating a severe lack of participation that while summer vacations may explain some of, is still not a sign of overall confidence in stocks at these price levels.

Monday began SPY’s week on a note of uncertainty, as the session opened above the resistance of the 10 day moving average, it fluctuated around it all day before closing below it’s opening price, just above the 10 DMA’s support on very low volume.

Tuesday opened with a gap higher that never tested the 50 day moving average’s resistance, but was a wide range session that moved just beneath it by the close.

Tuesday’s volume was higher than Monday’s & the second highest of the week, but was still unremarkable when compared to the average volume statistics noted above.

Wednesday’s session was interesting, as the day opened higher, retraced down ~25% of Tuesday’s candle’s real body, while also testing & briefly breaking above the resistance of the 50 day moving average, before ultimately closing slightly higher near the 50 DMA.

What made Wednesday’s session even more interesting was that the volume was also very low like Monday’s, the session closed by the 50 DMA & the resulting candlestick was a hanging man (bearish).

Things got more interesting Thursday, when on the week’s highest volume SPY gapped dramatically higher & based on the size of the upper & lower shadows of the day’s candle, did not stray much higher or lower than the day’s opening & closing prices.

The week closed on another light volume day (middle of the five days) with Friday opening near the top third of Thursday’s candle, not testing much lower, before advancing to close +0.22% for the day.

As has been noted for the last few weeks, paying attention to volume flows will be particularly important in the coming week(s), as while prices are moving upwards, there has been such limited participation that it is difficult to see price action reflecting true bullish sentiment.

The “Adam” scallop formed during August does not reflect anything that looks confidently bullish, and with the low participation rates we’ve been seeing now for months it is difficult to see enough strength being generated to force any major upwards movements that challenge/break past the all-time SPY high from July.

The coming week features the July FOMC minutes being released on Wednesday, more earnings reports & Fed Chair Powell speaking on Friday at Jackson Hole, making it very likely that we’re looking at one final squeeze before a long couple of months.

It is also worth noting that SPY does not often gap up twice in 10 days without some form of consolidation/losses in the very near-term, which is something that should be kept in mind moving into the new week.

While SPY’s MACD is bullish, it is at the steepest incline since the end of October/early November 2023, back when volumes were much higher than they’ve been for the past few months.

This raises a skeptical brow when looking at recent results given that the low participation rate means that there is not much fuel pushing prices higher.

Wednesday & Friday will be interesting days to watch, particularly as their RSI continues to reach higher & inch closer towards overbought conditions.

Also, on the news/earnings front it is important to note that NVDA will be reporting next week, which if it doesn’t impact volumes in the meantime for SPY will show that the markets are currently running on fumes.

It’s tough to see a stab taken again at breaking the all-time high price in the near-term, particularly as while SPY broke above the $554.87/share resistance point briefly on Friday, it retreated back towards it by the close to close below it.

SPY has support at the $544.60 (50 Day Moving Average, Volume Sentiment: Sellers, 1.22:1), $537.45 (Volume Sentiment: Buyers, 0.7:0*), $534.83 (10 Day Moving Average, Volume Sentiment: Buyers, 1.5:1) & $531.35/share (Volume Sentiment: Buyers, 1.5:1) price levels, with resistance at the $554.87 (Volume Sentiment: Buyers, 2:1) & $565.16/share (All-Time High, Volume Sentiment: NULL, 0:0*) price levels.

SPY ETF's Price Level:Volume Sentiment Over The Past 1-2 Years
SPY ETF’s Price Level:Volume Sentiment Over The Past 1-2 Years

QQQ, the Invesco QQQ Trust ETF advanced +5.47% last week, as investors most eagerly piled into the technology heavy index (figuratively, as volumes were still very low).

QQQ ETF - Invesco QQQ Trust ETF's Technical Performance Over The Past Year
QQQ ETF – Invesco QQQ Trust ETF’s Technical Performance Over The Past Year

Their RSI has also flattened out after advancing for the past two weeks & currently sits at 57.05, while their MACD is bullish after crossing the signal line on Wednesday.

Volumes were -18.76% below the previous year’s average (35,824,206 vs. 44,097,003), indicating that the near-term risks outlined in SPY above are also impacting QQQ & should be though about while analyzing the current state of the market.

When comparing this past week’s volume to that of 3/31/2024 it is -27.3% lower (vs. 49,253,412), which throws out any idea of the current market environment being strong.

Monday the week began with the lowest volume of the week, & on a note of uncertainty, as the day closed in a long-legged doji that opened & closed above the 10 day moving average’s support, but also tested below it.

Bulls proved to be the winners on Tuesday though, when the week’s highest volume propelled QQQ to a gap up session that only tested higher as the day wore on.

Volume dipped a little bit on Wednesday, which despite being much higher than Monday’s levels gave off a bearish feeling as the session ended as a hanging man candle that closed below it’s open after opening on a gap up.

Thursday produced another gap up & the third highest volume of the week, which while like Tuesday also did not test much higher above or below the open or close, was able to break above & close above the resistance of the 50 day moving average.

Friday closed the week out on a note of further uncertainty/reason for skepticism, as despite having the week’s second highest volume, the day opened in line with the 50 day moving average, tested lower & higher before settling higher into an uncertain spinning top candle that’s straddling the 50 DMA.

Given the events of the coming week or two that adds to the idea of the last attempt at a pump before disappointment keeps a new all-time high from being established for QQQ.

As volume continues to be a main point of interest & SPY & QQQ’s charts are still highly similar we’ll focus more on the current positioning of QQQ’s moving averages to look at in addition to their volume (also applicable to SPY).

4.76% separate QQQ’s 10 & 50 day moving averages, with the 10 DMA having curled upwards on Wednesday.

-4.39% to the south of QQQ’s 10 DMA lies its 200 DMA, while prices on Friday closed only +0.39% above the 50 DMA’s support.

Prices have now been condensing & drawing the three moving averages & price closer together during a period of low volume.

While the volume doesn’t exactly align, QQQ’s one year daily chart may serve as a good reference from this time last year, as in the event that the 10 DMA crosses above the 50 DMA with the low volumes, it is likely to see similar price action as mid-September 2023.

This becomes even more interesting when the RSI is tossed into the mix, as it currently is in the same neighborhood that it was in about a year ago.

It is also worth noting that since the decline that began in July QQQ has not set any new support levels that are underneath the current price action, indicating that there is not much recent strength.

While the gaps & their upside/downside extremes can be viewed as support & resistance, this ties into the rapid rate of ascent that we’ve watched likely being unsustainable & done in precaution of declines in order to scrape out a handful of extra points to the upside from folks willing to hop back into the pool at these levels.

QQQ has support at the $473.43 (50 Day Moving Average, Volume Sentiment: Buyers, 2.5:1), $459.85 (Volume Sentiment: Buyers, 0.9:0*), $453.43 (10 Day Moving Average, Volume Sentiment: Buyers, 1.62:1) & $448.63/share (Volume Sentiment: Sellers, 2.3:0*) price levels, with resistance at the $475.55 (Volume Sentiment: Buyers, 2.5:1) & $503.52/share (All-Time High, Volume Sentiment: Buyers, 0.4:0*) price levels.

QQQ ETF's Price Level:Volume Sentiment Over The Past 1-2 Years
QQQ ETF’s Price Level:Volume Sentiment Over The Past 1-2 Years

IWM, the iShares Russell 2000 ETF climbed +2.97% last week, mostly due to the gap up on Thursday.

IWM ETF - iShares Russell 2000 ETF's Technical Performance Over The Past Year
IWM ETF – iShares Russell 2000 ETF’s Technical Performance Over The Past Year

Their RSI has also begun to flatten out at 52.68, while their MACD is still in bearish territory but looks set to bullishly cross the signal line in the coming day or two.

Volumes were -17.96% below average last week compared to the year before’s average (28,824,348 vs. 35,133,049), which while it indicates weakness in the near-term is a testament of the sturdiness of IWM & its components.

Using the 3/31/2023 comparison date, current average annual volumes are +0.07% higher (3/31/2024’s avg. annual volume was 35,133,049), which is far more robust than SPY & QQQ.

This likely is primarily attributed to the lack of exposure that IWM has to NVDA & the semiconductor stocks, as well as the other artificial intelligence & data center components.

IWM’s volumes have remained relatively consistent over the past year, with random fluctuations that went both to the upside & downside here & there; however the recent low volumes should be viewed the same as those of SPY & QQQ in terms of poor participation equaling poor sentiment & weakness.

Monday kicked off IWM’s week on a bearish note & weak volume, before Tuesday was able to open higher, tested most of Monday’s range to the downside, before rallying higher & closing at the point where the 10 & 50 day moving average’s were meeting.

Wednesday is when the 10 DMA officially crossed below the 50 DMA, which was interesting as the session opened on a gap up above both, only to test back below the 10 DMA’s support before ultimately closing in line with it.

Thursday threw a wildcard into the mix, when the week’s highest volume came about on a gap up session that resulted in a high wave spinning top, indicating that although there was a lot of movement, in the end it resulted in a high degree of uncertainty.

While the bullish won due to the advance, it was not without a challenge & there is still a bit of downside/bearish sentiment out among market participants.

Friday’s candle is not a shooting star (bearish), but certainly looks like one if its real body was smaller.

The upper shadow does indicate that there is not much more upside appetite for IWM from the current price levels, although that could be changed if there was more upside volume in the next week or so, but the current picture is not painting that to be likely.

For IWM, it would be wise to watch the support & resistance levels & their historic volume sentiment this coming week, as they tend to fluctuate around price levels more often than SPY & QQQ.

In the event that the 10 DMA bullishly crosses the 50 DMA, if there is not sufficient volume behind the movement then there is still reason to be near0-term skeptical, particularly due to all of the events on the near-term horizon.

IWM has support at the $211.29 (Volume Sentiment: Buyers, 2.4:0*), $209.29 (Volume Sentiment: Buyers, 2.4:0*), $209.19 (Volume Sentiment: Buyers, 2.4:0*) & $208.38/share (50 Day Moving Average, Volume Sentiment: Buyers, 2.4:0*) price levels, with resistance at the $215.38 (Volume Sentiment: NULL, 0:0*), $226.64 (Volume Sentiment: NULL, 0:0*) & $228.63/share (52-Week High, Volume Sentiment: NULL, 0:0*) price levels.

IWM ETF's Price Level:Volume Sentiment Over The Past 1-2 Years
IWM ETF’s Price Level:Volume Sentiment Over The Past 1-2 Years

DIA, the SPDR Dow Jones Industrial Average ETF had the weakest week of the major four index ETFs, adding only +2.93%, despite having the sturdiest volume of the bunch.

DIA ETF - SPDR Dow Jones Industrial Average ETF's Technical Performance Over The Past Year
DIA ETF – SPDR Dow Jones Industrial Average ETF’s Technical Performance Over The Past Year

Their RSI is still advancing & sits at 60.39, while their MACD crossed the signal line bullishly on Friday.

Volumes were -3.47% below the prior year’s average (3,438,955 vs. 3,562,534), as blue chip names have maintained strength over the past year compared to the components of other indexes.

Monday was the week’s only bearish day, which also came on the lowest volume session of the week, where prices opened higher but below the 10 DMA’s resistance, before ultimately testing lower & closing below the 50 DMA’s support.

Prices also tested lower than the closing price, indicating that there was more appetite for lower prices, but the bulls were able to squeak out only a minor loss.

Tuesday had the third highest volume of the week, opening by Monday’s open, testing a little bit lower below the support of both moving averages before rallying higher & closing at about its daily high price.

Wednesday the march higher continued on the week’s highest volume before Thursday & the week’s second highest volume resulted in a gap up open.

Thursday did test lower before ultimately becoming an advancing session, while Friday also resulted in a +0.29% advance, but on the second lowest volume of the week, indicating a “soft” risk off Friday.

Due to the relatively constant demand for DIA components they may weather any near-term storms the best of the major index ETFs, but are still not subject to the same concerns outlined in the sections above.

While the 10 DMA crossing the 50 DMA bullishly is imminent in the next day or so, the focus on DIA should be on volume, particularly the strength of volume at support & resistance levels.

There is a large buildup of support levels in the wake of the consolidation period that began January 2024 & has shown DIA oscillate around since which may help prevent much bleeding, but without a good deal of higher volume any moves to the upside will not be convincing without extensive confirmation.

Given that DIA is <2% from their all-time high, this should be given consideration.

DIA has support at the $399.31 (Volume Sentiment: Buyers, 2:1), $397.76 (Volume Sentiment: Buyers, 2:1), $396.62 (Volume Sentiment: Buyers, 2:1) & $395.70/share (50 Day Moving Average, Volume Sentiment: Buyers, 2.6:1) price levels, with resistance at the $411.68 (Volume Sentiment: NULL, 0:0*) & $413.33/share (All-Time High, Volume Sentiment: NULL, 0:0*) price levels.

DIA ETF's Price Level:Volume Sentiment Over The Past 3-4 Years
DIA ETF’s Price Level:Volume Sentiment Over The Past 3-4 Years

The Week Ahead

Next week is relatively slow on the economic data front, beginning Monday with U.S. Leading Economic Indicators at 10 am.

Monday morning opens with earnings from Estee Lauder before the opening bell, followed by Fabrinet & Palo Alto Networks after the session’s close.

Tuesday features a speech from Atlanta Fed President Bostic at 1:35 pm.

Lowe’s, Amer Sports, Kingsoft Cloud, Medtronic, Premier & VIP Shop all report earnings Tuesday morning before the opening bell, with Coty, Keysight Technologies, La-Z-Boy, Toll Brothers & ZTO Express due to report after the closing bell.

Minutes of the Fed’s July FOMC meeting are released at 2pm on Wednesday.

Wednesday’s earnings calls begin with Target, Analog Devices, Dycom, Macy’s & TJX before the session’s opening bell, with Agilent Technologies, Nordson, Snowflake, Sociedad Quimica y Minera, Synopsys, Urban Outfitters, Wolfspeed & Zoom Video Communications all due to host their earnings calls after the session closes.

Thursday is a little busier, with Initial Jobless Claims at 8:30 am, S&P Flash U.S. Services PMI & S&P Flash U.S. Manufacturing PMI data at 9:45 am & Existing Home Sales at 10 am.

Advance Auto Parts, Bilibili, BJ’s Wholesale, Canadian Solar, Lancaster Colony, Peloton Interactive, Toronto-Dominion Bank, Viking Holdings & Weibo begin Friday’s earnings calls, with Intuit, Alcon, Bill.com, CAVA Group, Ross Stores & Workday all reporting after the session’s closing bell.

Friday features New Homes Sales data at 10 am & Fed Chair Powell is expected to speak at the Jackson Hole retreat & Buckle will report earnings before the session’s opening bell.

See you back here next week!

*** I DO NOT OWN SHARES OR OPTIONS CONTRACT POSITIONS IN SPY, QQQ, IWM OR DIA AT THE TIME OF PUBLISHING THIS ARTICLE ***

Weekly Stock & ETF Market Review 8/11/2024

SPY, the SPDR S&P 500 ETF barely budged last week despite volumes returning, as it gained +0.02% for the week, while the VIX closed at 20.37, indicating an implied one day movement of +/-1.28% & a one month implied move of +/-5.89%.

SPY ETF - SPDR S&P 500 ETF's Technical Performance Over The Past Year
SPY ETF – SPDR S&P 500 ETF’s Technical Performance Over The Past Year

Their RSI is trending back towards the neutral level of 50 & currently sits at 45.29, while their MACD is still bearish, but is moving towards the signal line.

SPY’s MACD will be an area to keep a watch on this week, as the histogram reading is still not showing weakness relative to other days since it’s bearish crossover & the past Tuesday, Thursday & Friday’s bullish sessions are n0t convincing of strength, meaning that the MACD line may not reach the signal line next week to cross over bullishly.

Volumes were +16.58% above average last week compared to the prior year (82,123,380 vs. 70,443,801), which was a welcome change after months of subpar weekly volumes.

It should be noted though that due to the months of below average volume since April enough of that calculation has changed that the annual average volume today is -9.54% compared to what it was in March 31, 2024’s Market Review note (77,829,780 vs. 70,443,801 today), which means that there is still a lot of caution being taken & a lack of confidence.

Last week we noted that volumes would be the determining factor in how to read last week’s trade & think of what direction the market may venture in next & seeing this still relatively weak volume in a week with three bullish sessions is cause for concern.

Monday kicked the week off on a gloomy note, with a ~4% gap down on the highest volume of the past 52-weeks.

While the silver lining is that there was a recovery of sorts during the session & the day closed higher than it opened, the bulls proved to be nowhere near in control at any point of the day.

It did manage to open up the opportunity for SPY to climb in the short-term after the steep decline for a few sessions to enable their oscillators & indicators to recalibrate before the day of reckoning with the 10 day moving average’s resistance comes.

Tuesday saw the week’s second highest volume on an advancing day, but had there been a prior uptrend before it the candle may also be judged as a shooting star (bearish), as much like Monday, Tuesday’s SPY candle had an even longer upper shadow, signaling that the bulls were yet again not in control.

Wednesday threw a bit of a head-fake, gapping up on the open & testing higher before ultimately crashing down on a wide-range day between the open & closing price that resulted in a bearish decline that closed below Tuesday’s open.

While Tuesday had higher volume than Wednesday, Wednesday had the third highest volume of the week & bearishly engulfed Tuesday’s candle in a dramatic fashion, indicating that there is hunger both higher & lower than Tuesday’s price action for SPY.

This brings us to where I’ve been telling people for the past week to pay attention to, what happens once price gets a scent of the 10 DMA’s resistance.

Thursday managed to open mid-way through Wednesday’s candle’s real body range, but was unable to at any point in time trade above Wednesday’s high price & volume began to look like the “above average” days of the past few months, which as noted before were very weak in terms of volume.

Friday told an even gloomier tale, as prices opened at about the close of Thursday’s session, & stated in a relatively tight range below the 10 DMA (although they did briefly tick above it, but not by much).

Friday’s volume was also towards the low end of the past few month’s daily volume readings, which is not a reason for excitement heading into a new week, particularly with earnings from Home Depot & Walmart that will shed light into the state of U.S. consumers, but also PPI (Tuesday) & CPI (Wednesday) which will give more clarity about the state of US inflation.

While the day did not end in a spinning top, the small range of the day’s real body still tells a tale of uncertainty on the part of market participants.

The tight nature of the week’s ascent is also something to note, as it does not paint a picture of strength, but rather more of one of uncertainty, some covering & rebalancing & perhaps a few small profit squeezes.

Last week’s message about the importance of volume carries over into this week as well & will remain more important than daily price changes in the near-term, especially given the important data just mentioned above that we will be getting regarding the strength of consumers.

Lower participation when the price is below the 10 & 50 DMA’s resistance is a recipe for continued declines, or a consolidation within the range of Wednesday’s real body in the event of decent enough news/earnings results or for more, steeper declines in the event of poor results.

Another area to keep an eye on this week is the $525-529.99 price range, as it historically over the past 1-2 years has been dominated by Buyers at a rate of 5.6:1, but currently has no support levels in that window.

While buyers have often come out in droves here, it has no foothold in terms of support levels, making the $522.92 the next level of support (once $531.35/share is passed through).

This may be problematic as Sellers have dominated that area 1.38:1 over the same time period, and with the exception of $515-519.99, the rest of the way down to $496/share is either even 1:1 ($510-514.99/share) else seller dominated until $495.99/share.

Should $565.16/share be the head of a bearish head & shoulders forming, that would match the math & length of time between the left shoulder & the head where there are support levels at $497.94 & $492.27).

To reach the lower of those two support levels would be a decline of ~7.6% from where Friday closed.

It will also be worth keeping an eye on SPY’s Average True Range to see if the range becomes expanded in the face of more volatility.

As for the upside, the $540-544.99/share range is seller dominated 1.22:1 in the past 1-2 years, which is where the 50 day moving average’s resistance currently sits.

Should prices break above the 10 DMA & become wedged between the 10 & 50 DMAs the volume levels of each day in relation to their move will also be the telltale as to where things may be heading in the near-term & be just as important to watch as if in decline.

SPY has support at the $531.35 (Volume Sentiment: Buyers, 1.5:1), $522.92 (Volume Sentiment: Sellers, 1.38:1), $516.69 (Volume Sentiment: Buyers, 2.35:1) & $510.27/share (Volume Sentiment: Even, 1:1) price levels, with resistance at the $533.53 (10 Day Moving Average, Volume Sentiment: Buyers, 1.5:1), $537.45 (Volume Sentiment: Buyers, 0.7:0*), $542.71 (50 Day Moving Average, Volume Sentiment: Sellers, 1.22:1) & $554.87/share (Volume Sentiment: Buyers, 2:1) price levels.

SPY ETF's Price Level:Volume Sentiment Over The Past 1-2 Years
SPY ETF’s Price Level:Volume Sentiment Over The Past 1-2 Years

QQQ, the Invesco QQQ Trust ETF that tracks the NASQAQ 1000, fared slightly better than SPY & closed the week up +0.37% as the top two performing indexes of the week more or less tread water.

QQQ ETF - Invesco QQQ Trust ETF's Technical Performance Over The Past Year
QQQ ETF – Invesco QQQ Trust ETF’s Technical Performance Over The Past Year

Their RSI is trending back towards the neutral level of 50 & is currently at 42.62, while their MACD is similar to SPYs; bearish but based on the histogram it is uncertain as to whether or not the MACD line will actually cross bullishly over the signal line in the near-term.

Volumes were +29.64% above average last week compared to the previous year’s average volume (57,400,080 vs. 44,277,827), but much like SPY this doesn’t matter much, as using the 3/31/2024 article data their average volume has declined by -10.1% (was 49,253,412).

QQQ’s chart reads heavily similar to SPY’s, which is to be expected as the really on major difference over the past year has been that SPY ascended more rapidly & as a result has enjoyed having more local support levels than SPY, but for the most part they’ve behaved very similarly.

One major area of difference though that should be considered is that Monday’s gap down open was below QQQ’s 200 day moving average, indicating a severe lack of confidence in the index.

This is important as it signals both the clear lack of confidence in the NASDAQ 100 component companies, but also historically once that’s been crossed over via a daily candle chart in almost all instances that has predicted future near-term declines (using past decade chart).

With this in mind, the volumes will continue to be an area of keen focus for the coming week with QQQ.

Given how the rest of the week for QQQ was almost a mirror or SPY in terms of the volume & candlesticks I’ll spare the deep dive to focus on QQQ’s 10, 50 & 200 day moving averages.

QQQ’s 200 day moving average has a solid wall of buyers to keeping the price floated above it, but the strongest price level is $444-447.99/share, which places a spotlight on the $448.63/share support level, as if it breaks down there are no support levels in that price zone (where over the past 1-2 years Buyers have overpowered sellers 11.5:1).

Should that break down, we will at least see the 10 DMA bearishly cross the 200 DMA, if not a death cross of the 50 DMA also passing through it to the down side.

This week will be all about the volume again though, but the relationship between prices & these moving averages will also be more important than they were in last week’s note.

Their Average True Range has begun to turn down in the wake of last week’s “recovery” from Monday’s gap down, but in the face of higher volatility it will be worth noting how much higher it goes from here, as the high end of its range will need to expand.

QQQ has support at the $448.63 (Volume Sentiment: Sellers, 2.3:0*), $442.35 (Volume Sentiment: Buyers, 1.76:1), $437.86 (Volume Sentiment: Buyers, 1.25:1) & $430.58/share (200 Day Moving Average, Volume Sentiment: Buyers, 1.77:1) price levels, with resistance at the $450.91 (10 Day Moving Average, Volume Sentiment: Sellers, 2.3:0*), $459.85 (Volume Sentiment: Buyers, 0.9:0*), $472.07 (50 Day Moving Average, Volume Sentiment: Buyers, 2.5:1) & $475.55/share (Volume Sentiment: Buyers, 2.5:1) price levels.

QQQ ETF's Price Level:Volume Sentiment Over The Past ~2 Years
QQQ ETF’s Price Level:Volume Sentiment Over The Past ~2 Years

IWM, the iShares Russell 2000 ETF declined -1.18% last week, faring the worst of the major four index ETFs, as market participants shied away from small cap names.

IWM ETF - iShares Russell 2000 ETF's Technical Performance Over The Past Year
IWM ETF – iShares Russell 2000 ETF’s Technical Performance Over The Past Year

Their RSI is at 44.27 & currently sits flat in the wake of the declines of the past two weeks, while their MACD is bearish, and in a similar position to SPY’s & QQQ’s in terms of histogram bearish strength & the MACD line’s distance from the signal line being too far off to tell if there will be a bullish crossover or not.

Volumes were +3.02% above average compared to the previous year (36,169,400 vs. 35,108,235), which is interesting as unlike SPY & QQQ, IWM’s average volume has increased by +2.43% (34,276,900) since the 3/31/2024 post.

This has been heavily influenced by the high volumes IWM has experienced since mid-July, but is still worth noting given the other differences between the way SPY & QQQ have traded over the past year vs. IWM & DIA.

One interesting thing of note for IWM compared to QQQ is that Monday opened in a similar fashion in terms of a gap down, but the session’s low was supported by the 200 day moving average & then continued higher throughout the week until Wednesday it opened at the 50 day moving average’s resistance & took a similar tumble as the other major index ETFs.

Tuesday’s high wave candle also did not even come near the 50 DMA’s resistance on the upper shadow, indicating that there is still likely more appetite to the downside.

Thursday’s candle formed a bullish harami pattern with Wednesday’s previous wide-range bearish engulfing pattern, which based on the close being the high (or close to high, based on upper shadow) of the day & Friday’s hanging man candle seems to have been a false bullish flag.

Volumes were inconsistent though, as while three of the five sessions of the week were bearish, Friday’s risk-off into the weekend low volume hanging man candle is certainly a head scratcher for the coming week.

By Wednesday the 10 DMA will likely have crossed bearishly through the 50 DMA, which will cause both to put downward resistance pressure on IWM & begin to push its price into the support of the 200 DMA & the $196.70-198.60 support zone that has been established in 2024.

Another thing to note regarding IWM’s current price level is that the lower end of the range that they have oscillated around in for most of 2024 to date is currently ~9.7% below Friday’s closing price.

Support levels between the two prices are mostly in favor of the buyers, but should prices dip down into the $192-193.99/share level it will be a time to take caution, as over the past 1-2 years this range has been dominated by the Sellers at a rate of 3.79:1.

The good news is that if that $186.53 support level is tested, Buyers have been stronger than Sellers in that $186-187.99 range, at a rate of 4:1, although if that test comes there will be other considerations to take based on where moving averages are in relation to one another & price.

IWM has support at the $204.40 (Volume Sentiment: Buyers, 1.97:1), $202.47 (Volume Sentiment: Buyers, 1.13:1), $198.60 (Volume Sentiment: Buyers, 2.08:1) & $197.41/share (Volume Sentiment: Buyers, 1.25:1) price levels, with resistance at the $207.87 (50 Day Moving Average, Volume Sentiment: Buyers, 1.97:1), $209.19 (Volume Sentiment: Buyers, 2.4:0*), $209.29 (Volume Sentiment: Buyers, 2.4:0*) & $211.29/share (Volume Sentiment: Buyers, 2.4:0*) price levels.

IWM ETF's Price Level:Volume Sentiment Over The Past ~2 Years
IWM ETF’s Price Level:Volume Sentiment Over The Past ~2 Years

DIA, the SPDR Dow Jones Industrial Average ETF dipped -0.5% last week, having the second worst week of the major four index ETFs.

DIA ETF - SPDR Dow Jones Industrial Average ETF's Technical Performance Over The Past Year
DIA ETF – SPDR Dow Jones Industrial Average ETF’s Technical Performance Over The Past Year

Their RSI is flat like IWM’s, while sitting just below the neutral 50 mark & is currently at 47.4, while their MACD is in a similar boat to IWM’s as well, but slightly more horizontal.

Volumes were +29.8% above the prior year’s average volume (4,616,180 vs. 3,556,496), which like IWM is higher than their average annual volume reading from 3/31/2024 by +4.45% (3,405,069 from 3/31/2024).

This can also be largely attributed to the past month & a half’s performance, although DIA’s volume was one of the more consistent of the major four indexes over the past handful of months, as investors & traders showed favor to blue chip names.

One thing of interest for DIA that did not impact the other three indexes is that last week began & ended on notes of uncertainty, with spinning tops for both Monday & Friday’s session.

Monday’s volume towered over the rest of the week’s though, with Thursday having the lowest volume, followed by Friday.

Tuesday’s candle was a clear indicator that the bulls were not in charge & likely will not be heading into this coming week, as prices were able to advance up to the 50 day moving average before retreating back down to settle near $390/share.

Wednesday’s candle was not a bearish engulfing candle as it closed ~$0.20 above Tuesday’s open, but the similar levels of volume between the two days indicated that there was heavy profit taking.

Wednesday’s session also flirted with the 50 DMA but was unable to close anywhere near it, as investors hopped out of the pool.

Thursday opened in the middle of Wednesday’s price range & was able to close at the 50 DMA, setting up Friday to open the session on the 50 DMA.

While Friday was able to advance +0.16%, the low volume signals that the strength of the support at the 50 DMA is questionable at this time, despite the $392-395.99/share price level being Buyer dominated at a rate of 2.6:1 over the past few years.

DIA has a similar setup for support as IWM’s in terms of spending most of 2024 oscillating around a price range, making their near-term volumes even more important than usual, as market participants will be what determines the strength or weakness of these support & resistance levels.

Their 10 day moving average will likely cross over their 50 day moving average by mid-week bearishly, which will also apply downwards pressure on prices, but whether it will be outright declines due to bad data/earnings or a more gentle consolidation within the real body range of Wednesday’s candle has yet to be seen.

DIA has support at the $394.45 (50 Day Moving Average, Volume Sentiment: Buyers, 2.6:1), $390.85 (Volume Sentiment: Buyers, 1.67:1), $390.05 (Volume Sentiment: Buyers, 1.67:1) & $386.04/share (Volume Sentiment: Buyers, 1.05:1) price levels, with resistance at the $395.40 (Volume Sentiment: Buyers, 2.6:1), $396.94 (Volume Sentiment: Buyers, 2.6:1), $397.60 (Volume Sentiment: Buyers, 2.6:1) & $399.64/share (Volume Sentiment: Buyers, 2.6:1) price levels.

DIA ETF's Price Level:Volume Sentiment Over The Past 3-4 Years
DIA ETF’s Price Level:Volume Sentiment Over The Past 3-4 Years

The Week Ahead

Monday starts off on a quiet note in terms of economic data, with the Monthly U.S. Federal Budget data at 2pm.

Ballard Power, Esperion Therapeutics, Fortrea, KE Holdings & Monday.com all report earnings before Monday’s opening bell, followed by Alcon, DHT, Kodiak Gas Services, PACS Group & Rumble after the session’s close.

NFIB Optimism Index data is released Tuesday morning at 6 am, followed by Producer Price Index, Core PPI, PPI Year-over-Year & Core PPI Year-over-Year data at 8:30 am.

Tuesday morning begins with earnings from Home Depot, Hudbay Minerals, Hut 8 Mining, HUYA, IHS Holding Limited, James Hardie, Loar Holdings, Melco Resorts & Entertainment, Mersana Therapeutics, MSG Sports, ON Semiconductor, Paysafe, Sea Limited, Sun Life, Talen Energy & Tencent Music, with Duos Technologies Group, Franco-Nevada, Ibotta, Intapp, Kyverna Therapeutics, Mercury, NCR Atleos, NeuroPace, Nu Holdings, U.S. Physical Therapy & XP all reporting after the session’s close.

Wednesday morning at 8:30 am brings us Consumer Price Index, CPI Year-over-Year, Core CPI & Core CPI Year-over-Year.

Arcos Dorados, Brinker International, CAE, Cardinal Health, Dole, Global-E Online, Marex Group, Performance Food Group, Riskified, SFL Corp, Smith Douglas Homes, UBS & Workhorse Group are due to report earnings Wednesday morning, with Cisco Systems, dLocal Limited, Lumentum, Paycor & StoneCo all due to report after the closing bell.

Initial Jobless Claims, Empire State Manufacturing Survey, Philadelphia Fed Manufacturing Survey, U.S. Retail Sales, Retail Sales minus Autos, Import Price Index & Import Price Index Minus Fuel data are all released at 8:30 am on Thursday, Industrial Production & Capacity Utilization data are announced at 9:15 am & Business Inventories data is released at 10 am.

Thursday morning’s earnings calls include Walmart, Alibaba Group Holding, Applied Industrial, Cellebrite, Grab Holdings, NICE, SpartanNash & Tapestry, before Amcor, Applied Materials, Coherent, H & R Block & Ross Stores report after the closing bell.

Friday morning kicks off with Housing Starts & Building Permits data at 8:30 am, followed by Consumer Sentiment (prelim) & Home Builder Confidence Index data at 10 am.

Flower Foods & CI&T report earnings Friday before the opening bell.

See you back here next week!

*** I DO NOT OWN SHARE OR OPTIONS CONTRACT POSITIONS IN SPY, QQQ, IWM OR DIA AT THE TIME OF PUBLISHING THIS ARTICLE ***

Weekly Stock & ETF Market Review 8/4/2024

SPY, the SPDR S&P 500 ETF fell -2.12% last week, while the VIX closed the week at 23.39, implying a one day move of +/-1.47% & a one month move of +/-5.04%, as market volatility increased as SPY’s Average True Range shows.

SPY ETF - SPDR S&P 500 ETF's Technical Performance Over The Past Year
SPY ETF – SPDR S&P 500 ETF’s Technical Performance Over The Past Year

Their RSI is currently trending towards oversold levels & sits at 38.81, while their MACD continues its bearish freefall of the last couple of weeks.

Volumes were -11.6% lower than the previous year’s average level (62,220,620 vs. 70,382,825), which has continued to be a cause for concern given the declining volume, as the two highest volume sessions of last week came on declining days.

Monday kicked SPY’s last week off with a bearish sentiment, opening on a gap up from Friday’s close that tested higher, but ultimately closer lower than it opened.

Wedged between the 10 & 50 day moving averages it tested lower towards the 50 DMA more closely than it did to the upside at the 10 DMA & Monday’s session had the lightest volume of the week.

Tuesday the bearishness continued, as the session opened between the 10 & 50 DMA again, tested to the upside where the 10 DMA’s resistance denied it, tested to the downside & temporarily broke out below the support of the 50 DMA, before finally closing just above the 50 DMAs support.

Low volumes also plagued Tuesday’s session, before market participants began coming out more strongly on Wednesday through the rest of the week.

Wednesday was won by the bulls, but the bears were still out in strong force as shown by the tall upper shadow on the session’s candle, as a gap up open above the 10 DMA got market participants off of the sidelines & the 10 DMA’s support was able to sustain & keep the session’s prices propped up.

The session also resulted in a spinning top candle, indicating that there was a good deal of indecision among market participants.

Thursday is where the bears came out in full force for the rest of the week, as the session opened slightly higher than Wednesday & temporarily pushed higher, before SPY’s legs gave out underneath it & the price dropped below the 10 DMA & temporarily below the 50 DMA, before ultimately settling near the 50 DMAs support.

It was a risk-off heading into the weekend sentiment Friday, as prices opened on a gap down below the support of the 50 DMA on the highest volume of the week.

Between the high volumes of Thursday & Friday there was a lot of profit taking from Wednesday’s pump, and bearish sentiment had crept into markets.

With the 10 & 50 day moving averages both well above Friday’s closing price, this coming week’s focus should be on volume, particularly after such a long period of below average weekly volume.

SPY opened Monday down ~3%+ & has support nearby, but the intraday volumes will be what gives clues about what market participants will be doing next.

Monday’s volume is currently ~80% of what Friday’s was before noon, and if that negative sentiment continues on forward expect to see more declines throughout the upcoming week.

There is downward pressure from the 10 & 50 day moving averages which will also be something to consider when assessing the strength of support & resistance levels.

Upon a consolidation range it would be beneficial to be prudent & wait to see solid volume readings before diving back into the market, as volatility is expected to continue, so without a trend of solid, strong volume there are elevated near-term risks in SPY.

SPY has support at the $531.35 (Volume Sentiment: Buyers, 1.5:1), $522.92 (Volume Sentiment: Sellers, 1.38:1), $516.69 (Volume Sentiment: Buyers, 2.35:1) & $509.11/share (Volume Sentiment: Sellers, 1.24:1) price levels, with resistance at the $542.94 (50 Day Moving Average, Volume Sentiment: Sellers, 1.22:1), $544.60 (10 Day Moving Average, Volume Sentiment: Sellers, 1.22:1), $554.87 (Volume Sentiment: Buyers, 2:1) & $565.16/share (All-Time High, Volume Sentiment: NULL, 0:0*) price levels.

SPY ETF's Price Level:Volume Sentiment Over The Past 1-2 Years
SPY ETF’s Price Level:Volume Sentiment Over The Past 1-2 Years

QQQ, the Invesco QQQ Trust ETF that tracks the NASDAQ 100 dropped -3.07% last week, as investors were eager to get out of the tech heavy names that make up a large portion of the index.

QQQ ETF - Invesco QQQ ETF's Technical Performance Over The Past Year
QQQ ETF – Invesco QQQ ETF’s Technical Performance Over The Past Year

Their RSI is downtrending towards oversold levels & sits currently at 35.32, while their MACD is in bearish decline.

Volumes were +7.18% above average vs. the previous year (47,385,540 vs. 44,210,526), which should be cause for concern among market participants given that most of their volume came on declining sessions.

QQQ’s week looked very similar to SPYs, as has been the case for some time now as both have been driven by big tech’s strong performance this year.

Monday opened up with a spinning top that closed lower than it opened, expressing uncertainty with a side of negative sentiment & the session’s volume was the lowest of the week.

Tuesday the negative sentiment was confirmed, as the day resulted in declines & hosted a lower shadow that signaled that there was more downside appetite than where the session closed.

Volumes were also relatively muted on Tuesday though, as investors were still on the fence about which direction QQQ would ultimately move in.

Wednesday offered a glimmer of optimism, momentarily, as QQQ opened on a gap up around the 10 day moving average, tested slightly lower (lower shadow), before advancing up to the 50 DMAs resistance level & closing midway between the 10 & 50 day moving averages.

This was all wiped away on Friday though, when a wide-range bearish engulfing candle was the result of QQQ’s trading day & the close was well beneath the 10 & 50 DMAs’ resistance points.

Volumes ticked up for Thursday & continued to go even higher on Friday, when a -2.37% gap down session occurred, resulting in a spinning top candle, indicating that there was quite a bit of fear & uncertainty in QQQ & its components.

This bearish sentiment has carried over into the new week, and much like SPY, QQQ’s week ahead will be interesting to watch from a volume perspective to see where support really lies for the near-term.

QQQ has more nearby support levels than SPY due to their less rapid ascent over the past year, but there is still room for further declines, particularly if big tech profit taking & pivoting out of continues for the rest of the week.

XLK dipped beneath its 200 day moving average’s support on Friday & today’s (Monday) price range for QQQ has dipped below the 200 DMA’s support level, which carries more bearish sentiment moving forward.

Watching QQQ’s volume trends this coming week(s) will be what helps investors figure out where the floor may be for support for QQQ to consolidate in & form a base before they can continue higher.

If the 200 DMA’s support is unable to keep QQQ afloat, expect further declines in the near-term.

QQQ has support at the $448.63 (Volume Sentiment: Sellers, 2.3:0*), $442.35 (Volume Sentiment: Buyers, 1.76:1), $437.86 (Volume Sentiment: Buyers, 1.25:1) & $428.50/share (200 Day Moving Average, Volume Sentiment: Buyers, 1.77:1) price levels, with resistance at the $454.15 (Volume Sentiment: Buyers, 1.62:1), $459.85 (Volume Sentiment: Buyers, 0.9:0*), $464.85 (10 Day Moving Average, Volume Sentiment: Buyers, 0.7:0*) & $473.50/share (50 Day Moving Average, Volume Sentiment: Buyers, 2.5:1) price levels.

QQQ ETF's Price Level:Volume Sentiment Over The Past 1-2 Years
QQQ ETF’s Price Level:Volume Sentiment Over The Past 1-2 Years

IWM, the iShares Russell 2000 ETF declined -6.82%, as small caps were the least favorite of the major four indexes & profit taking from their recent pump up came into fashion.

IWM ETF - iShares Russell 2000 ETF's Technical Performance Over The Past Year
IWM ETF – iShares Russell 2000 ETF’s Technical Performance Over The Past Year

Their RSI is trending bearishly towars oversold & sits currently at 43.7, while their MACD recently crossed over bearishly.

Volumes were +44.33% above average compared to the prior year (50,274,600 vs. 34,832,746), driven mostly by late in the week profit taking following their strong July 2024 performance.

Monday signaled it was near the end of the line for IWM’s recent rally, as a bearish engulfing candle on low volumes kicked the week off; however the 10 day moving average’s support remained strong & in tact.

Tuesday the low volume theme continued but uncertainty crept into the market, as the session resulted in a long-legged doji, that while it formed a bullish harami pattern with the prior day’s candle, there was not much bullish sentiment & it began to indicated that IWM had become exhausted.

Wednesday followed in Tuesday’s footsteps, but with higher volume as it appeared that market participants were ready for one last pump before the risk-off sentiment came in at the end of the week.

Thursday was the breaking point, with a declining ride-range session that broke through the support of the 10 day moving average on the week’s highest volume, indicating that the part was over for IWM.

Friday continued lower on a gap down open resulting in a high wave candle that closed just above where it opened, but indicated that there was appetite below the support of the 50 DMA for IWM to continue lower.

Much like SPY & QQQ, given the high volatility that is expected to continue during this week, IWM’s volumes should be paid close attention to this week to see when they may be able to find support.

Volatility should be expected to continue until a volume trend shows some form of bullishness to serve as support.

While IWM has more local support levels that either of the previous two index ETFs, due to the index being comprised of small cap stocks there is an added likelihood that in prolonged volatility that market participants will sell the lesser know small cap names in favor of keeping cash safe on the sidelines, or in favor of less risky assets such as bonds.

Having an understanding of price level sentiment based on historic volume will be imperative for navigating moving forward for IWM.

IWM has support at the $207.83 (50 Day Moving Average, Volume Sentiment: Buyers, 1.97:1), $207.27 (Volume Sentiment: Buyers, 1.97:1), $204.40 (Volume Sentiment: Buyers, 1.97:1) & $203.68/share (Volume Sentiment: Buyers, 1.13:1) price levels, with resistance at the $209.19 (Volume Sentiment: Buyers, 2.4:0*), $209.29 (Volume Sentiment: Buyers, 2.4:0*), $211.29 (Volume Sentiment: Buyers, 2.4:0*) & $215.38/share (Volume Sentiment: NULL, 0:0*) price levels.

IWM ETF's Price Level:Volume Sentiment Over The Past ~2 Years
IWM ETF’s Price Level:Volume Sentiment Over The Past ~2 Years

DIA, the SPDR Dow Jones Industrial Average ETF dipped -2.18% last week, as even larger cap stocks were not spared from the increase in volatility.

DIA ETF - SPDR Dow Jones Industrial Average ETF's Technical Performance Over The Past Year
DIA ETF – SPDR Dow Jones Industrial Average ETF’s Technical Performance Over The Past Year

Their RSI is trending bearishly and sits at 45.69, while their MACD has recently crossed over the signal line bearishly.

Volumes were +16.66% above average compared to the previous year (4,118,180 vs. 3,530,175), which is interesting as their highest volume session of last week was bullish, but there was massive amounts of profit taking on Thursday & Friday.

DIA’s week opened up on a bearish note, as prices temporarily dipped beneath the support of the 10 day moving average, indicating that there was weakness on the horizon, especially due to their low volumes.

Tuesday featured another low volume session that nudged slightly higher, before Wednesday signaled sentiment was shifting in a high volume bullish session where bears came out in droves & forced the long upper shadow on the session’s candle, despite the bears attempting to march higher.

Thursday the profit taking began, and the session’s volume was close to the levels seen the day prior, as prices closed below the support of the 10 DMA & the session’s lower shadow indicated that there was more downside appetite.

This continued on into Friday, where a gap down open led to a -1.54% session where the support of the 50 DMA was temporarily broken, signaling that there is further uncertainty about DIA & more volatility on the near-term horizon.

Like the other index ETFs mentioned above, this week all eyes should be on volume trends for DIA as that will shed light into whether or not further declines continue, or if there will be some form of consolidation & support will be found.

DIA has many local support levels which will help ease any further declines to a degree, but the volume will be what’s most important to be keeping an eye on in the coming week, particularly once the 50 DMA’s support has been crossed below.

DIA has support at the $396.94 (Volume Sentiment:Buyers, 2:1), $395.40 (Volume Sentiment: Buyers, 2.6:1), $394.29 (50 Day Moving Average, Volume Sentiment: Buyers, 2.6:1) & $390.85/share (Volume Sentiment: Buyers, 1.67:1) price levels, with resistance at the $398.08 (Volume Sentiment: Buyers, 2:1), $399.64 (Volume Sentiment: Buyers, 2:1), $403.36 (10 Day Moving Average, Volume Sentiment: NULL, 0:0*) & $412.01/share (Volume Sentiment: NULL, 0:0*) price levels.

DIA ETF's Price Level:Volume Sentiment Over The Past ~4 Years
DIA ETF’s Price Level:Volume Sentiment Over The Past ~4 Years

The Week Ahead

Monday kicks the week off with Chicago Fed President Goolsbee speaking at 8:30 am, followed by S&P Final U.S. Services PMI at 9:45 am & ISM Services data at 10 am.

Alpha Metallurgical Resources, BioCryst Pharmaceuticals, BioNTech, Carlyle Group, Freshpet, Krystal Biotech, Sonic Automotive, Sotera Health, TreeHouse Foods & Tyson Foods all report earnings before Monday’s opening bell, with Addus HomeCare, ADTRAN, Aecom Tech, Ameresco, American Healthcare REIT, Atlas Energy Solutions, Avis Budget, BellRing Brands, BioMarin Pharmaceutical, Boise Cascade, BWX Technologies, Cabot, Capital Southwest Corp., Chegg, CSX, Definitive Healthcare, Diamondback Energy, Encompass Health, Essential Utilities, EverQuote, Fidelity National, Golub Capital, Helios Technologies, HighPeak Energy, Hims & Hers Health, Huntsman, Innovative Industrial Properties, J&J Snack Foods, James River Group, Kemper, Materion, Mueller Water, National Storage Affiliates, Navitas Semiconductor, ONE Gas, ONEOK, Otter Tail Power, Palantir Technologies, Palomar Holdings, Playa Hotels & Resorts, Primoris Services, Quaker Chemical, Realty Income, Simon Properties, Spirit Aerosystems, Summit Materials, Teradata, The Aaron’s Company, TrueBlue, Unisys, Vimeo, Viper Energy Partners, Vista Outdoor, Vornado Realty Trust, Williams Cos, Yum China & ZoomInfo Technologies all due to report earnings after the session’s close.

U.S. Trade Deficit data is released Tuesday morning at 8:30 am.

Tuesday morning’s earnings calls begin with Caterpillar, Acushnet, AdaptHealth, Adient, Alight, ANI Pharma, Aramark, ATI Inc., Atkore International, Avient, Ballard Power, Baxter, Bentley Systems, Bloomin’ Brands, Broadridge Financial, Bruker, Builders FirstSource, Celsius, Clarivate, Constellation Energy, Delek US Holdings, Duke Energy, Energizer, Enpro, Expeditors International of Washington, Fidelity National Information Services, First Watch Restaurant Group, Fox Corp, Genius Sports, GlobalFoundries, Green Plains, GXO Logistics, Harmony Biosciences, Henry Schein, Hillman Solutions, Hyatt Hotels, CHOR Corp, IDEXX Labs, Ingredion, Jacobs Solutions, Jones Lang LaSalle, Kenvue, Knife River Corp, LCI Industries, Marathon Petroleum, Molson Coors Brewing, MPLX LP, Organon, Owens Corning, Planet Fitness, Portillo’s, Restaurant Brands International, Shutterstock, Starwood Property Trust, Tempur Sealy International, Thoughtworks, TopBuild, TPG Inc, Transdigm Group, Trimble, Uber Technologies, Vulcan Materials, Westlake, WK Kellogg Co, Yum! Brands & Zoetis, before ACADIA Pharmaceuticals, Adtalem Global Education, Airbnb, Albany International, American Financial Group, American States Water, Amgen, Andersons, Applied Optoelectronics, Arcadium Lithium, Ashland, Aspen Technology, Assurant, Astera Labs, Axon, Azenta, B&G Foods, BlackLine, California Resources Corp, Certara, Cirrus Logic, Compass Minerals, Coupang, DaVita, Devon Energy, EverCommerce, Exelixis, Flywire, Fortinet, Globus Medical, GoPro, Grocery Outlet, Halozyme Therapeutics, Hecla Mining, IAC Inc, Illumina, Inogen, Instacart, International Flavors & Fragrances, iRobot, Jack In The Box, Lumen Technologies, Luminar Technologies, Matterport, Mosaic, MRC Global, Myriad Genetics, OraSure, Permian Resources, Progyny, Qualys, Reddit, Redfin, Revolve Group, Rivian Automotive, Skyline Champion, Stem, Stride, Sunrun, Super Micro Computer, Toast, Traeger, TripAdvisor, Upstart, V.F. Corp, Veeco Instruments & Wynn Resorts report after the closing bell.

Wednesday afternoon features Consumer Credit data at 3pm.

Walt Disney, ACM Research, Astec Industries, Avista, B2Gold, Brinks, Brookfield Corp, Ceva, Charles River, Conduent, CVS Health, Dine Brands, Dynatrace, Editas Medicine, Emerson, Enovis Corp, Extreme Networks, Global Payments, Gogo, Griffon, Hilton, Holley, International Money Express, International Seaways, Intra-Cellular Therapies, Kennametal, Kornit Digital, Kymera Therapeutics, Louisiana-Pacific, Lyft, New York Times, NiSource, Nomad Foods, ODP Corp, OGE Energy, Oscar Health, Payoneer, Playtika, Ralph Lauren, Reynolds Consumer Products, Rockwell Automation, RXO, Inc, Shopify, Suncor Energy, Sunoco, Taboola, Target Hospitality, Triumph Group, United Parks & Resorts, Valvoline, Vertex, Vishay, Warner Music Group, Wix.com, Wolverine World Wide & Zimmer Biomet all report earnings Wednesday before the opening bell, followed by Robinhood Markets, ACV Auctions, AerSale, Allogene, Amdocs, AppLovin, Atmos Energy, Beyond Meat, Blink Charging, Boot Barn Holdings, Brighthouse Financial, Bumble, CACI International, Central Garden, CF Industries, Chord Energy, Clean Energy Fuels, Coeur Mining, CoreCivic, Curtiss-Wright, Digi International, Digital Turbine, DigitalBridge, Dolby Labs, Duolingo, Dutch Bros, Encore Capital, Energy Transfer, Enersys, Envista, Equinix, Fastly, Fluence, Forward Air, Franco-Nevada, Genco Shipping & Trading, Guardant Health, Health Catalyst, Hillenbrand, Horace Mann, HubSpot, Hudson Pacific Properties, ICU Medical, Jackson Financial, JFrog, Klaviyo, Kratos Defense and Security, Kulicke & Soffa, LegalZoom.com, Leslie’s, LiveRamp, Magnite, Manitowoc, Mannkind, Manulife Financial, Marathon Oil, McKesson, Monster Beverage, Nutrien, Occidental Petroleum, Pan Am Silver, PetIQ, Primerica, Rayonier, Royal Gold, Sarepta Therapeutics, Sinclair Broadcast, SiTime, SM Energy, SolarEdge Technologies, Sonos, STAAR Surgical, Talos Energy, Topgolf Callaway Brands, UGI Corp, Upwork, Viasat, Vital Energy, Warner Bros. Discovery, Watts Water Technologies, Western Midstream, Ziff Davis & Zillow after the closing bell.

Initial Jobless Claims data is released Thursday morning at 8:30 am, followed by Wholesale Inventories data at 10 am & Richmond Fed President Barkin speaking at 3pm.

Thursday morning’s earnings calls include Amicus Therapeutics, Cars.com, Cheniere Energy, Choice Hotels, Cogent Communications, Commscope, CyberArk Software, Datadog, Eli Lilly, Endeavor Group, First Advantage, Frontier Group Holdings, Geron, GoodRx, Hanesbrands, Hilton Grand Vacations, Himax Technologies, Insmed, Ironwood Pharmaceuticals, Kelly Services, Koppers Holdings, Krispy Kreme, Lamar Advertising, LifeStance Health Group, Martin Marietta Materials, MDU Resources, Murphy Oil, Nexstar, NRG Energy, Papa John’s, PAR Technology, Parker-Hannifin, PENN Entertainment, Piedmont Lithium, Plug Power, Privia Health, Sally Beauty, Sealed Air, SharkNinja, Spectrum Brands, Tennant, TKO Group Holdings, Under Armour, US Foods, Viatris, Vital Farms, Walker & Dunlop, Warby Parker, XPEL & YETI Holdings, followed by Akamai Technologies, Alarm.com, AMN Healthcare, Amplitude, Arlo Technologies, Array Technologies, Arrowhead, Bloom Energy, Capri Holdings, CarGurus, Chesapeake Utilities, CleanSpark, Collegium Pharmaceutical, CONSOL Energy, Cytokinetics, DigitalOcean, Diodes, Douglas Emmett, Doximity, Dropbox, e.l.f. Beauty, Evolent Health, Expedia Group, Five9, Funko, Genpact, Gilead Sciences, Green Dot, Iovance Biotherapeutics, Mercer International, MeridianLink, Natera, News Corp, Nu Skin, Open Lending, Paramount Global, Paymentus, Pembina Pipeline, Pitney Bowes, PubMatic, Rackspace Technology, RB Global, Rocket Lab, Savers Value Village, Scripps, Solventum, SoundHound AI, StepStone Group, Sun Life, Sweetgreen, Synaptics, Synaptics, TechTarget, The Beauty Health Company, The Trade Desk, TTEC Holdings, Unity Software, Viavi, Westrock Coffee Company, Wheaton Precious Metals & Yelp after the session’s close.

Friday features no major economic news & Algonquin Power & Utilities, AMC Networks, American Axle, Berry Petroleum, Construction Partners, Embecta, Evergy, Legend Biotech, Sylvamo & Victory Capital are all scheduled to report earnings before the opening bell.

See you back here next week!

*** I DO NOT OWN SHARES OR OPTIONS CONTRACT POSITIONS IN SPY, QQQ, IWM OR DIA AT THE TIME OF PUBLISHING THIS ARTICLE ***

Price Level:Volume Sentiment Analysis For SPY (S&P 500), QQQ (NASDAQ 100), IWM (Russell 2000) & DIA (Dow Jones Industrial Average) ETFs 7/23/24

Markets have spent a lot of time reaching new all-time (SPY, QQQ & DIA) & 52-week highs (IWM) since our last index ETF price level:volume sentiment check in in April.

Throw in political uncertainty, geo-political conflicts globally & earnings season that are coming with high expectations & there is a recipe for increased volatility in the coming months.

With this in mind, the article below outlines the Buyer:Seller (or Seller:Buyer) sentiment at the various price levels that SPY (S&P 500), QQQ (NASDAQ 100), IWM (Russell 2000) & DIA (Dow Jones Industrial Average) ETFs have traded at over the past few years to gain insight into how market participants may feel at different support & resistance levels.

Due to the aforementioned new high price levels that each index ETF has been experiencing & the subdued volumes that we have seen for the past ~10 weeks most of the higher range price levels are still “NULL”, meaning that they are not 0, but there is not enough data currently to work with.

Additionally, you will notice as you go through the numbers that the higher prices tend to skew more towards the buyers, as there have been limited downside tests against these price levels, and the low volumes have not helped this.

Similarly, you will notice that there tend to be more sellers towards the lower ends of the price ranges.

Each section below contains a view of each index ETF’s chart (for a technical breakdown of each ETF’s chart please see this past weekend’s market review note), as well as a list of their current one year support & resistance levels with the volume sentiment noted beneath it on the table.

There is an additional table beneath this table with each price level’s sentiment, as well as a typed text version below that is able to be copied & pasted.

Note that “NULL, 0:0*” values denote areas that each name has traded at but with limited volume data to work with from a comparison standpoint in terms of creating a ratio of buyers:sellers (or vice versa).

Also, prices that do have a ratio of buyers:sellers (or vice versa) where the denominator is 0 are denoted with an asterisk “*” as well.

In the written lists of the price levels & volume sentiments the price levels that contain support & resistance levels are marked in BOLD.

Recall that at price extremes such as the highs that we have recently hit there will tend to be skewed data due to the small sample size & factor that into how you interpret each price level’s reported sentiment.

This is intended to serve as an additional tool to use during your due diligence process & is not meant to replace doing your own research & is not financial advice.

Price Level:Volume Sentiment Analysis For SPY (S&P 500) ETF

SPY ETF - SPDR S&P 500 ETF's Technical Performance Over The Past Year
SPY ETF – SPDR S&P 500 ETF’s Technical Performance Over The Past Year

SPY, the SPDR S&P 500 ETF has been experiencing low volume levels since the last sentiment analysis note (4/24/24) & is coming off of a fresh all-time high.

They’ve got the least one year support levels due to the way their price has advanced, making the list below even more important to review in the near-term, especially as their 10 day moving average has curled over bearishly above the price & is applying downward pressure on it.

One interesting thing to note is that in the event of a 10% decline from their recent all-time high they dive into a seller dominated area in terms of their support levels, which get more & more seller oriented as the price gets lower.

Should that be tested it will be interesting to see if the seller ratio gets diluted & there is strong support, or if prices continue lower & find their footing & traction at one of the next support levels, which have much more buyer pressure hsitorically.

Below is the list of the volume sentiments for SPY at the price levels it has traded at over the past 2-3 years.

SPY ETF's Price Level:Volume Sentiment Over The Past ~3 Years At Their Current One Year Support & Resistance Levels
SPY ETF’s Price Level:Volume Sentiment Over The Past ~3 Years At Their Current One Year Support & Resistance Levels
SPY ETF's Price Level:Volume Sentiment Over The Past ~3 Years
SPY ETF’s Price Level:Volume Sentiment Over The Past ~3 Years
Pt. 2 - SPY ETF's Price Level:Volume Sentiment Over The Past ~3 Years
Pt. 2 – SPY ETF’s Price Level:Volume Sentiment Over The Past ~3 Years
Pt. 3 - SPY ETF's Price Level:Volume Sentiment Over The Past ~3 Years
Pt. 3 – SPY ETF’s Price Level:Volume Sentiment Over The Past ~3 Years

$570 – NULL – 0:0*, +2.77% From Current Price Level

$565 – NULL – 0:0*, +1.87% From Current Price Level

$560 – Buyers – 1.6:1, +0.96% From Current Price Level

$555 – Buyers – 2:1, +0.06% From Current Price Level – 10 Day Moving Average*

$550 – Buyers – 2:1, -0.84% From Current Price Level – Current Price Level*

$545 – Buyers – 2:1, -1.74% From Current Price Level

$540 – Sellers – 1.22:1, -2.64% From Current Price Level

$535 – Buyers – 0.7:0*, -3.54% From Current Price Level – 50 Day Moving Average*

$530 – Buyers – 1.5:1, -4.44% From Current Price Level

$525 – Buyers – 5.6:1, -5.35% From Current Price Level

$520 – Sellers – 1.38:1, -6.25% From Current Price Level

$515 – Buyers – 2.35:1, -7.15% From Current Price Level

$510 -Even – 1:1, -8.05% From Current Price Level

$505 – Sellers – 1.24:1, -8.95% From Current Price Level

$500 – Sellers – 1.31:1, -9.85% From Current Price Level

$496 – Sellers – 1.69:1, -10.57% From Current Price Level

$492 – Buyers – 1.7:1, -11.3% From Current Price Level

$488 – Buyers – 1.27:1, -12.02% From Current Price Level – 200 Day Moving Average*

$484 – Buyers – 1.22:1, -12.74% From Current Price Level

$480 – Buyers – 1.3:0*, -13.46% From Current Price Level

$476 – Buyers – 1.14:1, -14.18% From Current Price Level

$472 – Buyers – 2.25:1, -14.9% From Current Price Level

$468 – Buyers – 1.1:1, -15.62% From Current Price Level

$464 – Sellers – 1.35:1, -16.34% From Current Price Level

$460 – Buyers – 0.6:0*, -17.06% From Current Price Level

$456 – Buyers – 1.21:1, -17.79% From Current Price Level

$452 – Buyers – 2.9:0*, -18.51% From Current Price Level

$448 – Buyers – 1.33:1, -19.23% From Current Price Level

$444 – Buyers – 1.48:1, -19.95% From Current Price Level

$440 – Sellers – 1.12:1, -20.67% From Current Price Level

$436 – Buyers – 1.08:1, -21.39% From Current Price Level

$432 – Buyers – 1.14:1, -22.11% From Current Price Level

$428 – Buyers – 1.09:1, -22.83% From Current Price Level

$424 – Buyers – 1.02:1, -23.56% From Current Price Level

$420 – Sellers – 1.23:1, -24.28% From Current Price Level

$416 – Sellers – 2.62:1, -25% From Current Price Level

$412 – Buyers – 1.84:1, -25.72% From Current Price Level

$408 – Sellers – 1.22:1, -26.44% From Current Price Level

$404 – Buyers – 1.88:1, -27.16% From Current Price Level

$400 – Sellers – 1.42:1, -27.88% From Current Price Level

$396 – Sellers – 2:1, -28.6% From Current Price Level

$392 – Buyers – 2.18:1, -29.32% From Current Price Level

$388 – Buyers – 2.2:1, -30.05% From Current Price Level

$384 – Sellers – 1.04:1, -30.77% From Current Price Level

$380 – Sellers – 1.93:1, -31.49% From Current Price Level

$376 – Sellers – 2.5:1, -32.21% From Current Price Level

$372 – Sellers – 1.65:1, -32.93% From Current Price Level

$368 – Sellers – 1.26:1, -33.65% From Current Price Level

$364 – Sellers – 1.72:1, -34.37% From Current Price Level

$360 – Sellers – 1.79:1, -35.09% From Current Price Level

$356 – Buyers – 1.22:1, -35.82% From Current Price Level

$352 – Sellers – 4.25:1, -36.54% From Current Price Level

$348 – Sellers – 3:0*, -37.26% From Current Price Level

$344 – Sellers – 0.6:0*, -37.98% From Current Price Level

$340 – NULL – 0:0*, -38.7% From Current Price Level

Price Level:Volume Sentiment Analysis For QQQ (NASDAQ 100) ETF

QQQ ETF - Invescso QQQ Trust ETF's Technical Performance Over The Past Year
QQQ ETF – Invescso QQQ Trust ETF’s Technical Performance Over The Past Year

QQQ, the Invesco QQQ Trust ETF that tracks the NASDAQ 100 has also just come off of setting fresh all-time highs & is in a similar, but slightly more bearish technical position than SPY.

While QQQ’s ascent was more controlled than SPY’s which gives it more support levels, but if the 50 day moving average is crossed bearishly it will be imperative to assess the strength of each support level on its way down, especially as the top of the support from January-April’s trading range is at a Seller dominated price level (2.3:0*).

Below is a list of QQQ’s volume sentiment at each price level they’ve traded at for the last 2-3 years.

QQQ ETF's Price Level:Volume Sentiment Over The past ~2 Years At Their One Year Support & Resistance Levels
QQQ ETF’s Price Level:Volume Sentiment Over The past ~2 Years At Their One Year Support & Resistance Levels
QQQ ETF's Price Level:Volume Sentiment Over The Past ~2 Years
QQQ ETF’s Price Level:Volume Sentiment Over The Past ~2 Years
Pt. 2 - QQQ ETF's Price Level:Volume Sentiment Over The Past ~2 Years
Pt. 2 – QQQ ETF’s Price Level:Volume Sentiment Over The Past ~2 Years
Pt. 3 - QQQ ETF's Price Level:Volume Sentiment Over The Past ~2 Years
Pt. 3 – QQQ ETF’s Price Level:Volume Sentiment Over The Past ~2 Years
QQQ ETF's Price Level:Volume Sentiment Over The Past ~2 Years
QQQ ETF’s Price Level:Volume Sentiment Over The Past ~2 Years

$505 – NULL – 0:0*, +4.7% From Current Price Level

$500 – Buyers – 0.4:0*, +3.67% From Current Price Level

$496 – Buyers – 2:0*, +2.84% From Current Price Level

$492 – Buyers – 0.6:0*, +2.01% From Current Price Level

$488 – Sellers – 4:1, +1.18% From Current Price Level – 10 Day Moving Average*

$484 – Buyers – 1.3:0*, +0.35% From Current Price Level

$480 – Sellers – 1.09:1, -0.48% From Current Price Level – Current Price Level*

$476 – Sellers – 1.11:1, -1.31% From Current Price Level

$472 – Buyers – 2.5:1, -2.14% From Current Price Level

$468 – NULL – 0:0*, -2.97% From Current Price Level – 50 Day Moving Average*

$464 – Buyers – 0.7:0*, -3.8% From Current Price Level

$460 – Even – 1:1, -4.63% From Current Price Level

$456 – Buyers – 0.9:0*, -5.46% From Current Price Level

$452 – Buyers – 1.62:1, -6.29% From Current Price Level

$448 – Sellers – 2.3:0*, -7.12% From Current Price Level

$444 – Buyers – 11.5:1, -7.94% From Current Price Level

$440 – Buyers – 1.76:1, -8.77% From Current Price Level

$436 – Buyers – 1.25:1, -9.6% From Current Price Level

$432 – Sellers – 2.14:1, -10.43% From Current Price Level

$428 – Buyers – 1.77:1, -11.26% From Current Price Level

$424 – Sellers – 1.02:1, -12.09% From Current Price Level – 200 Day Moving Average*

$420 – Sellers – 1.74:1, -12.92% From Current Price Level

$416 – Buyers – 1.8:0*, -13.75% From Current Price Level

$412 – Sellers – 2:0*, -14.58% From Current Price Level

$408 – Buyers – 1.77:1, -15.41% From Current Price Level

$404 – Buyers – 4.86:1, -16.24% From Current Price Level

$400 – Sellers – 1.04:1, -17.07% From Current Price Level

$396 – Buyers – 1.17:1, -17.9% From Current Price Level

$392 – Buyers – 2.17:1, -18.73% From Current Price Level

$388 – Buyers – 2.6:0*, -19.56% From Current Price Level

$384 – Sellers – 1.74:1, -20.38% From Current Price Level

$380 – Buyers – 2.84:1, -21.21% From Current Price Level

$376 – Buyers – 3.86:1, -22.04% From Current Price Level

$372 – Sellers – 1.04:1, -22.87% From Current Price Level

$368 – Sellers – 1.46:1, -23.7% From Current Price Level

$364 – Buyers – 1.55:1, -24.53% From Current Price Level

$360 – Buyers – 1.17:1, -25.36% From Current Price Level

$356 – Buyers – 1.21:1, -26.19% From Current Price Level

$352 – Sellers – 1.64:1, -27.02% From Current Price Level

$348 – Buyers – 2.53:1, -27.85% From Current Price Level

$344 – Buyers – 1.47:1, -28.68% From Current Price Level

$340 – Even – 1:1, -29.51% From Current Price Level

$336 – Buyers – 1:0*, -30.34% From Current Price Level

$332 – Buyers – 2:1, -31.17% From Current Price Level

$328 – Sellers – 1.23:1, -32% From Current Price Level

$324 – Buyers – 3.83:1, -32.82% From Current Price Level

$320 – Buyers – 2.5:1, -33.65% From Current Price Level

$316 – Buyers – 1.02:1, -34.48% From Current Price Level

$312 – Sellers – 2.75:1, -35.31% From Current Price Level

$308 – Buyers – 1.69:1, -36.14% From Current Price Level

$304 – Buyers – 2.55:1, -36.97% From Current Price Level

$300 – Sellers – 1.25:1, -37.8% From Current Price Level

$296- Buyers – 1.33:1, -38.63% From Current Price Level

$292 – Buyers – 2.5:1, -39.46% From Current Price Level

$288 – Sellers – 1.06:1, -40.29% From Current Price Level

$284 – Sellers – 1.11:1, -41.12% From Current Price Level

$280 – Sellers – 1.1:1, -41.95% From Current Price Level

$276 – Buyers – 1.17:1, -42.78% From Current Price Level

$272 – Sellers – 1.78:1, -43.61% From Current Price Level

$268 – Buyers – 1.03:1, -44.44% From Current Price Level

$264 – Sellers – 1.18:1, -45.26% From Current Price Level

$260 – Sellers – 1.84:1, -46.09% From Current Price Level

$256 – Sellers – 5.2:0*, -46.92% From Current Price Level

$252 – NULL – 0:0*, -47.75% From Current Price Level

Price Level:Volume Sentiment Analysis For IWM (Russell 2000) ETF

IWM ETF - iShares Russell 2000 ETF's Technical Performance Over The Past Year
IWM ETF – iShares Russell 2000 ETF’s Technical Performance Over The Past Year

IWM, the iShares Russell 2000 ETF has set a fresh 52-week high recently, but has not reset its all-time high unlike the other three index ETFs.

The nature which IWM trades vs. SPY & QQQ is much more controlled & more like oscillations around a price range that steadily advance, whereas the other two ETFs favor more rapid ascents, which provides IWM with more support levels near their current price.

Below is a list of IWM’s volume sentiment at the price levels it’s traded at over the past 2-3 years.

IWM ETF's Price Level:Volume Sentiment Over The Past ~2 Years At One Year Support & Resistance Levels
IWM ETF’s Price Level:Volume Sentiment Over The Past ~2 Years At One Year Support & Resistance Levels
IWM ETF's Price Level:Volume Sentiment Over The Past ~2 Years
IWM ETF’s Price Level:Volume Sentiment Over The Past ~2 Years
Pt. 2 - IWM ETF's Price Level:Volume Sentiment Over The Past ~2 Years
Pt. 2 – IWM ETF’s Price Level:Volume Sentiment Over The Past ~2 Years

$228 – NULL – 0:0*, +3.5% From Current Price Level

$224 – NULL – 0:0*, +1.68% From Current Price Level

$220 -NULL – 0:0*, -0.13% From Current Price Level – Current Price Level*

$216 – NULL – 0:0*, -1.95% From Current Price Level

$212 – NULL – 0:0*, -3.76% From Current Price Level – 10 Day Moving Average*

$208 – Buyers – 2.4:0*, -5.58% From Current Price Level

$204 – Buyers – 1.97:1, -7.39% From Current Price Level – 50 Day Moving Average*

$200 – Buyers – 1.13:1, -9.21% From Current Price Level

$198 – Buyers – 2.08:1, -10.12% From Current Price Level

$196 – Buyers – 1.25:1, -11.03% From Current Price Level

$194 – Buyers – 1.29:1, -11.93% From Current Price Level – 200 Day Moving Average*

$192 – Sellers – 3.79:1, -12.84% From Current Price Level

$190 – Buyers – 1.08:1, -13.75% From Current Price Level

$188 – Sellers – 1.46:1, -14.66% From Current Price Level

$186 – Buyers – 4:1, -15.57% From Current Price Level

$184 – Buyers – 3.55:1, -16.47% From Current Price Level

$182 – Buyers – 1.03:1, -17.38% From Current Price Level

$180 – Sellers – 1.23:1, -18.29% From Current Price Level

$178 – Buyers – 1.17:1, -19.2% From Current Price Level

$176 – Buyers – 1.97:1, -20.11% From Current Price Level

$174 – Buyers – 1.52:1, -21.01% From Current Price Level

$172 – Buyers – 1.28:1, -21.92% From Current Price Level

$170 – Sellers – 1.88:1, -22.83% From Current Price Level

$168 – Sellers – 1.16:1, -23.74% From Current Price Level

$166 – Sellers – 1.85:1, -24.64% From Current Price Level

$164 – Sellers – 5.25:1, -25.55% From Current Price Level

$162 – Even – 1:1, -26.46% From Current Price Level

$160 – Buyers – 1.2:1, -27.37% From Current Price Level

$158 – NULL – 0:0*, -28.28% From Current Price Level

Price Level:Volume Sentiment Analysis For DIA (Dow Jones Industrial Average) ETF

DIA ETF - SPDR Dow Jones Industrial Average ETF's Technical Performance Over The Past Year
DIA ETF – SPDR Dow Jones Industrial Average ETF’s Technical Performance Over The Past Year

DIA, the SPDR Dow Jones Industrial Average ETF‘s chart is much closer to IWM’s than SPY or QQQ’s, primarily because the latter have benefitted greatly from NVDA & other AI oriented components that the former two do not have.

As a result, they too have more local support levels, but it is important to note that the overwhelming majority of them are heavily buyer dominated, which means in the event of a decline we’ll see these figures become diluted

Below is a list of the volume sentiment at each of the price levels DIA has traded at for the last 3-4 years.

DIA ETF's Price Level:Volume Sentiment Over The Past ~3 Years At One Year Support & Resistance Levels
DIA ETF’s Price Level:Volume Sentiment Over The Past ~3 Years At One Year Support & Resistance Levels
DIA ETF's Price Level:Volume Sentiment Over The Past ~3 Years
DIA ETF’s Price Level:Volume Sentiment Over The Past ~3 Years
Pt. 2 - DIA ETF's Price Level:Volume Sentiment Over The Past ~3 Years
Pt. 2 – DIA ETF’s Price Level:Volume Sentiment Over The Past ~3 Years

$416 – NULL – 0:0*, +2.93% From Current Price Level

$412 – NULL – 0:0*, +1.94% From Current Price Level

$408 – NULL – 0:0*, +0.95% From Current Price Level

$404 – NULL – 0:0*, -0.04% From Current Price Level

$400 – NULL – 0:0*, -1.03% From Current Price Level – 10 Day Moving Average*

$396 – Buyers – 2:1, -2.02% From Current Price Level

$392 – Buyers – 2.6:1, -3.01% From Current Price Level – 50 Day Moving Average*

$388 – Buyers – 1.67:1, -4% From Current Price Level

$384 – Buyers – 1.05:1, -4.99% From Current Price Level

$380 – Buyers – 1.58:1, -5.98% From Current Price Level

$376 – Buyers – 1.75:1, -6.97% From Current Price Level

$372 – Buyers- 1.44:1, -7.95% From Current Price Level – 200 Day Moving Average*

$368 – Buyers – 1.88:1, -8.94% From Current Price Level

$364 – Even, 1:1, -9.93% From Current Price Level

$360 – Buyers – 0.2:0*, -10.92% From Current Price Level

$356 – Buyers – 1.2:1, -11.91% From Current Price Level

$352 – Buyers – 0.1:0*, -12.9% From Current Price Level

$348 – Buyers – 14:1, -13.89% From Current Price Level

$344 – Even – 1:1, -14.88% From Current Price Level

$340 – Buyers – 1.31:1, -15.87% From Current Price Level

$336 – Buyers – 1.5:1, -16.86% From Current Price Level

$332 – Buyers – 1.6:1, -17.85% From Current Price Level

$328 – Sellers – 1.09:1, -18.84% From Current Price Level

$324 – Buyers – 1.21:1, -19.83% From Current Price Level

$320 – Sellers – 1.41:1, -20.82% From Current Price Level

$316 – Sellers – 1.43:1, -21.81% From Current Price Level

$312 – Buyers – 1.04:1, -22.8% From Current Price Level

$308 – Sellers – 1.61:1, -23.79% From Current Price Level

$304 – Buyers – 1.29:1, -24.78% From Current Price Level

$300 – Buyers – 1.33:1, -25.77% From Current Price Level

$296 – Buyers – 1.14:1, -26.76% From Current Price Level

$292 – Even – 1:1, -27.75% From Current Price Level

$288 – Sellers – 1.86:1, -28.74% From Current Price Level

$284 – Sellers – 1.33:1, -29.73% From Current Price Level

$280 – Sellers – 11:1, -30.72% From Current Price Level

$276 – NULL – 0:0*, -31.71% From Current Price Level

*** I DO NOT OWN SHARES OR OPTIONS CONTRACT POSITIONS IN SPY, QQQ, IWM OR DIA AT THE TIME OF PUBLISHING THIS ARTICLE ***

Weekly Stock & ETF Market Review 7/21/2024

SPY, the SPDR S&P 500 ETF fell -1.96% last week as low volumes continued on, while the VIX closed at 16.52, indicating a one day implied move of +/-1.04% & a one month implied move of +/-4.77%.

For those who missed it, check out last week’s post about how frequently SPY performs inside & outside of the VIX’s implied daily range & under varying levels of volume fluctuations here.

SPY ETF - SPDR S&P 500 ETF's Technical Performance Over The Past Year
SPY ETF – SPDR S&P 500 ETF’s Technical Performance Over The Past Year

Their RSI is at the neutral level of 50.16 after being overbought for weeks, which will make the coming sessions interesting as we watch to see if 50 is deemed “enough is enough”, or if it continues sinking further.

SPY’s MACD is bearish & looks content to continue lower in the coming week based on its histogram & past history, which if proves true will show RSI values moving further downward towards the 30 mark, oversold territory.

Volumes were still weak for SPY, -27.8% below the prior year’s average volume (51,178,120 vs. 70,887,296), which is a cause for concern given that the highest volume sessions were on declining days where money was flowing out of SPY.

Volume will remain a key element of trade for all ETFs discussed in this article in the coming week, as it will lend clues into the true sentiment of market participants behind whatever price moves we experience.

Monday began the week indicating that there was some weakness on the horizon last week, as the session resulted in a long-legged doji candle on mediocre at best volume, slightly advancing.

Tuesday’s high marked a new 52-week & all-time high for SPY, but the weakness in volume indicated that there was about to be a change of tune from market participants, which came about on Wednesday, when prices opened on a gap down on volumes that eclipsed the prior two days & entire month of July.

After the opening gap down on Wednesday prices tried to stay above the 10 day moving average’s support, including the test higher shown by the session’s upper shadow, but ultimately the day closed lower, right below the 10 DMA’s resistance.

Thursday opened slightly higher than Wednesday’s close & tested slightly higher, before tumbling to close well below the day’s open & the resistance of the 10 DMA.

Risk-off sentiment carried through into Friday, where prices again opened lower, made a modest attempt at going higher, before ultimately continuing to decline -0.66% for the session on the week’s strongest volume.

As previously noted, volume will be key for all indexes this week, as earnings calls & PCE on Friday have the potential to cause markets to jump around a bit, but the conviction behind the jump will be more important than the actual day-over-day percent changes.

Another area to keep an eye on for SPY & the other index ETFs is going to be their oscillators & indicators.

Following a three consecutive session decline things such as their RSI & MACD look markedly bearish, but based on their neutral RSI there is potential for early signals as to what comes next based on how this week’s changes to it play out.

RSI does not have to go from overbought to oversold & can just as easily resume upward movement from the neutral level where it sits now.

This seems unlikely based on how aggressive last week’s declines were & due to the fact that the 10 DMA has now curled over & is applying downwards pressure on SPY’s price.

SPY’s current share price sits midway between the resistance of the 10 DMA & the support of the 50 DMA, which happens to be SPY’s nearest support level., ~2% below the current price.

As was noted last week, SPY’s price behavior of recent following the bearish engulfing session of two Thursday’s ago have some similarities, making it likely to see some form of price consolidation in a controlled decline between the two moving averages in the near-term (similar to last July & August’s price behavior).

Should this hold true & prices drop below the 50 DMA & march lower towards SPY’s other support levels.

In the event of a 10% decline from the recently set all-time high, SPY’s price would decline to $508.64, which would mean there’d be a test of the support level at $509.11 that was established in late-April.

A decline to $544.99 would put SPY into a seller dominated price zone that would line it up for a test of the 50 DMA’s support, based on the limited data for these newly reached high price levels & the buyer:seller volume ratio.

Another important consideration when looking at the strength of support levels this close to all-time highs is that the data will be skewed towards the buyers, as most of the price levels have not been challenged much while prices marched higher.

With that in mind & looking at the most recent data below (will post a volume sentiment analysis later this week), the $525-529.99/share price level is the strongest in terms of historic buyer:seller volume sentiment.

Should prices continue lower through that & reach the $510-514.99/share level support will not be as strong, however the same concept related to the buyer’s strength at the high levels applies to the sellers strength at the levels that have historically seen more correcting price action to the downside before moving upwards again.

For the coming week expect to se further consolidation with perhaps a session or two of breath catching & mild advances until prices become wedged in tightly between the 10 & 50 DMA, unless there is some bad news event that causes outright sharp declines to continue.

Higher volatility & a higher Average True Range reading will likely continue into the next few weeks.

SPY has support at the $539.71 (50 Day Moving Average, Volume Sentiment: Buyers, 0.7:0*, $531.35 (Volume Sentiment: Buyers, 1.5:1), $522.92 (Volume Sentiment: Sellers, 1.39:1) & $516.69/share (Volume Sentiment: Buyers, 2.35:1) price levels, with resistance at the $557.39 (10 Day Moving Average, Volume Sentiment: Buyers, 1.6:1) & $565.16/share (All-Time High, Volume Sentiment: NULL, 0:0*) price levels.

SPY ETF's Price Level:Volume Sentiment Over The Past ~3 Years
SPY ETF’s Price Level:Volume Sentiment Over The Past ~3 Years

QQQ, the Invesco QQQ Trust ETF that tracks the NASDAQ 100 had the worst week of the major four index ETFs, declining -3.96% for the week, as market participants shied away from the tech-heavy index.

QQQ ETF - Invesco QQQ Trust ETF's Technical Performance Over The Past Year
QQQ ETF – Invesco QQQ Trust ETF’s Technical Performance Over The Past Year

Their RSI crossed over the neutral 50 level via Wednesday’s gap down session & has continued moving towards oversold levels, currently sitting at 50.

QQQ’s MACD is bearish & its histogram isn’t indicating signs of slowing down in the near-term, at least until the 50 day moving average is tested.

Volumes were -8.06% below average compared to the previous year’s average (40,935,280 vs. 44,522,493), as some life was breathed back into QQQ last week.

As noted in previous weeks’ posts, due to the length of time that volumes were subdued (9+ weeks) the total average volume of the past year has gone down as 10 weeks is ~19% of the year.

This should also be taken into consideration when reviewing the volume sentiment data that was just discussed for SPY & will continue to be discussed throughout the article, as much of the price action at the levels discussed took place within this relatively calm period.

QQQ’s week kicked off on a bit more ominous looking note than SPY’s, with Monday’s session resulting in a long-legged doji as well that was a slight day-over-day increase from the prior Friday, where volumes were actually not terribly weak if compared to the previous few month’s volume levels.

Tuesday had weaker volume indicating that people were becoming hesitant & the hanging man candle that closed lower than it opened (bearish signal) showed there was blood in the water, which was further confirmed with the temporary intra-day breaking below QQQ’s 10 DMA’s support.

QQQ jumped off the diving board aggressively on Wednesday, where the week’s highest volume session opened on a gap down & didn’t look back, continuing lower throughout the day to close near its low price & showing that traders had lost faith in the two month rally.

Thursday opened midway between Wednesday’s price range, only for the bleeding to continue as sellers came out in droves once again forcing prices lower & opening the door to further near-term declines based on the lower shadow of the session’s candle.

It became very clear that there was little-to-no enthusiasm left for QQQ & the week closed out on the same note, a risk-off into the weekend Friday session that continued pushing prices lower on a -0.89% daily decline.

There were a few glimmers of hope for QQQ that SPY did not share, such as more upside appetite on Friday based on the candle’s upper shadow & the fact that seller volume pressure went down each day after Wednesday, whereas SPY’s negative volume sessions only saw more & more volume each successive day.

Part of the former may be attributed to the fact that QQQ is closer to its 50 DMA’s support than SPY is, which put some upside pressure on their price.

Similar themes for QQQ’s near-term future were outlined in SPY’s section, as they have behaved in similar fashions in the recent AI-frenzy.

QQQ’s volume patterns will be important in predicting how prices will behave, particularly as earnings calls begin featuring more names that are NASDAQ components, as so far earnings calls have mostly been financial companies, which are not components of QQQ.

A -10% decline from QQQ’s all-time high that was set two weeks ago would bring prices to $453.17/share, putting it within the range of the Q1-Q2 consolidation range.

Should prices break down below the 50 DMA’s support that looks primed to be the destination of choice, especially given there is little-to-no data of value in terms of buyer:seller pressure for the $468-471.99/share price zone & the $460-463.99/share zone is a low volume gridlock between an even number of buyer & seller sentiment.

Given how much QQQ has already shed the more buyer-oriented extreme prices have passed, and similar to SPY, the $448-451.99/share zone that is currently lopsided to the sellers could become a strong support level that evens out vs. the current 2.3:0 ratio that favors the sellers.

Like SPY, expect to see QQQ’s Average True Range stay high in the coming week(s) as increasing volatility looks primed to continue.

QQQ has support at the $469.98 (50 Day Moving Average, Volume Sentiment: NULL, 0:0*), $459.85 (Volume Sentiment: Buyers, 0.9:0*), $448.63 (Volume Sentiment: Sellers, 2.3:0*) & $447.34/share (Volume Sentiment: Buyers, 11.5:1) price levels, with resistance at the $491.38 (10 Day Moving Average, Volume Sentiment: Sellers, 4:1) & $503.52/share (All-Time High, Volume Sentiment: Buyers, 0.4:0*) price levels.

QQQ ETF's Price Level:Volume Sentiment Over The Past ~2 Years
QQQ ETF’s Price Level:Volume Sentiment Over The Past ~2 Years

IWM, the iShares Russell 2000 ETF had the strongest weekly performance of the major index ETFs on revived volume, advancing +1.74%.

IWM ETF - iShares Russell 2000 ETF's Technical Performance Over The Past Year
IWM ETF – iShares Russell 2000 ETF’s Technical Performance Over The Past Year

Their RSI crossed back from overbought territory on Wednesday/Thursday & sits at 63.73, while their MACD is still bullish but has curled over looking to likely cross the signal line by mid-week, which the histogram supports as it too is falling.

Volumes were +61.32% above average last week compared to the previous year’s average (54,809,160 vs. 33,976,390), reflecting a healthy mix of growth & profit taking when combined with the volumes of late in the week prior.

Monday continued IWM’s rally from the previous week, as a gap up open near the prior Friday’s high set the stage for another session of marching higher, although volumes were signaling that there was waning enthusiasm at these price levels.

Tuesday made one last march higher on a gap up session that had a wide price range as indicated by the large daily candle & the highest volume of the week showed that there was going to be one last dive into the pool before it became time to head out.

Wednesday was the major profit taking session, where declining session volume was only -2.7% below Tuesday’s volume.

Further pain was on the horizon though as the gravestone doji (bearish) candle also created a bearish harami pattern on the two highest volume sessions of the week; there was a marked change of sentiment coming from market participants & weakness began emerging.

This carried on for the rest of the week, when Thursday opened on a gap down & despite trying to rally higher ultimately closed lower & the candle’s lower shadow signaled that there was more appetite for prices to continue declining.

Thursday’s volume also showed that profit taking was still alive & healthy in the wake of the prior week’s run up for IWM & the gap between Monday & Tuesday’s candles was filled.

Friday ended the week on a note of uncertainty, as prices opened lower, wanted to advance but ultimately declined for the day & resulted in a spinning top.

The session’s volume waned from the levels seen over the prior six sessions indicating that there was still profit taking taking place but that folks were not certain of what direction IWM should be moving in next.

IWM’s week ahead looks a bit different than SPY or QQQ’s given they recently broke out of a months-long trading range & are now working their way back towards the support of the 10 day moving average (~2% below Friday’s closing price), where there is also other local support levels, notable at $211.29 & between a zone of $209.19-209.29.

IWM’s support level strength will also have a few caveats, as prices are currently in a “NULL” range where there has yet to be enough data to sample in regards to buyer:seller strength, but there has been activity.

The next 8-10% downward is all buyer dominated, with the $198-199.99 zone currently the strongest & no seller zones until $192-193.99 (although that one is quite seller heavy, at 3.79:1).

IWM has support at the $212.97 (10 Day Moving Average, Volume Sentiment: NULL, 0:0*), $211.29 (Volume Sentiment: Buyers, 2.4:0*), $209.29 (Volume Sentiment: Buyers, 2.4:0*) & $209.19/share (Volume Sentiment: Buyers, 2.4:0*) price levels, with resistance at the $226.64/share (52-Week High, Volume Sentiment: NULL, 0:0*) price levels.

IWM ETF's Price Level:Volume Sentiment Over The Past ~2 Years
IWM ETF’s Price Level:Volume Sentiment Over The Past ~2 Years

DIA, the SPDR Dow Jones Industrial Average ETF gained +0.71% last week, as volumes returned with Tuesday’s bullish session being the second highest volume session of the year.

DIA ETF - SPDR Dow Jones Industrial Average ETF's Technical Performance Over The Past Year
DIA ETF – SPDR Dow Jones Industrial Average ETF’s Technical Performance Over The Past Year

Their RSI has fallen from overbought levels since Thursday’s declines & currently sits at 61, while their MACD has curled over aggressively bearishly towards the signal line & the histogram shows impending weakness.

Volumes were +39.98% above average compared to the year prior last week (4,934,840 vs. 3,525,322), as it appears nature has (at least temporarily) healed, but the same concerns mentioned prior about how ~20% of the annualized average volume calculation has brought lower input levels & thus a lower average.

DIA is similar to IWM these days, as we’ve noted weekly for months now, mostly due to the fact that NVDA & other AI names are not components of them & have been driving SPY & QQQ higher for months now.

Monday kicked off last week on higher than average volume for DIA vs. the levels seen for the last few months, but indecision was in the air as the session opened up a gap up, but closed on a doji.

Tuesday the buyers came out in bunches to force prices to open on a gap up & a wide range session that resulted in a strong advance.

The tide signaled impending change on Wednesday though, when prices opened below Tuesday’s close & forced their way higher, but on less enthusiastic volume, indicating that there wasn’t much fuel left in the tank & signaling that there would indeed be some near-term profit taking.

Had Wednesday’s open not been below Tuesday’s close there would have been an evening star pattern created based on Thursday’s declining session, where the profit takers came out of the woodwork forcing the second highest volume session of the week on declines.

While it’s not a traditional shooting star, Thursday’s close carries with it the same negative sentiment in terms of a daily candle shape, bears adamantly denied the bullish attempt higher that did reset the all-time high for DIA & forced the close to be lower on the day.

Friday the negative sentiment continued, as volumes were slightly lower but still high on a gap down open that ultimately resulted in further declines on the day heading into the close.

The day’s lower shadow is larger than the upper one, signaling that there was (and still is) more room for downside movement as far as market participants are concerned, with the proximity of the 10 day moving average’s support to the price likely being one of the factors that managed to keep the close as high as it was.

IWM & DIA have traded similarly while they missed out on the AI-mania buying craze, and all eyes will be on watching the strength of the 10 DMA’s support & how the consolidation/trading range of the past few months holds up as strength of support levels.

Based on how congested the space is between the 50 & 10 DMAs it is unclear if if prices will wind up consolidating between them ever or if we skip to them dipping below the two moving averages & then hoping for strength of support from the levels in the $380’s, in which case the $383-383.99 zone will likely be the strongest based on the total number of touch-points there.

Should those be broken, the $373-374 range also has a handful of support points, including the 200 day moving average & the next lowest level has the strongest buyer:seller sentiment ($368-371.99 is 1.88:1 Buyers:Sellers).

Daily volumes will give the clues as to what might happen & should be watched closely in the next few weeks.

DIA has support at the $401.35 (10 Day Moving Average, Volume Sentiment: NULL, 0:0*), $399.64 (Volume Sentiment: Buyers, 2:1), $396.94 (Volume Sentiment: Buyers, 2:1) & $395.40/share (Volume Sentiment: Buyers, 2.6:1) price levels, with resistance at the $413.66/share (All-Time High, Volume Sentiment: NULL, 0:0*) price levels.

DIA ETF's Price Level:Volume Sentiment Over The Past ~3 Years
DIA ETF’s Price Level:Volume Sentiment Over The Past ~3 Years

The Week Ahead

The new week kicks off on a quiet note as there is no major economic data scheduled for release on Monday.

Monday’s before the bell earnings reports include Bank of Hawaii, IQVIA, Truist Financial & Verizon Communications, with Agilysys, AGNC Investment, Alexandria RE, BOK Financial, Brown & Brown, Cadence Bank, Cadence Design, Calix Networks, Cathay Bancorp, Cleveland-Cliffs, Crown Holdings, Equity Lifestyle Properties, HealthStream, Medpace, Nucor, NXP Semiconductors, RLI Corp, Simpson Manufacturing, W.R. Berkley & Zions Bancorp scheduled to report after the session’s close.

Existing Home Sales data is released Tuesday at 10 am.

Tuesday morning kicks off with A.O. Smith, Albertsons, Avery Dennison, Banc of California, Coca-Cola, Community Financial System, Constellium, Danaher, First Bancorp, Franklin Electric, Freeport-McMoRan, GATX, GE Aerospace, General Motors, Genuine Parts, HCA, Herc Holdings, Invesco, Kimberly-Clark, Lockheed Martin, Moody’s, MSCI, Northwest Bancshares, Old National Bancorp, PACCAR, Pentair, Philip Morris International, Polaris Industries, PulteGroup, Quest Diagnostics, Sherwin-Williams, Spotify, UPS & Webster Financial reporting earnings, followed by Alphabet, Artisan Partners Asset Management, Brandywine Realty, Cal-Maine Foods, Canadian National Railway, Capital One Financial, Chubb, CoStar Group, East West Bancorp, EastGroup, Enova International, Enphase Energy, EQT Corp., First Commonwealth, Matador Resources, Mattel, Nabors Industries, Packaging Corp of America, PennyMac, Range Resources, Red Rock Resorts, Renasant, Retail Opportunity Investments, Seagate Technology, Tesla, Texas Instruments, Trustmark, Veritex Holdings, Vicor & Visa, West Fraser Timber after the closing bell.

New Home Sales data comes out Wednesday morning at 10 am.

Alkermes, Allegion, Amphenol, AT&T, Boston Scientific, Check Point Software, Chemed, CME Group, Evercore, FirstService, Fiserv, Fortive, GE Vernova, General Dynamics, Group 1 Auto, Healthcare Services Group, Interpublic, International Paper, KBR, Lamb Weston, Lennox International, Navient, NextEra Energy, NextEra Energy Partners, Old Dominion Freight Line, Pacific Premier, Popular, PROG Holdings, Rogers Communications, Roper, Rush Enterprises, Silicon Labs, Taylor Morrison Home, TE Connectivity, Teledyne Technologies, Tenet Healthcare, Thermo Fisher Scientific, Tower Semiconductor, Travel + Leisure, United Community Banks, Vertiv, Wabash National & Weatherford International report earnings on Wednesday morning, with Chipotle Mexican Grill, Alamos Gold, Align Technology, Ameriprise Financial, Canadian Pacific Kansas City, Carlisle Cos, Celestica, Century Communities, Churchill Downs, Community Health, Core Labs, Edwards Lifesciences, Essential Properties Realty Trust, First American Financial, Flex, Ford Motor, Globe Life, Graco, Helmerich & Payne, IBM, ICON, Impinj, Invitation Homes, Kaiser Aluminum, KLA Corp, Knight-Swift Transportation, MaxLinear, Meritage Homes, Methanex, Moelis, Molina Healthcare, Newmont, Oceaneering International, O’Reilly Automotive, Pathward Financial, Pebblebrook Hotel Trust, Pegasystems, Plexus, QuantumScape, RenaissanceRe, Republic Services, Rollins, Sallie Mae, ServiceNow, South State, Teradyne, Tyler Technologies, United Rentals, Universal Health, Valmont Industries, Viking Therapeutics, Waste Connections, Waste Management & Wyndham Hotels & Resorts all scheduled to report after the session’s close.

Thursday the action picks up at 8:30 am when GDP, Initial Jobless Claims, Durable-Goods Orders, Durable-Goods minus Transportation, Advanced U.S. Trade Balance in Goods, Advanced Retail Inventories & Advanced Wholesale Inventories data are all scheduled for release.

AbbVie, Arch Resources, AstraZeneca, Bread Financial, Brunswick, CBRE Group, Comcast, Cullen/Frost, Darling Ingredients, Dover, Dow, DTE Energy, EMCOR Group, Expro Group, FTI Consulting, Harley-Davidson, Hasbro, HNI, Honeywell, IMAX, Integer Holdings, Keurig Dr Pepper, Lazard, Lear, LKQ, Masco, Mohawk, NASDAQ, Northrop Grumman, NovoCure, Pool, Precision Drilling, Reliance, RPM, RTX, Ryder System, Sanofi, Southside Banc, Southwest Air, STMicroelectronics, TechnipFMC, Teck Resources, Tractor Supply, Tradeweb Markets, TransUnion, TRI Pointe Homes, Union Pacific, Valero Energy, Valley National, Visteon & West Pharmaceutical Services all report earnings before Thursday’s opening bell, followed by Agnico-Eagle Mines, Allison Transmission, Ameris Bancorp, AppFolio, Arthur J. Gallagher, Baker Hughes, BJ Restaurants, Boston Beer, Boyd Gaming, Cincinnati Financial, Columbia Banking, Columbia Sportswear, Coursera, Cousins Properties, Customers Bancorp, Deckers Outdoor, Dexcom, Digital Realty Trust, Eastman Chemical, Edison, Exponent, Federated Hermes, First Financial Bancorp, First Interstate Bancsystem, Gaming and Leisure Properties, Hartford Financial, Healthpeak Properties, Juniper Networks, Kinsale Capital, L3Harris Technologies, LendingTree, LPL Financial, McGrath RentCorp, Minerals Technologies, NOV, Olin, Phillips Edison & Company, Principal Financial Group, Provident Financial Services, Selective Insurance, Skechers USA, SkyWest, SPS Commerce, SS&C Technologies, Terex, Texas Roadhouse, TFI International, Ultra Clean Holdings, Veralto, VeriSign, WesBanco, Weyerhaeuser, Willis Towers Watson & WSFS Financial after the closing bell.

Friday morning is also a busy one on the data-front, starting at 8:30 am when we get Personal Income (nominal), Personal Spending (nominal), PCE Index, PCE Year-over-Year, Core PCE Index & Core PCE Index Year-over-Year data, followed by Consumer Sentiment (final) data at 10 am.

3M reports earnings Friday morning, along with AllianceBernstein, Aon, Avantor, Balchem, Barnes Group, Booz Allen Hamilton, Bristol-Myers Squibb, Centene, Charter Communications, Colgate-Palmolive, First Hawaiian, Franklin Resources, Gentex, GrafTech International, Imperial Oil, Newell Brands, Portland General Electric, Saia, Sensient, Stellar Bank, T. Rowe Price, TriNet Group & WisdomTree.

See you back here next week!

*** I DO NOT OWN SHARES OR OPTIONS CONTRACT POSITIONS IN SPY, QQQ, IWM OR DIA AT THE TIME OF PUBLISHING THIS ARTICLE ***

Weekly Stock & ETF Market Review 7/14/2024

SPY, the SPDR S&P 500 ETF added +0.96% last week, while the VIX closed the week at 12.46, indicating a one day implied move of +/-0.79% & a one month implied move of +/-3.6%.

SPY ETF - SPDR S&P 500 ETF's Technical Performance Over The Past Year
SPY ETF – SPDR S&P 500 ETF’s Technical Performance Over The Past Year

Their RSI is still in overbought territory despite having deflated slightly last week & still sits at 73, while their MACD remains bullish but is losing steam & looking like it will cross over the signal line bearishly in the first half of the week.

Volumes were -41.54% below the prior year’s average volume (41,637,020 vs. 71,227,029), indicating that there are still a lot of market participants who are sitting on the sidelines still watching to see what happens in the near-term.

Monday began the week on an uncertain note, where a low volume session resulted in a spinning top, however the open-closing price range was concentrated in the top of the day’s candle, signaling there was some appetite to go higher.

The trend continued into Tuesday, when prices advanced slightly on the week’s lowest volume & the day’s candle resulted in a doji, indicating further uncertainty & temporary equilibrium in prices for SPY.

Things began to heat up on Wednesday though, as prices opened slightly higher, tested a bit lower before making the biggest one day gain of the week & setting up what looks to be a new consolidation range based on the rest of the week’s price action.

Thursday saw some of the week’s highest volume in a session that resulted in a bearish engulfing candle, where there was a slight bit of interest in prices going higher based on the day’s upper shadow, but ultimately bears took control of the session & pushed prices down to close below Wednesday’s open.

Friday was a mixed bag, where prices opened above Thursday’s close & marched much higher, only to be met with extreme selling pressure as folks took a risk-off into the weekend approach to close the session only +0.63%.

While the upper shadow of Friday’s candle shows that there were some bullish folks out there, there was not enough staying power to keep them from selling & taking profits before heading off for the weekend.

As noted above, it looks like Wednesday’s session will prove to have established a new range that SPY will fluctuate around in for the near-term unless earnings reports turn out to be incredibly bullish.

With the waning histogram levels on the MACD & the slope of the line in relation to the signal, it appears that it is ready to make a move at a bearish crossover by later on this week.

Given that a new all-time high was reached on Friday, another area to watch is Friday’s high price, which has now become the only resistance level for SPY’s chart.

There’s extremely limited historical data for this price point, making it difficult to anticipate how market participants will behave at it, which makes it even more imperative to have a keen eye on it going into a new week.

Prices have separated themselves from the 10 day moving average following Wednesday’s move, making them further from their nearest support level.

This is important as upon any test of it there may be increased selling pressure based on how SPY has behaved previously when their 10 & 50 DMAs were the first two levels of SPY’s support.

Volume will also be a key area to be watching, as after months of low volume in relation to the previous year’s average levels any uptick in buying or selling pressure can be viewed as a sentiment factor at these high price levels.

If SPY is to continue grinding higher it’s going to need a strong increase in sentiment, as otherwise one or two days of profit taking can lead to steeper declines.

SPY’s Average True Range has been climbing over the past week, which should continue on into this week as volatility is likely to increase in the near-term.

SPY has support at the $553.36 (10 Day Moving Average, Volume Sentiment: NULL, 0:0*), $533.86 (50 Day Moving Average, Volume Sentiment: NULL, 0:0*), $531.35 (Volume Sentiment: NULL, 0:0*) & $522.92/share (Volume Sentiment: NULL, 0:0*) price levels, with resistance at the $563.67/share (All-Time High, Volume Sentiment: NULL, 0:0*) price levels.

SPY ETF's Price Level:Volume Sentiment Over The Past 1-2 Years
SPY ETF’s Price Level:Volume Sentiment Over The Past 1-2 Years

QQQ, the Invesco QQQ Trust ETF that tracks the NASDAQ 100 had the worst week of the major index ETFs, declining -0.27%.

QQQ ETF - Invesco QQQ Trust ETF's Technical Performance Over The Past Year
QQQ ETF – Invesco QQQ Trust ETF’s Technical Performance Over The Past Year

Their RSI is trending back towards overbought conditions & is currently at 65, while their MACD is bullish, but primed to cross over the signal line bearishly on Monday or Tuesday.

Volumes were -27.19% below the previous year’s average (32,556,580 vs. 33,409,553), which should raise an eyebrow given that the highest volume session of the week by a long-shot was Thursday’s declining session.

QQQ’s week started on a similar note to SPY’s, a spinning top candle on Monday indicated that there was a bit of hesitancy & indecision on the part of market participants, which was further confirmed by the session having the lowest volume of the week.

Tuesday is when the cracks began to show & it became evident that folks were getting a bit nervous & antsy, as the session opened higher & tested slightly above the open, only to succumb to the bears & be pushed to close lower than the open.

Wednesday began the three day pattern formation of the “%” (while I’ve never seen it written that way formally in my studies, it does look exactly like one), as prices opened higher & continued climbing into the session, establishing a new all-time high & closing not far beneath it.

Thursday exposed the weakness in QQQ, when a bearish engulfing candle showed that there was beginning to be a bit of fear in the market, as prices opened above Wednesday’s session & were pushed below even the previous Friday’s daily price range lows on volume levels not seen since late May.

Prices were supported by the 10 day moving average on Thursday, which is going to be a key area to keep an eye on this coming week.

Friday resulted in a bullish session, but it came with bearish implications, as based on the size of Friday’s candle’s upper shadow either bulls were out in full force & wanted to take some profits going into the weekend, or the well of enthusiasm for QQQ has begun to go dry in the near-term.

It should be noted that the 10 DMA held up as a support level on Friday too, but it is tough to tell how long that can last for heading into a new week of earnings & economic data.

QQQ’s MACD is another area to be focused on this week, as it is currently primed to cross over bearishly in the coming day or two.

If this happens, expect a lot more volatility & more advancing of their Average True Range, as well as a run to test the 50 day moving average, which is currently QQQ’s second level of support.

While there is also support in the window that formed by the gap up in the second week of June, the 50 DMA may have moved into that price window by the time of a test, given that the window begins just above the $470/share price level from the top & $467/share from the bottom.

While Friday’s candle did form a bullish harami with Thursday’s, we may be looking at a situation similar to April 4-5th, where prices fluttered around in the range of the 4th’s wide-range bearish candle for about a week before falling into decline.

This would form a double top with QQQ’s all-time high reached on Tuesday & confirm the strength of its resistance.

QQQ has support at the $492 (10 Day Moving Average, Volume Sentiment: NULL, 0:0*), $464.62 (50 Day Moving Average, Volume Sentiment: NULL, 0:0*), $459.85 (Volume Sentiment: NULL, 0:0*) & $448.63/share (Volume Sentiment: NULL, 0:0*) price levels, with resistance at the $503.52/share (All-Time High, Volume Sentiment: NULL, 0:0*) price levels.

QQQ ETF's Price Level:Volume Sentiment Over The Past 1-2 Years
QQQ ETF’s Price Level:Volume Sentiment Over The Past 1-2 Years

IWM, the iShares Russell 2000 ETF advanced +6.11% last week, as small cap names were the darlings of the week.

IWM ETF - iShares Russell 2000 ETF's Technical Performance Over The Past Year
IWM ETF – iShares Russell 2000 ETF’s Technical Performance Over The Past Year

Their RSI crossed into overbought territory on Friday & is currently at 71.33, while their MACD is bullish, but does not appear to be on firm footing due to the rapid nature of its ascent.

Volumes were +4.28% above the previous year’s weekly average (34,840,240 vs. 33,409,553), due entirely to the strong bullish volume of the gap up sessions on Thursday & Friday.

Monday kicked the week off on a note of uncertainty, where low volumes & a long legged doji were the results of the day; prices tread water after having tested a good amount of price levels to the upside & downside & ultimately the support of the 50 day moving average was held in-tact.

Tuesday the bears got into IWM, with a session that opened lower than Monday, tested a bit higher but was rejected by the 50 DMA’s resistance & ultimately declined below the 10 DMA’s support before settling for the day in line with it.

There was a more optimistic air for IWM on Wednesday, when prices opened above Tuesday’s range & the 10 DMA, tested below the 10 DMAs support, before advancing beyond the resistance of the 50 DMA & managing to close above it as a support level.

Thursday opened with a gap up accounting for most of the week’s advances & was able to continue to climb higher on higher volumes than IWM has seen since February to close at over $210/share, breaking through the resistance zone that we’ve noted is at the $209/share price level.

The week wrapped up Friday with a similar, but less enthusiastic session that closed with a touch of warning.

Friday gapped up on the open & made a run at the $215/share level for IWM, but was unable to find footing & bears sent prices to close lower, with the day’s candle closing as a shooting star, which has near-term bearish implications.

IWM’s volume on Friday was high, which poses an interesting question: was the high volume due to folks who thought they missed the action on Thursday who went jumping into the water chasing IWM’s climb up, or was it more centered around people who’d profited already from earlier in the week selling & causing the long upper shadow of the shooting star candle?

The window created by Friday’s gap up will be an area of focus this week, as we wait to see if it serves as support or if it begins to fill.

Should it begin to fill the $211.29/share former 52-week high will be the first support level & how strong or weak it holds up will be key for determining the true strength behind the moves of the last two sessions.

December 12-13th of 2023 were the last time IWM’s RSI crossed into overbought territory, as it tends to stick more to oscillating around the neutral level in between the bounds of overbought & oversold.

When prices began to decline back from the RSI being in overbought territory there was a peak to trough decline of 8%+, which is something to be mindful of moving forward.

IWM has support at the $211.29 (Volume Sentiment: Buyers, 2.75:1), $209.29 (Volume Sentiment: Buyers, 2.75:1), $209.19 (Volume Sentiment: Buyers, 2.75:1) & $207.27/share (Volume Sentiment: Buyers, 1.83:1) price levels, with resistance at the $214.94/share (52-Week High, Volume Sentiment: NULL, 0:0*) price levels.

IWM ETF's Price Level:Volume Sentiment Over The Past 1-2 Years
IWM ETF’s Price Level:Volume Sentiment Over The Past 1-2 Years

DIA, the SPDR Dow Jones Industrial Average ETF gained +1.68% this past week, closing the week with a fresh all-time high.

DIA ETF - SPDR Dow Jones Industrial Average ETF's Technical Performance Over The Past Year
DIA ETF – SPDR Dow Jones Industrial Average ETF’s Technical Performance Over The Past Year

Their RSI just crossed into overbought territory on Friday & currently sits at 71.87, while their MACD is still bullish in the wake of the ascent that began in mid-June, which will be something to keep an eye on heading into the new week.

Volumes were the strongest for DIA last week of all the major indexes, coming in at +15.11% above average vs. the previous year (4,032,500 vs. 3,503,263), which provides some validation to the upwards price move, but is not entirely convincing just yet based on Friday’s price behavior.

DIA’s week started off on a rocky note, with Monday’s session having the lowest volumes of the week & resulting in a spinning top, indicating indecisiveness by market participants.

There was certainly a bullish appetite based on the long upper shadow, but the lower shadow also signaled that there were plenty of bears out there as well.

The 10 day moving average’s support did manage to hold up though & prices closed above it.

Tuesday was extremely similar to Monday, with less of a wise range between the open & closing prices on a declining session with slightly more volume.

Despite prices breaking temporarily below the 10 day moving average, they were able to recover & the session closed above it.

Wednesday provided a big leg up that was able to propel DIA into the close of the week, where the week’s second highest volume took an open at the 10 DMA & resulted in a +1% day-over-day gain.

The back end of the week is where trouble began brewing despite the advances.

Thursday was a showing of indecision as the session closed out as a doji just above the close of Wednesday on slightly less volume.

Friday looks at face value to have been a bullish sentiment day, but looking beneath the hood it isn’t entirely clear that that was truly the case.

DIA gapped up Friday morning on the open and based on its lower shadow briefly tested lower before powering to a new all-time high.

The troubling part comes down to the fact that the day’s candle closed as a shooting star with a slight lower shadow.

That lower shadow signals that there was still some bearish reluctance to continue higher in the direction of the opening gap during the session.

Another area of concern is the long upper shadow of the candle, as much like IWM’s Friday candle it can mean two things.

Either there was extreme optimism & most of that volume occurred due to the gap up & the bullish sentiment behind it, and or it occurred due to the long upper shadow, when market participants picked up some of their chips that they accumulated throughout the week & put them away before going into the weekend.

With this in mind, it will be wise to enter this week being prepared for some of the inflow volume of the latter end of the week to be sold as well.

DIA’s RSI is beginning to look like we may see a repeat of what occurred from mid-July 2023 to November of 2023, when overbought conditions persisted into August before declining through October.

Peak to trough that long-winded decline was -8.96% when all was said & done.

There are plenty of support levels for DIA that aren’t far off from their price as they have remained relatively bouncing around rangebound in 2024 following that steep November 2023 year end rally.

How this is impacted by any declines in the more fragile SPY or QQQ is yet to be seen, but will be something to keep an eye on should the time come.

DIA has support at the $399.83 (Volume Sentiment: Buyers, 0.6:0*), $397.13 (Volume Sentiment: Buyers, 0.6:0*), $395.59 (Volume Sentiment: Sellers, 3.5:1) & $394.40/share (10 Day Moving Average, Volume Sentiment: Sellers, 3.5:1) price levels, with resistance at the $402.69/share (All-Time High, Volume Sentiment: NULL, 0:0*) price levels.

DIA ETF's Price Level:Volume Sentiment Over The Past 3-4 Years
DIA ETF’s Price Level:Volume Sentiment Over The Past 3-4 Years

The Week Ahead

Monday starts the week off with Empire State Manufacturing Survey data at 8:30 am, followed by Fed Chairman Powell speaking at 12 pm.

BlackRock & Goldman Sachs report earnings before Monday’s opening bell.

U.S. Retail Sales, Retail Sales minus Autos, Import Price Index & Import Price Index minus Fuel data are all scheduled to be released at 8:30 am on Tuesday, followed by Business Inventories & Home Builder Confidence Index data at 10 am & Fed Governor Kugler speaking at 2:45 pm.

Tuesday morning begins with earnings reports from Bank of America, Morgan Stanley, PNC, Progressive, State Street & United Health Group, with Fulton Financial, Hancock Whitney, Interactive Brokers, J.B. Hunt Transport, Omnicom & Pinnacle Financial Partners scheduled to report after the closing bell.

Wednesday begins with Housing Starts & Building Permits data at 8:30 am, Industrial Production & Capacity Utilization data at 9:15 am & winds down with the Fed’s Beige Book at 2pm.

Johnson & Johnson, Ally Financial, ASML, Citizens Financial Group, Elevance Health, First Horizon, Northern Trust, Prologis, Synchrony Financial & U.S. Bancorp report earnings Wednesday morning, followed by Alcoa, Bank OZK, Cohen & Steers, Crown Castle, Discover Financial Services, Equifax, F.N.B. Corp., Home Bancshares, Kinder Morgan, Rexford Industrial Realty, SL Green Realty, Steel Dynamics, Synovus, United Airlines & Wintrust Financial reporting after the closing bell.

Initial Jobless Claims & Philadelphia Fed Manufacturing Survey data are released at 8:30 am on Thursday, before U.S. Leading Economic Indicators data comes out at 10 am.

Abbott Laboratories, Berkshire Hills Bancorp, Cintas, Commerce Bancshares, D.R. Horton, Domino’s Pizza, Hexcel, Insteel Industries, KeyCorp, M&T Bank, Manpower, Marsh & McLennan Companies, OFG Bancorp, Snap-On, Texas Capital, Textron, Virtu Financial & WNS report earnings Thursday before the opening bell, followed by Netflix, AAR Corp, Glacier Bancorp, PPG Industries, Resources Connection & Western Alliance Bancorp after the closing bell.

Friday ends on a quieter note, with NY Fed President Williams speaking at 10:40 am & Atlanta Fed President Bostic speaking at 1 pm.

American Express, Autoliv, Badger Meter, Comerica, Fifth Third Bancorp, Halliburton, Huntington Bancshares, Regions Financial, SLB & Travelers Companies are all due to report earnings before Friday morning’s opening bell.

See you back here next week!

*** I DO NOT OWN SHARES OR OPTIONS CONTRACT POSITIONS IN SPY, QQQ, IWM OR DIA AT THE TIME OF PUBLISHING THIS ARTICLE ***

Visualizing The Performance Of The VIX Vs. SPY Over The Past Year

The CBOE Volatility Index is often referred to by investors & market pundits as “fear & greed index”, as it provides a view of future volatility in the near-to-mid-term that is reported as an annualized figure.

At a high level, it is calculated as a measure of at & out-of-the-money S&P 500 index options put & call contracts for the next two standard expiration dates that have over eight days until their expiration (up until there are two consecutive strike prices with no posted bid-ask pricing).

The midpoint of the bid-ask spread for the nearest at-the-money options in the series is then used to ultimately create a forward price for a synthetic option for the S&P 500 & the implied volatility of the synthetic option is what is quoted as the VIX on television & in newspapers.

The implied volatility is an annualized estimate of how much the price of the underlying security (in this case the S&P 500’s synthetic option) may move based on how market participants are currently buying & selling the security.

With this in mind, it can be inferred that there is a strong link between optimism/pessimism related to the S&P 500’s performance & the VIX reading, as more options tend to be traded when investors need protection from volatility (buying puts or selling out-of-the-money calls) leading to a higher VIX reading when the S&P 500 declines.

Using SPY as a proxy (the S&P 500 ETF) the relationship between the VIX reading, daily SPY changes & changes in trading volume will be examined in the following article.

Note that the date range used for historic data was 7/10/2023 to the closing data of 7/9/2024, resulting in 251 sessions of usable data (given that the one-day implied S&P 500 move based on a VIX closing price is a reflection of tomorrow’s change, not that same day’s closing price).

Examining The Relationship Between The VIX, SPY & Daily Volume

The closing VIX reading for 7/10/2023 was 15.07, while SPY’s closing price that day was $433.595, implying that SPY would close within a range of +/-0.95% on 7/11/2023 (30 Day/1 Month implied move of +/-4.36%).

The following day SPY closed at $436.36, a change of +0.64%, meaning that it fell within the VIX’s predicted one day implied volatility.

SPY’s volume increased by 3.24% day-over-day, with 7/10/2023’s volume being 62,443,500 & 7/11/2023’s volume being 64,463,800.

As mentioned above, there were 251 total session’s used in this article (as it began being written before 7/10/2024’s close).

The VIX proved to be a fairly accurate calculation, as 81.3% (204 sessions) of the time in the past year the price of SPY closed within the range of the VIX reading, with 18.3% of the time (47 sessions) SPY outperforming it to the upside or the downside (recall that the VIX does not provide a direction of the movement, just the magnitude of it).

81.3% Of The Past Year's Sessions The VIX Has Correctly Anticipated The Range Of Movement Of SPY For The Next Day's Session, While 18.7% Of Sessions SPY Closed Outside Of The VIX's One Day Implied Price Range
81.3% Of The Past Year’s Sessions The VIX Has Correctly Anticipated The Range Of Movement Of SPY For The Next Day’s Session, While 18.7% Of Sessions SPY Closed Outside Of The VIX’s One Day Implied Price Range

When looking at it from the perspective of a five day trading week, over the past year each week had about four days where SPY closed within the VIX’s predicted range, with roughly one day per week where it closed with a higher variance level than the VIX indicated (recall that it is predicting that moves will come in either direction, up or down).

When we isolate the times that SPY closed above or below the reading that the VIX implied, we find that 76.6% of the time (36 sessions) SPY had higher volumes than the previous day.

This would be expected, as often more volatile sessions are accompanied with higher trading volume, leaving 11 sessions (23.4%) occurring on days where the day-over-day volume change was lower than the day before.

In 76.6% Of Sessions In The Past Year When SPY Closed Outside Of The VIX's Predicted One Day Range SPY's Day-over-Day Volume Was Higher Than The Previous Day
In 76.6% Of Sessions In The Past Year When SPY Closed Outside Of The VIX’s Predicted One Day Range SPY’s Day-over-Day Volume Was Higher Than The Previous Day

The average volume that SPY traded at during the time outlined above was 71,520,866.27, making it worth digging into how each sessions’ average volume fared in relation to SPY’s performance & the VIX.

In total, 111, or 44.2% of all days traded above that average volume quoted above, while 140 sessions (55.8%) traded below it.

For the sessions where SPY traded at a greater daily variance than what was predicted by the VIX, 80.85% of sessions (38) occurred on volumes that were above the annual average.

19.15% of sessions (9) where SPY traded outside of the predicted range of the VIX occurred on sessions with below average volume.

Looking at days where SPY closed within the range that the VIX predicted things look quite different, with only 35.8% of sessions (73) having above average volume & 64.2% of sessions (131) occurring with lower than average volume.

This can in part be explained by the dramatically larger sample size & the nature of the calculation, but was worth examining to see how the numbers fell in line with the other data points listed.

Comparing The One-Day Returns Of SPY Relative To The VIX's One-Day Implied Range Of S&P 500 Movement In Relation To Each Session's Volumes Vs. The Annual Average Volume
Comparing The One-Day Returns Of SPY Relative To The VIX’s One-Day Implied Range Of S&P 500 Movement In Relation To Each Session’s Volumes Vs. The Annual Average Volume

Tying It All Together

As we can see, the VIX does a pretty solid job of predicting the one day range that SPY prices will land in the following day.

While the performance may change if we changed the range to more than one year, 251 sessions is significant enough to draw conclusions from.

One thing to note is that while there has been some volatility in that sample size, the largest peak to trough drawdown was -9.5%, so expanding the sample size to include more years with greater volatility would likely change the results (such as past 2022, when there was a -26.6% decline peak to trough at the beginning of the year).

This is something that should be kept in mind in the event that there is increased volatility compared to the past year if referencing these results.

It is certainly something to keep in the back of one’s mind when watching intra-day sessions that have volumes that are higher than average out of the gate at the open/by midday, although other nearby candles & possible pattern formations should also be assessed before using it to make live predictions.

As always, this is not intended to be financial advice, just some observations about past market performance.

*** THIS IS NOT INTENDED TO SERVE AS FINANCIAL ADVICE, BUT RATHER AN ANALYSIS OF PAST MARKET BEHAVIOR – AS ALWAYS, DO YOUR OWN DUE DILIGENCE BEFORE PARTICIPATING IN FINANCIAL MARKETS ***

Weekly Stock & ETF Market Review 7/7/2024

SPY, the SPDR S&P 500 ETF gained +1.91%, as weak volumes continued to plague the major index ETFs, while the VIX closed the week out at 12.48, implying a one day move of +/-0.79% & a one month implied move of +/-3.61%.

SPY ETF - SPDR S&P 500 ETF's Technical Performance Over The Past Year
SPY ETF – SPDR S&P 500 ETF’s Technical Performance Over The Past Year

Volumes were well below average for the ninth consecutive week, coming in at -46.16% below the year prior’s average volume (38,725,950 vs. 71,930,498), which as we’ve noted each week is an area of increasing concern.

Despite the Fourth of July holiday & the half day trading session on the third reducing the week by ~30% there was still frothy light volume for now the ninth consecutive week.

While it is summertime, the low levels are still indicative of fear & reluctance to dive into markets while most of major indexes sit near all-time highs.

Monday signaled that the week ahead was likely in line with most peoples’ expectations, weak volume, but advancing.

A dragonfly doji set the stage for SPY to climb for the rest of the week, although the open & close were relatively in line with the 10 day moving average, which while it indicates that there is some strength in it as a support level, should be a cause of concern.

The rest of the week (which again, was 70% of a regular week in terms of the hours the market was open) continued to climb above the 10 DMA, but on volumes that looked more like the attendance at a kindergarten soccer game vs. a publicly traded ETF following the S&P 500.

Their RSI has climbed back into overbought territory after the surprise advances of the past week & currently sits at 76.97, while their MACD has crossed over bullishly, but is still tightly hugging the signal line.

While folks will say there is a stronger trend when candles are covering a wider range (particularly with little to no shadows), there is very little conviction behind the recent price movements.

This upcoming week has limited data releases aside from the CPI/PPI prints on Thursday & Friday, but earnings season is revived with the first of the big banks scheduled to report on Friday.

Indicators & oscillators suggest that the time for a mid-summer cool off is upon us, and the biggest question for most right now is what’s going to cause it?

JPM’s chart’s evening star pattern seems to think so (per Sunday night reading, vacation time so this won’t be published until Wednesday PM) & bank stocks control the spigot that supplies the market hose (also hat tip to Jaime Dimon as this may be the first time a weekly post has featured an individual stock name).

JPM's Technical Performance Over The Past Year
JPM’s Technical Performance Over The Past Year

Not much has changed in terms of what to look at for SPY from last week’s note given the nature of how it traded & on the shorter time frame.

While they managed a new all-time high, the amount of conviction & sentiment behind the move was minimal at best & it appears that we’re skating on thin ice.

Based on the prolonged low volumes (9 weeks now), it is hard to imagine much of a catalyst given where markets stand now that would be able to power SPY & co. much higher in the near-term.

As noted last week, it’s still more of a question of whether we have a small consolidation or outright correct.

Volatility decreased slightly last week, but again, not much has changed from last week in terms of what to keep an eye on.

SPY has support at the $546.86 (All-Time High, Volume Sentiment: NULL, 0:0*), $531.35 (Volume Sentiment: NULL, 0:0*), $528.50 (50 Day Moving Average, Volume Sentiment: NULL, 0:0*) & $522.92/share (Volume Sentiment: Even, 1:1) price levels, with resistance at the $555.05/share (All-Time High, Volume Sentiment: NULL, 0:0*) price level.

SPY ETF's Price Level:Volume Sentiment Over The Past 1-2 Years
SPY ETF’s Price Level:Volume Sentiment Over The Past 1-2 Years

QQQ, the Invesco QQQ Trust ETF that tracks the NASDAQ 100, had the strongest week of the major four index ETFs, advancing 3.56%.

QQQ ETF - Invesco QQQ Trust ETF's Technical Performance Over The Past Year
QQQ ETF – Invesco QQQ Trust ETF’s Technical Performance Over The Past Year

Their RSI has also trended into overbought territory & is currently 76.64, while their MACD has crossed over bullishly in the past week.

Volumes were -45.52% below the year prior’s average volume (24,538,100 vs. 45,038,444), as much like SPY & the other major index ETFs, everybody’s moved.

The primary difference between QQQ’s chart & SPY’s chart is the hammer candle from Monday’s session.

This indicated more conviction behind the move higher, contributing to QQQ being the strongest performing major index ETF of the four.

With the fluffy volume last week’s primary areas to look at are all still in play, perhaps we learn that last week was a silent squeeze.

For those that missed last week’s note, the strength of the 10 day moving average will set the stage for the next 3-4 weeks for QQQ & SPY.

The new all-time highs only make the declines more troubling, given that the primary support level is the 10 DMA, which is moving higher by its nature & becoming more decoupled from the regular price point support levels.

There is next to no volume strength at these levels, making a consolidation easily able to turn into a more serious decline.

CPI/PPI aren’t necessarily what market participants are holding in as high of regard for an inflation read vs. PCE, so what happens during earnings calls starting Friday will likely be what queues an issue, as it seems unlikely that folks have been holding out this much eagerly anticipating earnings reports to dive back into the pool.

For last week’s post & the areas to continue watching see here.

QQQ has support at the $482.99 (10 Day Moving Average, Volume Sentiment: NULL, 0:0*), $459.85 (Volume Sentiment: NULL, 0:0*), $457.65 (50 Day Moving Average, Volume Sentiment: NULL, 0:0*) & $448.63/share (Volume Sentiment: NULL, 0:0*) price levels, with resistance at the $496.60/share (All-Time High, Volume Sentiment: NULL, 0:0*) price level.

QQQ ETF's Price Level:Volume Sentiment Over The Past 1-2 Years
QQQ ETF’s Price Level:Volume Sentiment Over The Past 1-2 Years

IWM, the iShares Russell 2000 ETF had the worst week of the major four index ETFs, declining -1% for the week.

IWM ETF - iShares Russell 2000 ETF's Technical Performance Over The Past Year
IWM ETF – iShares Russell 2000 ETF’s Technical Performance Over The Past Year

Their RSI is trending downward from the neutral level & sits currently at 47.35, while their MACD has been bullish, but remains tightly hugging the signal line due to the recent consolidation range IWM has traded in.

Volumes were -46.43% below average compared with the year prior (17,881,775 vs. 33,382,304), as even the small cap index can’t escape the lazy summer participation.

As has been noted every week for some time now, IWM & DIA charts have decoupled from SPY & QQQ for a while now, as AI names & other major tech components of the former indexes have helped keep them moving higher, while the former have spent more time consolidating.

What becomes more troubling about this is that since early May IWM has been consolidating alongside DIA, while SPY & QQQ have continued marching higher.

In the event of a consolidation or correction in SPY & QQQ, a large question becomes whether that will cause an equal reaction from IWM & DIA, or if it will cause some sort of pivot into their components & they will avoid major losses.

Monday last week began on a bearish note with prices opening mid-way through Friday’s range, testing below the support of both the 10 & 50 day moving averages, before ultimately settling just above the 10 DMA, but below the 50 DMA on the week’s highest volume session.

Tuesday made an attempt to break back above the 50 DMA, but was unsuccessful & closed just beneath it, but cracks were shown in IWM as prices temporarily dipped beneath the 10 DMA as well.

The weakness was confirmed with Wednesday & Friday’s sessions, when on Wednesday prices opened in line with the 50 day moving average before bounding higher to above the 50 day moving average, only to close lower, closer to in-line with the prior day’s close on the weakest volume of the week.

It should be noted that Wednesday was a half-day & should it have been a full session it was possibly going to be the highest volume of the week, but the candle closed as what would have been a shooting star if it occurred in a true uptrend, indicating bearish feeling.

The trouble continued into the close of the week when prices opened on a gap down in-line with the 10 DMA, only to temporarily dip above it before testing far below it & closing beneath the support of the 10 DMA.

The strength of the support zone between $197-198.60 will be a key area of focus in the coming weeks now that prices have broken down beneath the 10 & 50 day moving averages & while we await more meaningful volume to indicate strength of sentiment of IWM traders.

For last week’s post & the areas to continue watching see here.

IWM has support at the $198.60 (Volume Sentiment: Buyers, 2.47:1), $198.35 (Volume Sentiment: Buyers, 2.47:1), $197.41 (Volume Sentiment: Buyers, 3.38:1) & $195.35/share (Volume Sentiment: Buyers, 1.06:1) price levels, with resistance at the $201.29 (10 Day Moving Average, Volume Sentiment: Buyers, 1.08:1), $202.30 (50 Day Moving Average, Volume Sentiment: Buyers, 1.08:1), $203.68 (Volume Sentiment: Buyers, 1.08:1) & $204.40/share (Volume Sentiment: Buyers, 1.83:1) price level.

IWM ETF's Price Level:Volume Sentiment Over The Past 1-2 Years
IWM ETF’s Price Level:Volume Sentiment Over The Past 1-2 Years

DIA, the SPDR Dow Jones Industrial Average ETF climbed +0.66% last week.

DIA ETF - SPDR Dow Jones Industrial Average ETF's Technical Performance Over The Past Year
DIA ETF – SPDR Dow Jones Industrial Average ETF’s Technical Performance Over The Past Year

Their RSI is trending towards overbought (70) & currently sits at 60.18. while their MACD has stayed bullish following their recent consolidation.

Volumes were -38.48% below average compared with the year before’s average volumes (2,144,550 vs. 3,485,855), where it appears investors were doing the bare minimum to keep it afloat above the support of the 10 DMA.

Monday began DIA’s week on a weak outlook, where despite the week’s highest volumes prices were unable to crack above the prior Friday’s high & ultimately closed below where they opened just in-line with the 10 DMA’s support.

Tuesday opened below the 10 DMA, but was able to rally & push higher to close higher, but it should be viewed with a skeptical eye as despite completing the bullish engulfing 2 day pattern, the day’s wide range was not supported by the low volume.

Wednesday came in bearish for DIA, opening higher but showing that there was still more downside appetite than upside, as it tested the support of the 10 DMA, but ultimately closed just beneath Tuesday’s close.

It should be noted that the downside volume on Wednesday was slightly less than the upside volume on Monday, calling into question/further confirming the skeptical eye mentioned regarding Tuesday’s price action.

Friday ended the week on a further note of uncertainty, as the case for the bulls heading into the weekend was that the open-close price action was concentrated at the top of the day’s candle, but the reality of it was that the high of the day failed to break out of the recent high-range & the low of the day broke through the 10 DMA’s support.

The coming week’s performance will hinge upon whether or not that high range can be broken out of & or if the support of the 10 & 50 DMAs will be broken to the downside.

Their recent ascending triangle forming indicates that there is more appetite at the top of their recent trading range, but the lackluster volumes of the past couple of months don’t provide as much confirmation as one would like to see.

For last week’s post & the areas to continue watching see here.

DIA has support at the $392.15 (10 Day Moving Average, Volume Sentiment: Sellers, 3.5:1), $391.04 (Volume Sentiment: Buyers, 1.08:1), $390.24 (Volume Sentiment: Buyers, 1.08:1) & $388.91/share (50 Day Moving Average, Volume Sentiment: Buyers, 1.08:1) price levels, with resistance at the $395.59 (Volume Sentiment: Sellers, 3.5:1), $397.13 (Volume Sentiment: Buyers, 0.6:0*) & $399.83/share (All-Time High, Volume Sentiment: Buyers, 0.6:0*) price level.

DIA ETF's Price Level:Volume Sentiment Over The Past 3-4 Years
DIA ETF’s Price Level:Volume Sentiment Over The Past 3-4 Years

The Week Ahead

Next week begins on a slow note with Consumer Credit data released on Monday at 3pm.

Greenbrier reports earnings on Monday morning before the opening bell.

Tuesday brings us NFIB Optimism Index data at 6 am.

Helen of Troy reports earnings before Tuesday’s opening bell, before SMART Global reports after the close of trading.

Wholesale Inventories data is scheduled to be released Wednesday at 10 am.

Wednesday’s earnings calls include AZZ, PriceSmart &WD-40, all due to report after the closing bell.

Things heat up on Thursday with Initial Jobless Claims, Consumer Price Index, XPI Year-over-Year, Core CPI & Core CPI Year-Over-Year data at 8:30 am, followed by St. Louis Fed President Musalem speaking at 1pm &Monthly U.S. Federal Budget data at 2 pm.

Thursday morning kicks off with earnings from Delta Air Lines & Pepsi Co.

Friday the week wraps up with Producer Price Index, PPI Year-over-Year, Core PPI & Core PPI Year-over-Year data at 8:30 am, followed by Consumer Sentiment (prelim) data at 10 am.

Big bank earnings come back to town Friday, starting with JP Morgan Chase, Bank of New York Mellon, CitiGroup & Wells Fargo, with Fastenal also scheduled to report before the opening bell.

See you back here next week!

*** I DO NOT OWN SHARES OR OPTIONS CONTRACT POSITIONS IN SPY, QQQ, IWM OR DIA AT THE TIME OF PUBLISHING THIS ARTICLE ***

Weekly Stock & ETF Market Review 6/30/2024

SPY, the SPDR S&P 500 ETF tread water this week while the weak volume trend continued for an eighth consecutive week, dipping -0.05%, while the VIX closed the week at 12.44, indicating a one day implied move of +/-0.78% & a one month implied move of +/-3.6%.

SPY ETF - SPDR S&P 500 ETF's Technical Performance Over The Past Year
SPY ETF – SPDR S&P 500 ETF’s Technical Performance Over The Past Year

Their RSI is currently at 65.99 & trending back out of overbought territory due to Friday’s declining session after having spent a couple of weeks above 70, while their MACD has crossed over bearishly, indicating near-term declines are on the horizon.

Volumes were -36.35% below average compared to the prior year (46,059,666 vs. 72,363,608), indicating a severe hesitancy on the part of market participants & signaling flashes of fear.

This is compounded by the fact that for eight straight weeks there have been severely low volumes, which amounts to ~17% of the annualized average volume calculation, indicating that it has been dragged down even lower than it appears as higher volume sessions from last year have been dropped off from close to one fifth of the calculation.

Last week’s volume was low, but looked more acceptable due to the shortened trading week being reduced by 20% by day count, but another troubling element to the recent volume picture is that most of the higher volume days of June were declining sessions.

In fact, the last time there was an advancing session that had more volume than the highest volume sessions of June (which were declining sessions) came on May 31,2024.

Couple this with the narrow daily trading ranges shown by the real bodies & shadows of the candlesticks for the month of June , particularly towards the end of the month & it begins to paint a not so rosy picture for near-term stock performance.

Monday opened the week up with a negative note, as the session opened close to Friday’s close, tested a bit higher as shown by the candle’s upper shadow & then ultimately dropped down to test the support of the 10 day moving average, but managed to close the day above it.

Monday’s volume was also the second highest of the week, as the strongest volume sessions of the week came in the form of declining days.

The risk-averse theme continued into Tuesday, where an even lower volume day hugged the 10 DMA but resulted in a slight advance & the strength of the support level was maintained.

Wednesday opened right at the 10 DMA & was able to break out below it temporarily during the session, but by the end of the day bulls stepped back in to force a slight gain for the day, but between the low volume & the narrow price range of the day it did not inspire confidence in market participants.

Thursday was able to open near the close of Wednesday & stay above the 10 DMA.

However, Thursday’s session had the week’s lowest volume & narrowest trading range, setting the stage perfectly for Friday’s risk-off into the weekend move.

Friday set the tone for the coming week or two, as the day resulted in the week’s widest price daily price trading range on the week’s highest volume.

While there was a push to the upside to reach a new all-time high, all hopes quickly deflated after a move to the downside broke through the support of the 10 DMA & the session’s price also closed below it.

Friday’s candle bearishly engulfed Thursday’s, setting the stage for more cooling off in the next week(s).

SPY’s Average True Range began to advance late in the week due to the strength of Friday’s move & volume & it appears that it will continue to climb higher in the coming week or two as we see an increase in volatility.

This week will be a relatively quiet week on the economic data & earnings, however there will be a handful of Fed speakers, including Chairman Powell on Tuesday morning in Portugal.

With this in mind & the fact that there will be a half day of trading Wednesday & the market closed Thursday for July 4th all eyes should be on volumes this week, in particular looking at the relationship between how they stack up against recent full trading weeks’ volumes.

This week will feature ~30% less trading hours than usual, so while volumes should be expected to be lower than average, how much lower they are & in what direction the markets trade will be a strong tell about how the month of July is likely to go for SPY & the other major index ETFs.

Additionally, keep an eye on how prices behave as they approach the $540/share mark for SPY, as that is the gateway to the most recent gap up.

While the window itself should serve as a form of support, once it begins to fill it will provide additional insight into whether SPY will consolidate in the near-term or if there will be a more aggressive decline from Friday’s close.

The 10 day moving average is applying downward price pressure now & if there is a movement through the gap of early June we will be keeping an eye on the nearest support levels (including the 50 day moving average) which have not really been tested much & have limited trading volume around them.

In the event prices do get close to the 50 DMA & or should they break below them, a head & shoulders pattern may be forming with the left shoulder being the end of March/early April.

In the event of that happening, it is more than likely not to be this week due to the shortened nature of it, but it is worth keeping in the back of your mind for the future.

SPY has support at the $531.35 (Volume Sentiment: NULL, 0:0*), $524.41 (50 Day Moving Average, Volume Sentiment: NULL, 0:0*), $522.92 (Volume Sentiment: NULL, 0:0*) & $516.69/share (Volume Sentiment: Buyers, 2.5:1) price levels, with resistance at the $544.65 (10 Day Moving Average, Volume Sentiment: NULL, 0:0*) & $550.28/share (All-Time High, Volume Sentiment: NULL, 0:0*) price level.

SPY ETF's Price Level:Volume Sentiment Over The Past 1-2 Years
SPY ETF’s Price Level:Volume Sentiment Over The Past 1-2 Years

QQQ, the Invesco QQQ Trust ETF that tracks the NASDAQ 100 also was treading water with light volumes, closing -0.06% down for the week since last Friday’s close.

QQQ ETF - Invesco QQQ Trust ETF's Technical Performance Over The Past Year
QQQ ETF – Invesco QQQ Trust ETF’s Technical Performance Over The Past Year

Their RSI is currently at 64.54, also after having spent a couple of weeks in overbought territory, while their MACD crossed over bearishly earlier in the week.

Volumes were spotted out by the tumbleweeds, down -33.45% below the prior year’s average (30,136,911 vs. 45,282,963), indicating that the Q2 rally that kicked off in late April has likely run out of steam as market participants have become tired & skeptical about gains continueing.

Unlike SPY, QQQ had the strongest volume of last week on Monday, which was a declining day though.

Monday opened on a gap down & while the bears were not in full control (as indicated by the upper shadow of the session’s candle) they stepped in & pushed prices down below the support of the 10 day moving average & the session was unable to recover to close above it.

The upper shadow did set the stage for the middle three days of the week to slightly advance in a similar manner to SPY, weakest volume sessions of the week & straddling the 10 day moving average’s support.

Tuesday opened below the 10 DMA, tested lower, before ultimately climbing to close above it.

Wednesday opened in-line with the 10 DMA & bumped higher in a narrow-range day that resembled a spinning top candle without much upper or lower shadow, indicating that there was a great deal of hesitancy & temporary complacency at its current price level.

Thursday also opened in line with the 10 day moving average’s support propping the open higher, temporarily broke below the support level confirming that the prior two day’s price action was not built on strong foundations & was able to push higher.

Friday was the final squeeze early in the session as prices did open to the upside & test higher (long upper shadow), but much like SPY the rug was pulled out from under QQQ as profits were taken following the uncertainty of Thursday night’s debate & as investors eyed this coming short week.

Friday’s close was below the 10 DMA, giving its price downward pressure now in the form of a falling resistance level.

Friday’s bearish engulfing candle was able to make QQQ’s Average True Range begin to advance again, which looks set to continue this week as volatility seems primed to increase in the coming weeks.

Given that QQQ & SPY have both been the recipients of the good fortune that comes from having NVDA as a component recently the items to keep an eye out for this week area the same between the two indexes.

In QQQ’s case one additional thing to note is that their RSI appears to be in the midst of a bearish head & shoulders/just completed its right shoulder.

Watching their RSI as they decline will be important, especially as the approach the neutral mark of 50 midway through the oscillator as it may help give insight into magnitude of near-term price movements.

In terms of the head & shoulders pattern that is emerging on SPY’s chart, QQQ’s is a little different, but is still certainly in play, especially if the support of the early-June gap is broken & the 50 DMA is unable to support price action.

Fortunately for QQQ, their ascent had more consolidations, leading them to have more support levels that may help soothe any blows that their price takes better than SPY, whose more rapid ascent leaves it with less support at local levels.

QQQ has support at the $459.85 (Volume Sentiment: NULL, 0:0*), $452.17 (50 Day Moving Average, Volume Sentiment: NULL, 0:0*), $448.63 (50 Day Moving Average, Volume Sentiment: NULL, 0:0*) & $447.34/share (Volume Sentiment: Buyers, 3.67:1) price levels, with resistance at the $480.17 (10 Day Moving Average, Volume Sentiment: NULL, 0:0*) & $487.20/share (All-Time High, Volume Sentiment: NULL, 0:0*) price level.

QQQ ETF's Price Level:Volume Sentiment Over The Past 1-2 Years
QQQ ETF’s Price Level:Volume Sentiment Over The Past 1-2 Years

IWM, the iShares Russell 2000 ETF was the lone bright spot of the major four index ETFs this week, advancing +1.27%, but also on lackluster volume.

IWM ETF - iShares Russell 2000 ETF's Technical Performance Over The Past 1-2 Years
IWM ETF – iShares Russell 2000 ETF’s Technical Performance Over The Past 1-2 Years

Their RSI just crossed above the neutral level of 50 & sits at 52.82, while their MACD crossed over bullishly on Thursday after IWM was able to break above the resistance of the 10 & 50 day moving averages & close above them.

Volumes were -34.18% below average compared to the previous year (22,021,443 vs. 33,455,951), signaling that the gains of the week were not necessarily on true strength & should be viewed with a skeptical eye.

While it didn’t come out of an uptrend, but rather more of a consolidation range Monday’s candle can’t be viewed as a shooting star, but it certainly resembled one & looked as though IWM’s week was going to start off on a weak foot.

However, due to how it opened in between the support of the 10 day moving average & the resistance of the 50 DMA & tested much higher, it implied that there was a small bit of appetite to the upside for IWM.

Tuesday opened roughly in line with Monday’s close & the 50 day moving average, but prices were forced lower throughout the session & wound up settling in a cradle atop the 10 DMA’s support & below the 50 DMA’s resistance on this declining session.

Wednesday opened on a gap down indicating that there may be further weakness in the cards for IWM, but despite some testing lower the session closed higher than it opened, but still for a declining session.

Wednesday was unable to break above the resistance of the 10 DMA, setting up Thursday to open in line with it.

The session tested lower Thursday, before ultimately making a bullish run up to close above both the 10 & 50 day moving averages.

Friday ended the week on a bit of an ominous note though, as prices opened on a high gap up, signaled that there was some upside appetite still based on the upper shadow, but then fell apart as the day progressed & profits began to be taken in droves, as indicated by it being the strongest volume session of the week.

It is worth noting that Friday’s test to the downside was able to break the support of the 50 DMA, indicating that there is not a lot of strong sentiment there as a support level.

IWM’s Average True Range is still increasing due to the volatility of Friday’s session, and should continue to in the coming weeks.

As we note almost weekly, IWM moves far more in a manner of oscillating around a median price level when compared to how SPY & QQQ move, giving them more support levels nearby for the near-term.

If IWM’s 10 day moving average breaks down as a support level, it will be imperative to keep an eye on the gaps from early May & early June to see if prices begin to fill into those levels.

Their highs are still set up in a descending manner & given the signs that the other major index ETFs are flashing about a near-term consolidation/decline IWM can be expected to follow suit in the coming weeks.

IWM has support at the $201.73 (50 Day Moving Average, Volume Sentiment: Buyers, 1.08:1), $200.69 (10 Day Moving Average, Volume Sentiment: Buyers, 1.08:1), $198.60 (Volume Sentiment: Buyers, 2.47:1) & $198.35/share (Volume Sentiment: Buyers, 2.47:1) price levels, with resistance at the $203.68 (Volume Sentiment: Buyers, 1.08:1), $204.40 (Volume Sentiment: Buyers, 1.83:1), $207.27 (Volume Sentiment: Buyers, 1.83:1) & $209.19/share (Volume Sentiment: Buyers, 2.75:1) price level.

IWM ETF's Price Level:Volume Sentiment Over The Past 1-2 Years
IWM ETF’s Price Level:Volume Sentiment Over The Past 1-2 Years

DIA, the SPDR Dow Jones Industrial Average ETF matched SPY in terms of weekly performance, chalking up a -0.05% decline for the week.

DIA ETF - SPDR Dow Jones Industrial Average ETF's Technical Performance Over The Past Year
DIA ETF – SPDR Dow Jones Industrial Average ETF’s Technical Performance Over The Past Year

Their RSI is trending back towards neutral & sits at 54.74, while their MACD is still bullish but has flattened out in the wake of the consolidation of the past week.

Volumes were the most bountiful of the major four index ETFs, only falling -27.53% below the average volume for the previous year (2,527,411 vs. 3,487,726),

Monday kicked DIA’s week off on what appeared to be a strong note, where prices advanced & volumes were on the higher end of what we’ve been experiencing over the past eight weeks.

However the tall upper shadow on the candle indicates that there was not much strength for the bulls & that there was a great deal of selling pressure coming from the bears.

Tuesday this was confirmed, when on similar volumes DIA declined after opening near the middle of Monday’s price range & making a break towards the 10 day moving average’s support.

Wednesday saw DIA open to the downside, test the 10 DMA’s support & briefly break through it, only to rally & ultimately close higher.

It should be noted that this occurred on the weakest volume of the week, indicating that there was little strength behind the move & leaving market participants on edge & without a sense of confidence in the price movement.

Thursday was similar to Wednesday, DIA opened midway through the previous day’s range & tested the 10 DMA’s support again but was able to recover & close higher on slightly higher volume than Wednesday’s session.

The upper shadow on Thursday’s candle shows that there was a bit more appetite to go higher than Wednesday, but the low volumes continued to keep folks skeptical about future gains in the near-term.

Friday closed the week off on a long-legged doji, indicating severe uncertainty & a lack of confidence on the part of market participants, paired with the week’s highest volumes, indicating that there was a major profit taking & risk-off sentiment.

DIA was unable to break above the $395 mark on its upper shadow & did break down below the 10 DMA’s support, indicating that it is being viewed more weakly by investors.

The strength of the 10 & 50 day moving averages as support will play an important role for DIA in the next couple of weeks, especially as the increasing volatility of the past week has gotten their Average True Range perked up.

Should they break down, keep an eye out to see how the potential head & shoulders set up plays our for DIA using the $397.13 price level of March as the left shoulder & the $395.59/share mark of June as the left.

Should prices approach the $376.08 level there will be a need to analyze the possibility of a reversal at that level, given that that is an interior support level between the left shoulder & the head.

Should it be broken to the downside then the $374.94 & $368.09/share levels will be where attention must be focused in terms of support before a potential decline into the area of last year’s Q3 major price run up into 2024.

Adding complexity to the mix is that NVDA is not a DJIA component & so DIA has not benefitted by its aggressive price movements directly.

Should the semiconductor stocks all take a hit leading to SPY & QQQ to face aggressive declines, will DIA & IWM who have little to no exposure to these names be able to consolidate with minimal losses or will they be dragged down in a panic with the former two indexes?

That will be a question sure to be on everyone’s mind.

DIA has support at the $391.04 (Volume Sentiment: Buyers, 1.08:1), $390.31 (10 Day Moving Average, Volume Sentiment: Buyers, 1.08:1), $390.24 (Volume Sentiment: Buyers, 1.08:1) & $387.86/share (50 Day Moving Average, Volume Sentiment: Sellers, 1.25:1) price levels, with resistance at the $395.59 (Volume Sentiment: Sellers, 3.5:1), $397.13 (Volume Sentiment: Buyers, 0.6:0*) & $399.83/share (All-Time High, Volume Sentiment: Buyers, 0.6:0*) price level.

DIA ETF's Price Level:Volume Sentiment Over The Past 4-5 Years
DIA ETF’s Price Level:Volume Sentiment Over The Past 4-5 Years

The Week Ahead

Monday kicks off a new month with S&P Final U.S. Manufacturing PMI at 9:45 am & Construction Spending & ISM Manufacturing data at 10 am.

There are no noteworthy earnings reports set to be released on Monday.

Federal Reserve Chair Jerome Powell speaks in Portugal Tuesday morning at 9:30 am, followed by Job Openings at 10 am & Auto Sales (TBD).

Tuesday morning brings earnings reports from MSC Industrial & Radius Recycling, with Simulation Plus scheduled to report after the session’s close.

Wednesday begins with NY Fed President Williams speaking in Portugal at 6:30 am followed by ADP Employment, Initial Jobless Claims & U.S. Trade Deficit data at 8:30 am, S&P Final U.S. Services PMI data at 9:45 am, Factory Orders & ISM Services data at 10 am & the Minutes of the June FOMC meeting at 2pm.

Constellation Brands will report earnings before Wednesday’s open before a half day due to the July 4th holiday.

Thursday is July 4th & there are no scheduled data or earnings announcements as the market is closed.

U.S. Employment Report, U.S. Unemployment Rate, U.S. Hourly Wages & Hourly Wages Year-over-Year are all released on Friday at 8:30 am & there are no notable earnings reports scheduled for the day.

See you back here next week & have a great Fourth of July!

*** I DO NOT OWN SHARES OR OPTIONS CONTRACT POSITIONS IN SPY, QQQ, IWM or DIA AT THE TIME OF PUBLISHING THIS ARTICLE ***