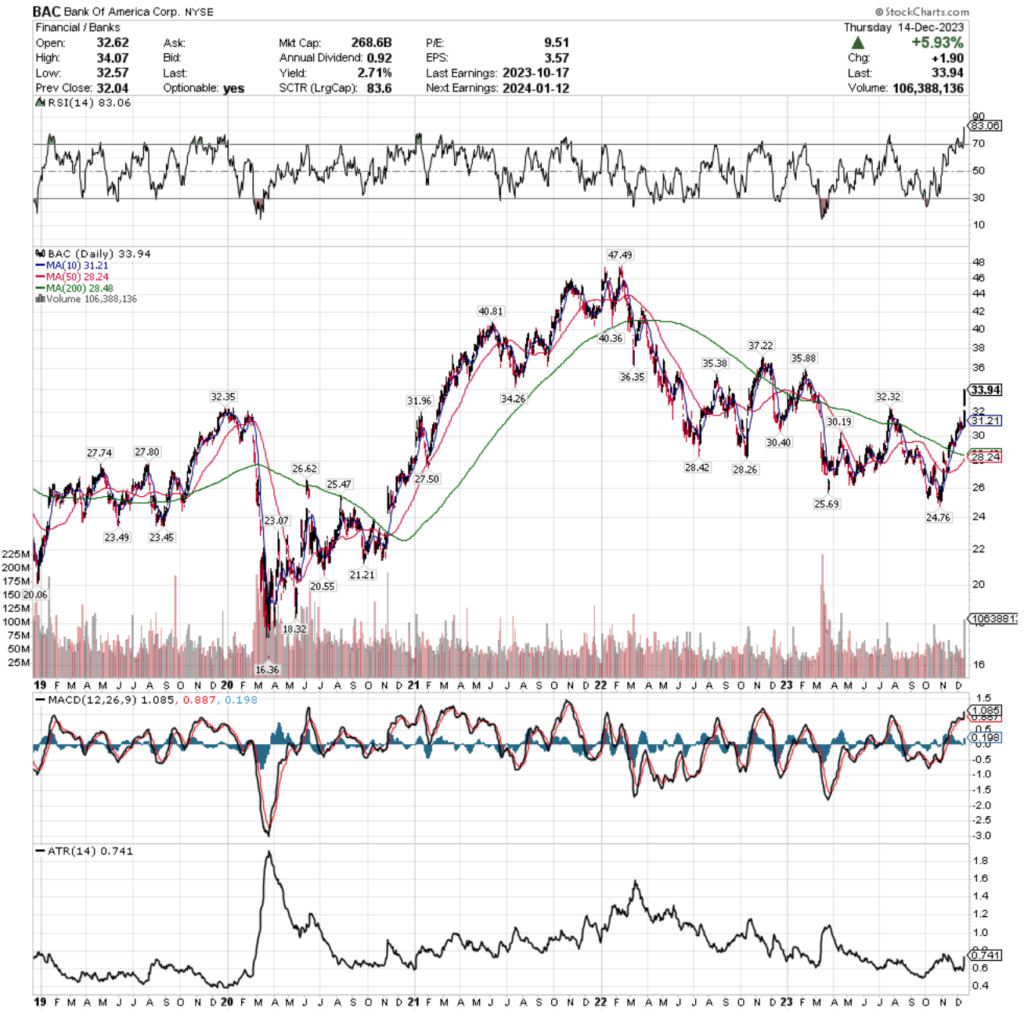
Bank of America Corp. stock trades under the ticker BAC & has gained +10.16% over the past year (ex-dividends), falling -8.27% since their 52-week high in February of 2023, but has reclaimed +35.98% since their 52-week low in October of 2023.
Below is a brief technical analysis of BAC’s recent price performance, as well as a price level:volume sentiment analysis that covers price data for the past 5-6 years.
Before going forward please note that I have both a long position in BAC shares, as well as a short position against them as well using puts.
Technical Analysis Of Bank Of America Corp. BAC Stock
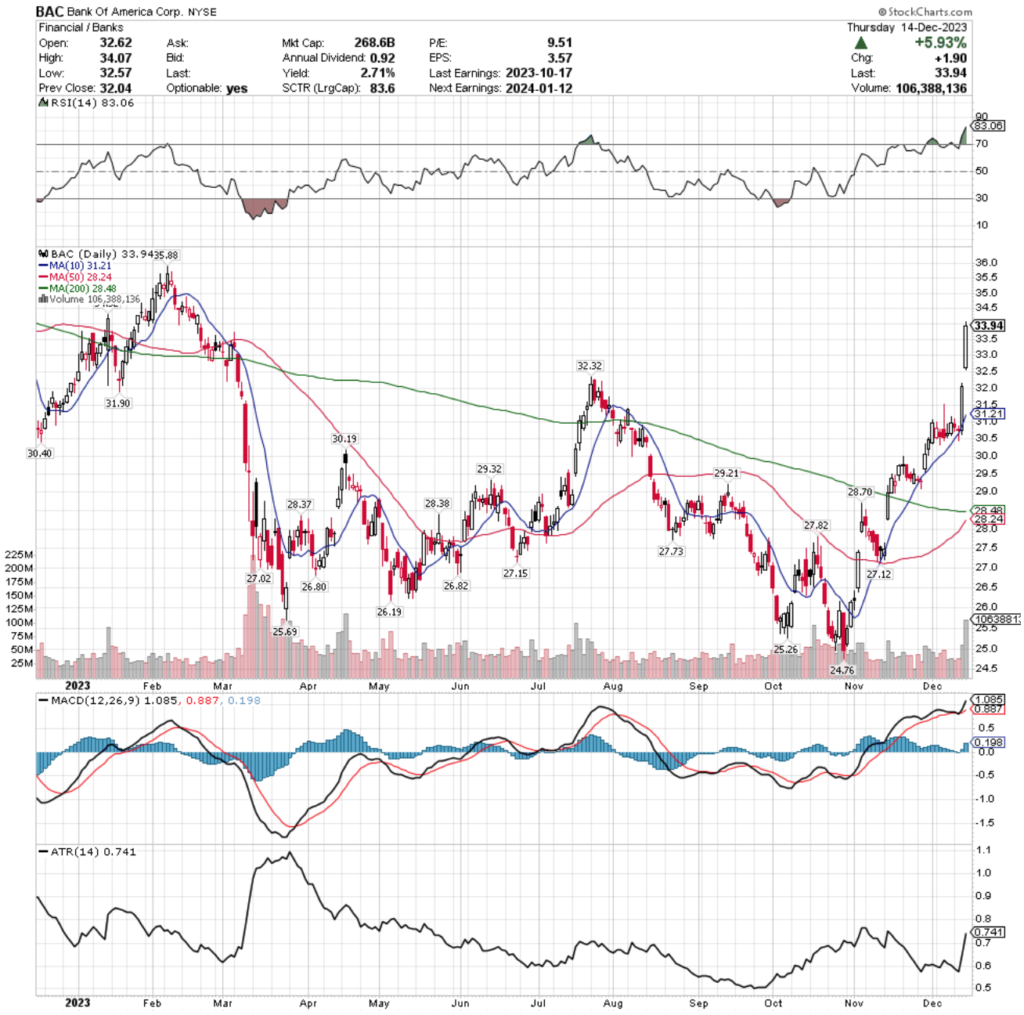
Their RSI is overbought at 83.06, while their MACD is bullish currently after the price action of the past two sessions extended it from approaching a bearish crossover.
Volumes over the past week have been +12.03% above average compared to the year prior (53,813,820 vs. 48,035,243.43), mostly driven by Wednesday’s session (~2x Friday, Monday & Tuesday’s average) & Thursday’s, which in one day was almost the sum of the first three days in the calculation.
Given how overextended the broader markets look this volume spike looks more like a last minute squeeze, rather than a new trend being established & a means of pumping one last profit before a consolidation period.
The window from Thursday’s gap up session will be an area to watch next week as a result, as there is only one support level currently within the window range, pending the 10 day moving average doesn’t move up into it in the meantime.
BAC stock’s 50 day moving average is approaching their 200 DMA quickly & looks primed to form a golden cross in the coming days, which may help catch prices for a day or two should they decline sharply prior.
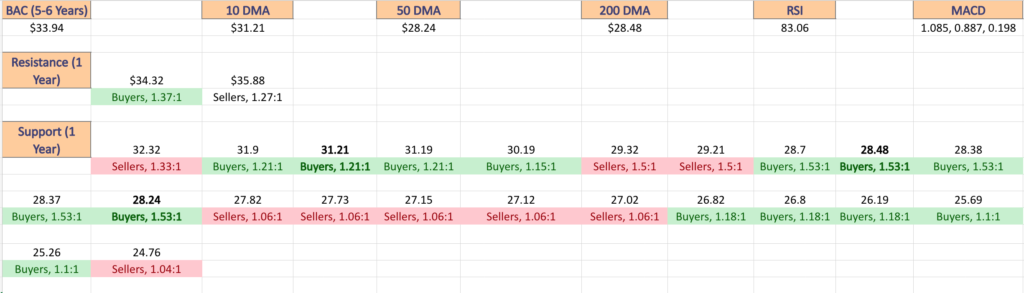
Given their current technical outlook & the technical outlook of the major indexes, it is a good time to look at their price level:volume sentiment to assess the strength & weakness of their nearby support & resistance levels.
The data below is from the past 5-6 years, with the ratio of Buyers:Sellers (or Sellers:Buyers) for each price level that BAC stock has traded at over that time period.
While the support & resistance levels noted in the top image of the next section are only for the past year’s chart, the chart below contains data that covers the range of price level:volume sentiment data for your reference.
Please note that this is meant to serve as a barometer or compass rose & be used as supporting information to help with investing research, but should not be taken as investment advice.
Price Level:Volume Sentiment For Bank Of America Corp. BAC Stock
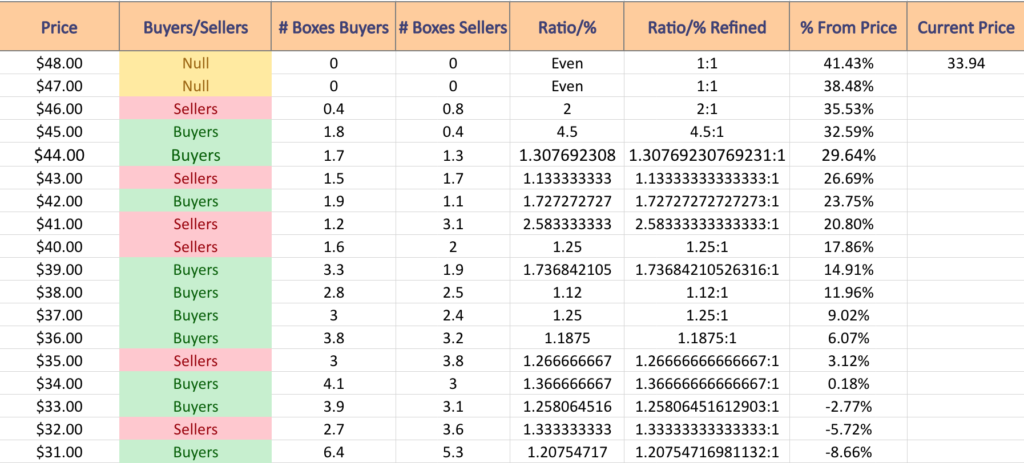
$48 – NULL – 0:0*; +41.43% From Current Price Level
$47 – NULL – 0:0*; +38.48% From Current Price Level
$46 – Sellers – 2:1; +35.53% From Current Price Level
$45 – Buyers – 4.5:1; +32.59% From Current Price Level
$44 – Buyers – 1.31:1; +29.64% From Current Price Level
$43 – Sellers – 1.13:1; +26.69% From Current Price Level
$42 – Buyers – 1.73:1; +23.75% From Current Price Level
$41 – Sellers – 2.58:1; +20.8% From Current Price Level
$40 – Sellers – 1.25:1; +17.86% From Current Price Level
$39 – Buyers – 1.74:1; +14.91% From Current Price Level
$38 – Buyers – 1.12:1; +11.96% From Current Price Level
$37 – Buyers – 1.25:1; +9.02% From Current Price Level
$36 – Buyers – 1.19:1; +6.07% From Current Price Level
$35 – Sellers – 1.27:1; +3.12% From Current Price Level
$34 – Buyers – 1.37:1; +0.18% From Current Price Level
$33 – Buyers – 1.26:1; -2.77% From Current Price Level – Current Price Box*
$32 – Sellers – 1.33:1; -5.72% From Current Price Level
$31 – Buyers – 1.21:1; -8.66% From Current Price Level – 10 Day Moving Average*
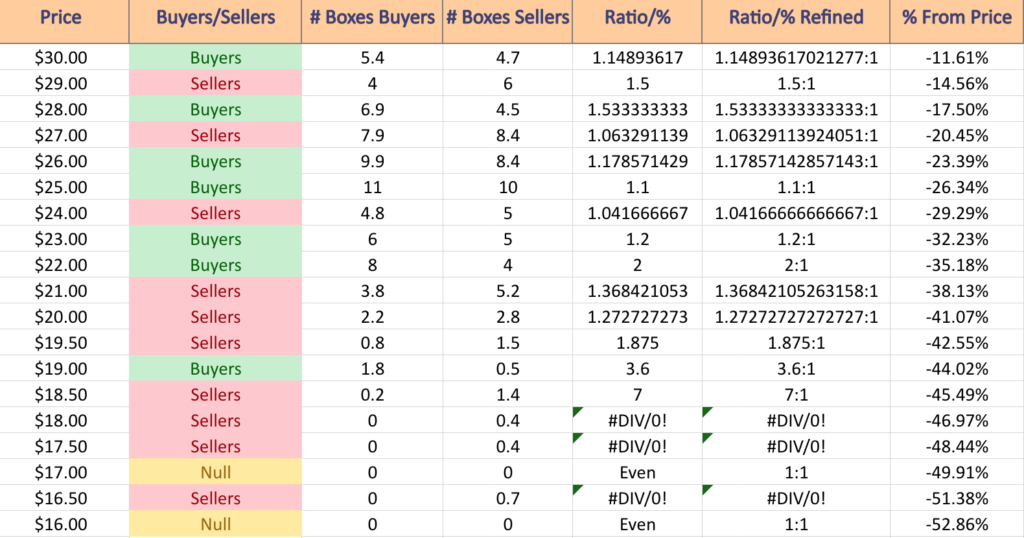
$30 – Buyers – 1.15:1; -11.61% From Current Price Level
$29 – Sellers – 1.5:1; -14.56% From Current Price Level
$28 – Buyers – 1.53:1; -17.5% From Current Price Level – 50 & 200 Day Moving Averages**
$27 – Sellers – 1.06:1; -20.45% From Current Price Level
$26 – Buyers – 1.18:1; -23.39% From Current Price Level
$25 – Buyers – 1.1:1; -26.34% From Current Price Level
$24 – Sellers – 1.04:1; -29.29% From Current Price Level
$23 – Buyers – 1.2:1; -32.23% From Current Price Level
$22 – Buyers – 2:1; -35.18% From Current Price Level
$21 – Sellers – 1.37:1; -38.13% From Current Price Level
$20 – Sellers – 1.27:1; -41.07% From Current Price Level
$19.50 – Sellers – 1.88:1; -42.55% From Current Price Level
$19 – Buyers – 3.6:1; -44.02% From Current Price Level
$18.50 – Sellers – 7:1; -45.49% From Current Price Level
$18 – Sellers – 0.4:0*; -46.97% From Current Price Level
$17.50 – Sellers – 0.4:0*; -48.44% From Current Price Level
$17 – NULL – 0:0*; -49.91% From Current Price Level
$16.50 – Sellers – 0.7:0*; -51.38% From Current Price Level
$16 – NULL – 0:0*; -52.86% From Current Price Level
*** I OWN A LONG POSITION IN BAC STOCK SHARES & ALSO CURRENTLY HAVE A SHORT POSITION AGAINST THEM AT THE TIME OF PUBLISHING THIS ARTICLE ***