SPY, the SPDR S&P 500 ETF remained relatively flat last week, only adding +0.24%, as market participants remained cautious while awaiting this week’s CPI, PPI & Fed Interest Rate decision data this upcoming week.
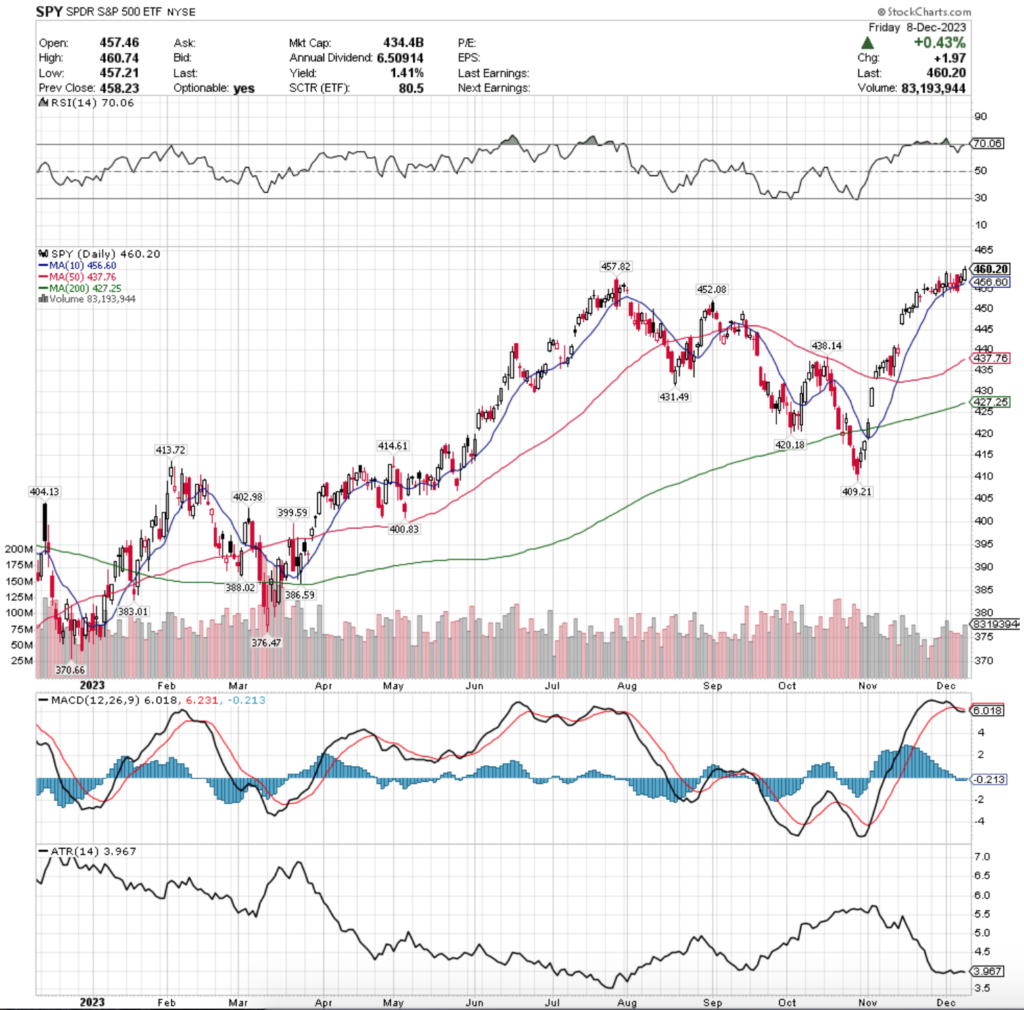
Their RSI is currently overbought at 70.08, with a MACD that is bearish after crossing over last week, but it is relatively flat following the tightly rangebound price action of the past few weeks.
Volumes were -8.43% below average compared to the year prior (75,087,217 vs. 81,996,981), which does not cast a bullish picture, particularly as while Friday’s bullish volume led the week, Monday, Tuesday & Wednesday’s bearish volume sessions were higher than Thursday’s advancing session & not far below Friday’s volume.
Monday kicked the week off on a bearish note, although the upper shadow of the day’s candle tested much higher than the lower shadow tested lower & the session opened on the 10 day moving average, but was able to close higher than the open, despite being lower than the previous Friday’s session.
However, the spinning top candle does imply indecision.
Tuesday followed in Monday’s footsteps in terms of a spinning top with the same opening & closing attributes, however it did not test as high & was on lower volume, signaling more uncertainty among market participants.
Wednesday opened near the highs of Monday’s session, however it took a bearish turn & ultimately closed below the support of the 10 day moving average.
Thursday saw some bullish price action, but the uncertain theme continued as the session resulted in a spinning top & were on the lowest volume session of the week.
However, it should be noted that the 10 DMA was able to support the candle, with the lower shadow bouncing off of it & heading higher.
Friday opened above the 10 DMA & closed higher with a small upper shadow & set a new 52-week high, which will be an area to watch going into next week.
The 10 DMA will also be important to watch, as it has become more rounded at the top which will likely make it weaker as a support level & it will become the highest support level in the near future.
Their Average True Range has remained flat since late November in the lower end of their chart, as there has been limited volatility with the majority of days resulting in limited movement upwards or downwards.
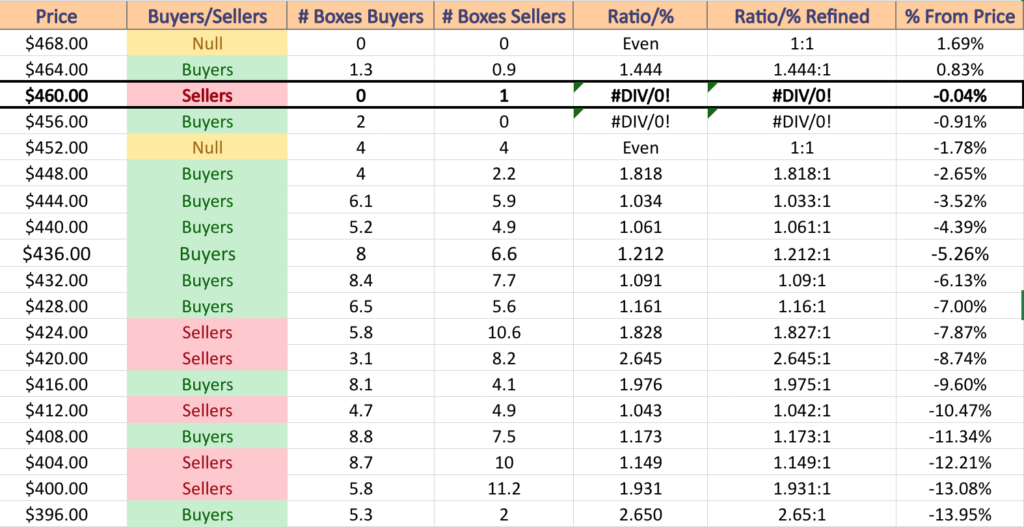
It should also be noted that currently the price level for SPY has historically been dominated by sellers, which although is to be expected as it is near a price extreme, will make watching their price levels in relation to the chart below important in the coming weeks.
If there are further advances it will shed insight into how much further it will run & if there are declines it will highlight the strength of the support levels below the price.
SPY has support at the $457.82 (Volume Sentiment: Buyers, 2:0*), $456.60 (Volume Sentiment: Buyers, 2:0*), $452.08 (Volume Sentiment: Even, 1:1) & $438.14/share (Volume Sentiment: Buyers, 1.21:1) price levels, with no resistance levels from the past year as they are currently at a new 52-week high.
QQQ, the Invesco QQQ Trust ETF improved +0.57% over the past week, faring second best of the major indexes after a having the worst week of the bunch the week prior.
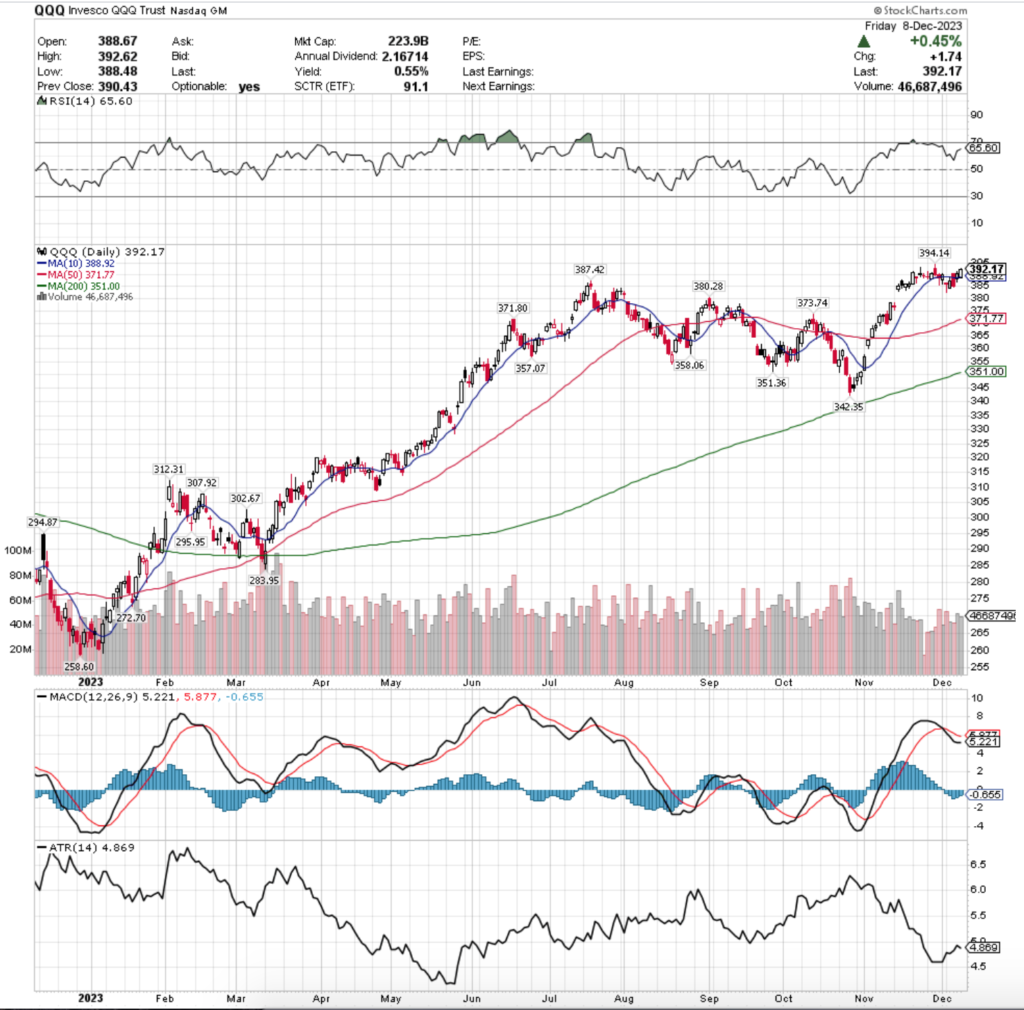
Their RSI is trending towards overbought conditions & currently sits at 65.6, while the MACD is bearish but has recently flattened after last week’s results.
Volumes were -14.04% below average last week compared to the year prior (45,461,933 vs. 52,885,137), signaling severe hesitancy by traders & investors.
Monday’s volumes on the declining session were the highest of the week, with Tuesday’s advancing session having the second lowest volumes (only to Wednesday’s declining session).
Monday’s candle was a dragonfly doji, which set the stage for a slight upwards movement for the rest of the week, but also signaled that there would be uncertainty among market participants.
Thursday’s advancing session had the highest volume of the week, however when you break down the day’s candlestick the upper shadow is the smallest, the day’s open occurred at the 10 day moving average & while it closed higher, it did test the support of the 10 DMA by dipping below it & going over halfway down the wide-range bar of Wednesday’s bearish session.
That 10 day moving average will be something to keep an eye on in the near future, as over the past week it has spent a fair amount of time serving as the support & resistance in a relatively tight price range, which will eventually exhaust when there hasn’t been enough bullish action with it acting as support.
Their Average True Range does not indicate there has bee much volatility recently, but given how their past 14 sessions have traded over a tight price range with limited movements to the upside & downside this makes sense & is beginning to look concerning & foreboding of something on the horizon.
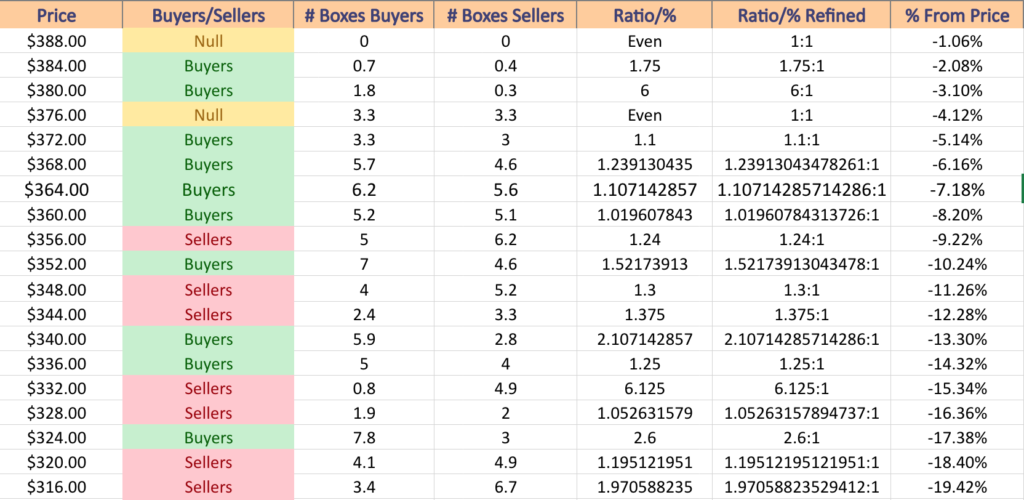
QQQ has support at the $388.92 (10 Day Moving Average; Volume Sentiment: NULL, 0:0*), $387.42 (Volume Sentiment: Buyers, 1.75:1), $380.28 (Volume Sentiment: Buyers, 6:1) & $373.74/share (Volume Sentiment: Buyers, 1.1:1) price levels, with resistance at the $394.14/share (Volume Sentiment: NULL, 0:0*) price level, which is their 52-week high which was set last week.
IWM, the iShares Russell 2000 ETF had the strongest week of the major indexes, advancing +1.02%.
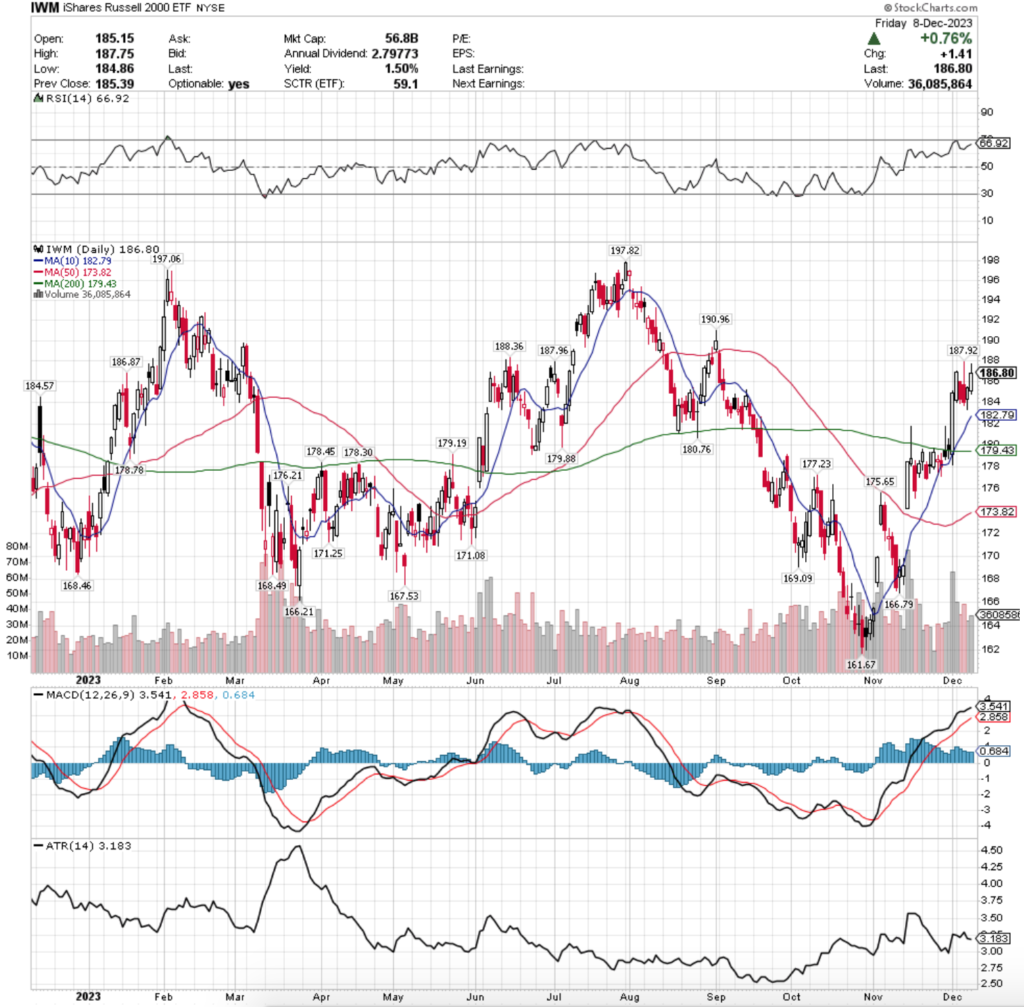
Their RSI is trending towards overbought levels at 66.92, with a bullish MACD that is beginning to show signs of fading enthusiasm after a strong past few weeks.
Volumes were +41.51% above average last week compared to the year prior (43,038,183 vs. 30,412,676), which paints an interesting picture given that Monday’s session was the strongest volume of the week (but hardly compared with Friday before it) on a wide-range session by prices with limited shadows on the upper/lower.
Tuesday opened mid-way up Monday’s price range, tested lower than Monday’s total range, but closed within the real-body of Monday’s candle, still for a loss (bearish sentiment) on the second lowest volume of the week.
Wednesday’s volumes are where things get interesting, as the day opened higher than Tuesday’s close, tested the $187.96 resistance level (or $187-188 resistance zone) but were only able to reach $187.92, before ultimately closing lower than the day prior & leaving an upper shadow that makes up over half of the day’s candle.
This did not show much confidence in the retest of the resistance level noted above, which despite the next two session’s moving higher, were untested again, with Friday’s candle having a large upper shadow compared to the day’s open/close range.
Their Average True Range will be an important thing to watch in the coming weeks, as the sessions with the lowest price volatility of the 14 day calculation period will all be removed & replaced by Wednesday, implying an uptick in volatility may be on the horizon.
Their 10 day moving average will need to have a close eye kept on it this upcoming week, as if prices fall beneath it it will join many other resistance points right above their current price levels.
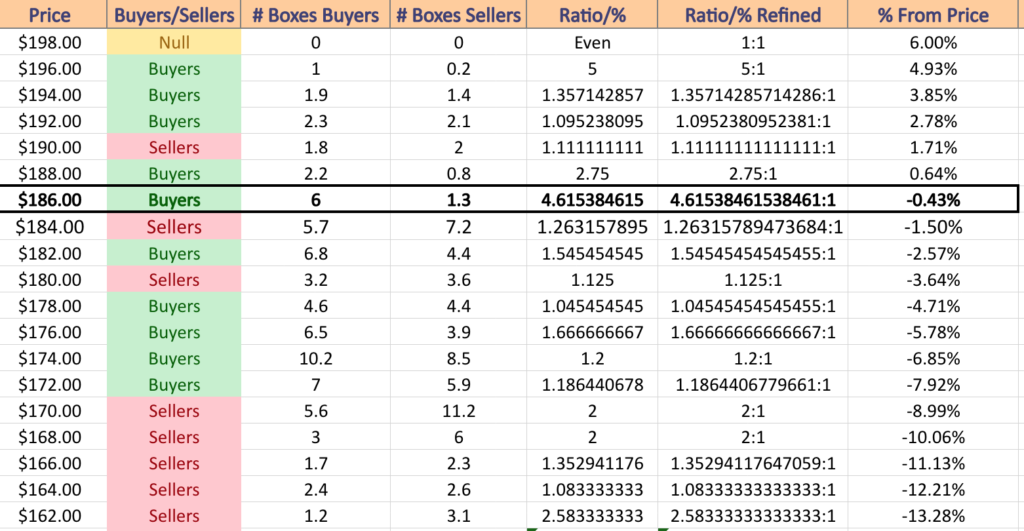
IWM has support at the $184.57 (Volume Sentiment: Sellers, 1.26:1), $182.79 (10 Day Moving Average; Volume Sentiment: Buyers, 1.55:1), $180.76 (Volume Sentiment: Sellers, 1.13:1) & $179.88 /share (Volume Sentiment: Buyers, 1.05:1) price levels, with resistance at the $186.87 (Volume Sentiment: Buyers, 4.62:1), $187.92 (Volume Sentiment: Buyers, 4.62:1), $187.92 (Volume Sentiment: Buyers, 4.62) & $188.36/share (Volume Sentiment: Buyers, 2.75:1) price levels.
DIA, the SPDR Dow Jones Industrial Average ETF remained near flat last week, inching forward +0.02% as investors were not readily eager to jump into the larger cap names.
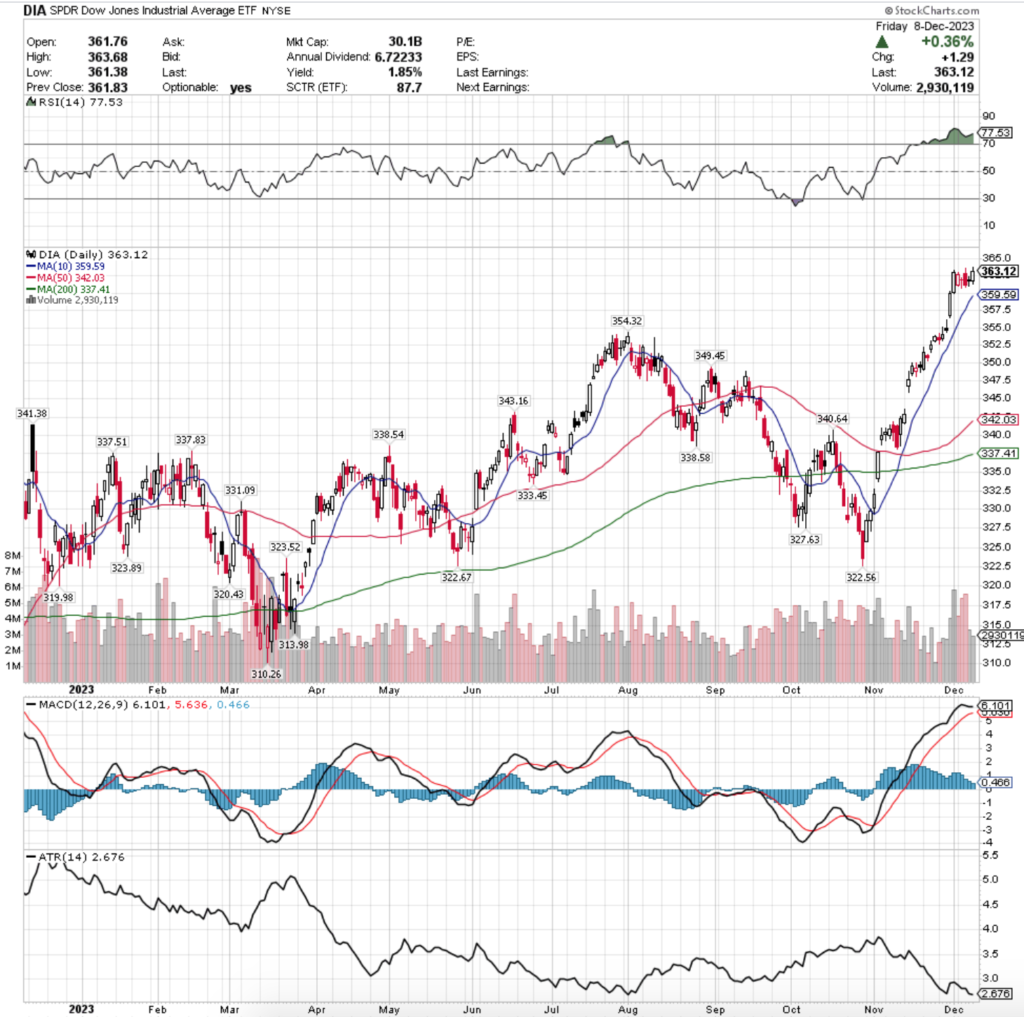
Their RSI is overbought at 77.53 & has been above the overbought 70-level since mid-November, with a MACD that has curled over set to make a bearish MACD crossover in the coming week.
Volumes were +29.24% above average last week compared to the year prior (4,539,983 vs. 3,512,913), which is noteworthy as it shows a lot of profit taking following a few weeks of advances, while the week’s price range itself did not make much of an attempt to advance higher.
Monday kicked the week off on a bearish note, although the session closed higher than it opened, but it still declined from the Friday prior’s close.
Tuesday’s session was interesting, as they had the second highest volume day of the week on a declining day, but resulted in a dragonfly doji, signaling both uncertainty, but that there may be a slight advance on the horizon.
Wednesday had the highest volume of the week on a wide-range candle whose upper shadow tested higher, but closed much lower than the open & had a slight lower shadow indicating that there was still some sentiment to test lower.
Thursday & Friday had the lowest volumes of the week, despite being the only advancing sessions, with Thursday resulting in a doji whose open & close were above the top half of the candle & Friday’s upper shadow hitting a new 52-week high but on the weakest volume of the week, which does not signal confidence in a move higher.
Their Average True Range is signaling a severe lack of volatility, which when you look at other times in the past year where it has dipped near this low there has been a consolidation period on the horizon.
Their 10 day moving average will be a point of interest to watch in the coming week, as it will need to provide the support to keep pushing DIA higher, as their other indicators & oscillators signal that they’re due to take a breather & cool off.
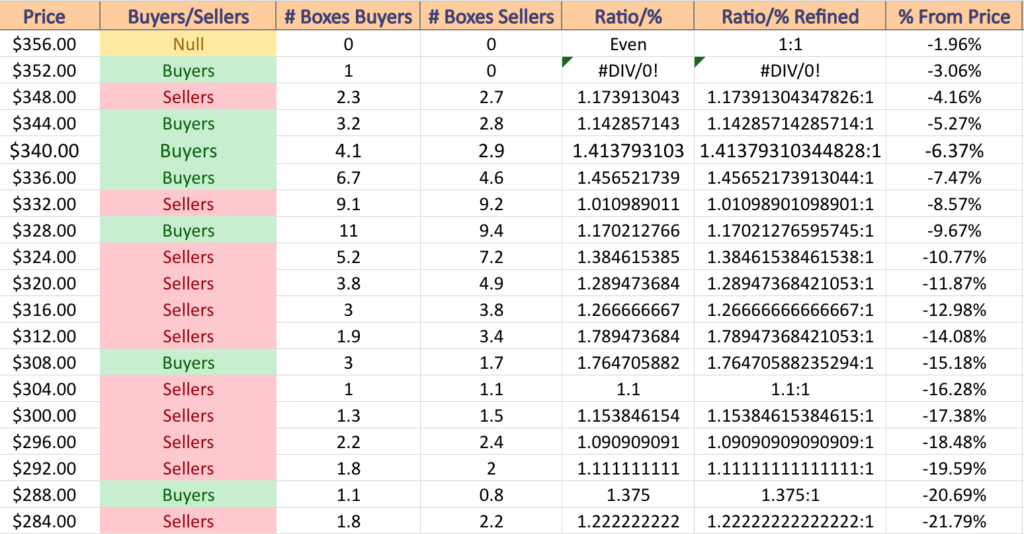
DIA has support at the $359.59 (10 Day Moving Average; Volume Sentiment: NULL, 0:0*), $354.32 (Volume Sentiment: Buyers, 1:0*), $349.45 (Volume Sentiment: Sellers, 1.17:1) & $343.16/share (Volume Sentiment: Buyers, 1.41:1) price levels, with no resistance in the past year as it closed the week out on a new 52-week high.
The Week Ahead
Monday starts the week off on a quiet note, with no major market data announcements.
Casey’s General, FuelCell Energy & Oracle are all scheduled to report earnings on Monday.
Consumer Price Index, Core CPI, CPI Y-o-Y & Core CPI Y-o-Y are all due at 8:30 am on Tuesday, followed by the monthly U.S. Federal Budget at 2pm.
Tuesday is relatively quiet on the earnings report front.
Wednesday brings us Producer Price Index, Core PPI, PPI Y-o-Y & Core PPI Y-o-Y data at 8:30 am, with the FOMC Interest-Rate Decision announced at 2 pm & Fed Chairman Powell’s Press Conference at 2:30 pm.
Adobe, ABM Industries, Cognyte Software, Nordson, Photronics & REV Group report earnings on Wednesday.
Thursday morning is a busy one, with Initial Jobless Claims, Import Price Index, Import Price Index minus Fuel, U.S. Retail Sales & Retail Sales minus Autos data coming in at 8:30 am, followed by Business Inventories data at 10 am.
Costco Wholesale, Jabil & Lennar are all releasing earnings reports on Thursday.
Empire State Manufacturing Survey data is released Friday morning at 8:30 am, followed by Industrial Production & Capacity Utilization data at 9:15 am.
Darden Restaurants is scheduled to report earnings on Friday.
See you back here next week!