Market indexes have found themselves hovering near new 52-week highs over the past week as we head into the year’s end; Santa delivered this Christmas season!
As it is the end of the year & we are at new price extremes on the upside, it is worth taking time to review how these buyers & sellers have behaved at different price levels for each of the indexes.
The article below outlines a brief technical analysis of recent performance for SPY, QQQ, IWM & DIA, as well as a price level:volume sentiment analysis for each index covering the past 1-2 years worth of data (3-4 years for DIA).
As always, this is not meant to serve as investing advice, but rather as a barometer to use as an additional tool when doing your own due diligence.
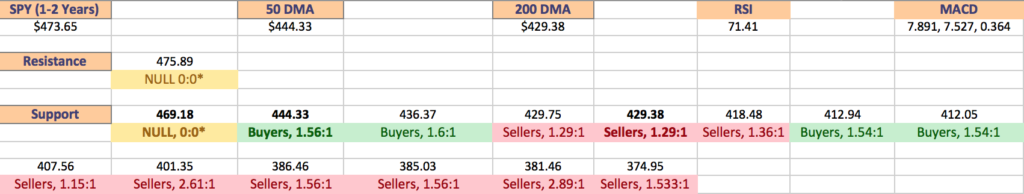
When reading the price level:volume sentiment portions below note that the top images show the price level:volume sentiment at the past year’s support & resistance levels for each index, the bottom image shows the individual price levels & their relationship to the current price level, and the lists below them include the same data as the second image where all of the support & resistance levels are marked in bold.
Technical Analysis Of SPY, The SPDR S&P 500 ETF
SPY, the SPDR S&P 500 ETF gained +0.92% last week, staying relatively range-bound just above the support of the ascending 10 day moving average.
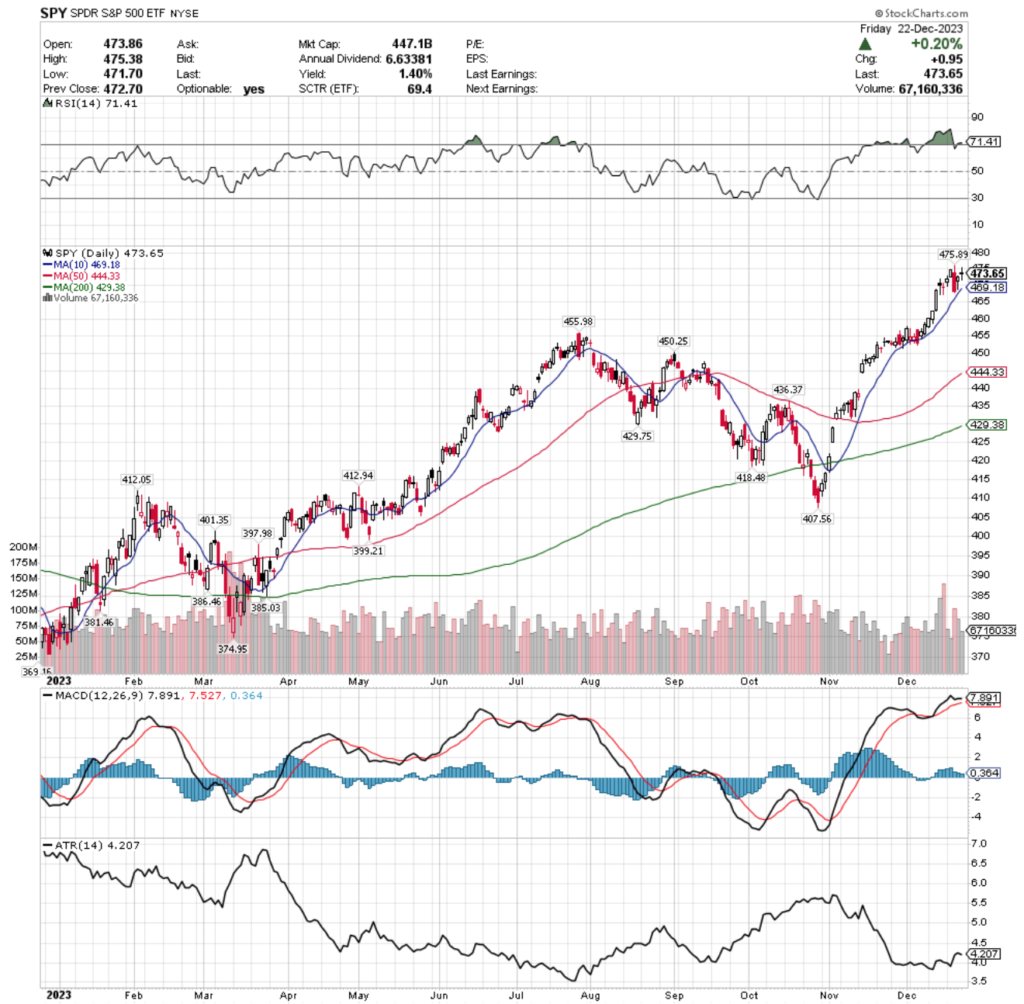
Their RSI is currently overbought at 71.41, while their MACD is bullish, but moving relatively flat, which tends to signal a bearish crossover & a consolidation period are on the horizon.
Volumes were -6.31% below average last week compared to the year prior (76,570,440 vs. 81,726,945), indicating a lack of confidence near new 52-week highs, as well as traders taking vacations ahead of the Christmas holiday.
Monday kicked the week off on a note of uncertainty with a spinning top candlestick that closed just above Friday’s upper shadow, with upper & lower shadows being roughly the same size.
Tuesday opened higher & climbed steadily towards the $475 price level, but fell short at $474.92 for the day’s high, while closing just below it for the day at $474.84/share.
A new 52-week high was established Wednesday at $475.89/share after the day’s session opened at the midway point of Tuesday’s candle, but profits were eagerly taken & the day closed lower, but remained above the 10 DMA (even its lower shadow) as a sign of support.
Thursday hinted at more skittishness among market participants with a hanging man candle that tested lower, but did not dip lower than the day prior’s close as the 10 DMA maintained support & forced the session to close higher (although only 75-80% of the day prior’s candle), although a bearish harami pattern was formed after the close with Wednesday’s candle.
The week ended as uncertain as it began from a technical perspective, with Friday closing in a doji whose upper shadow did not get as high as Wednesday’s candle’s & whose lower shadow covered most of the prior day’s candle’s real body.
Their Average True Range does not reflect a strong trend & has been showing weakening as the week progressed, which when paired with the uncertainty of the candles does seem to signal that we are nearing a cooldown period.
The strongest volume session of the week was Wednesday, which was a declining session & the bullish sessions except for Thursday’s all had volumes that were <75% of Wednesday’s declining volumes, signaling a lack of enthusiasm for more risk in the near-term.
There is an emerging bearish head & shoulders pattern which will be something to keep an eye on as we enter the new year, particularly if there is a consolidation around the $450-460/share price range, where the 50 DMA will be a support level to keep an eye on, as well as the $455.98 & $450.25/share price levels.
Price Level:Volume Sentiment Analysis For SPY, The SPDR S&P 500 ETF
SPY’s reaching new 52-week highs has created an interesting area in terms of volume analysis, as there is limited data in terms of the strength of buyers:sellers currently until a -3.73% decline has taken place, bringing prices down to $456/share.
This will be particularly interesting as their 2nd highest support level is currently at $455.98/share & this would likely trigger the support that would lay the groundwork for the bearish head & shoulders pattern mentioned above.
Again, due to the limited data as these price levels are higher than usual the support zone that is depicted below between the -3.73%-8.79% block will get fuzzy, as the strongest volume sentiments lie above the -5.42% range from the current price in the image below.
Should support break down in the other buyer dominated ranges their price will enter a seller dominated zone that dips down to -12.17% from their current price to $416/share.
There are support points in the $412-413 price range which has been 1.54 Buyers:1 Seller over the past 1-2 years, but this could pave the way to test the $407.56/share support level, which if broken would likely bring a test of the $400/share price level, given that the sellers get more aggressive in the $400-403.99/share range, which comes after a seller dominated zone already.
The chart below outlines the price level:volume sentiment for the major support & resistance areas of the past year, followed by the list of each price level’s volume sentiment.
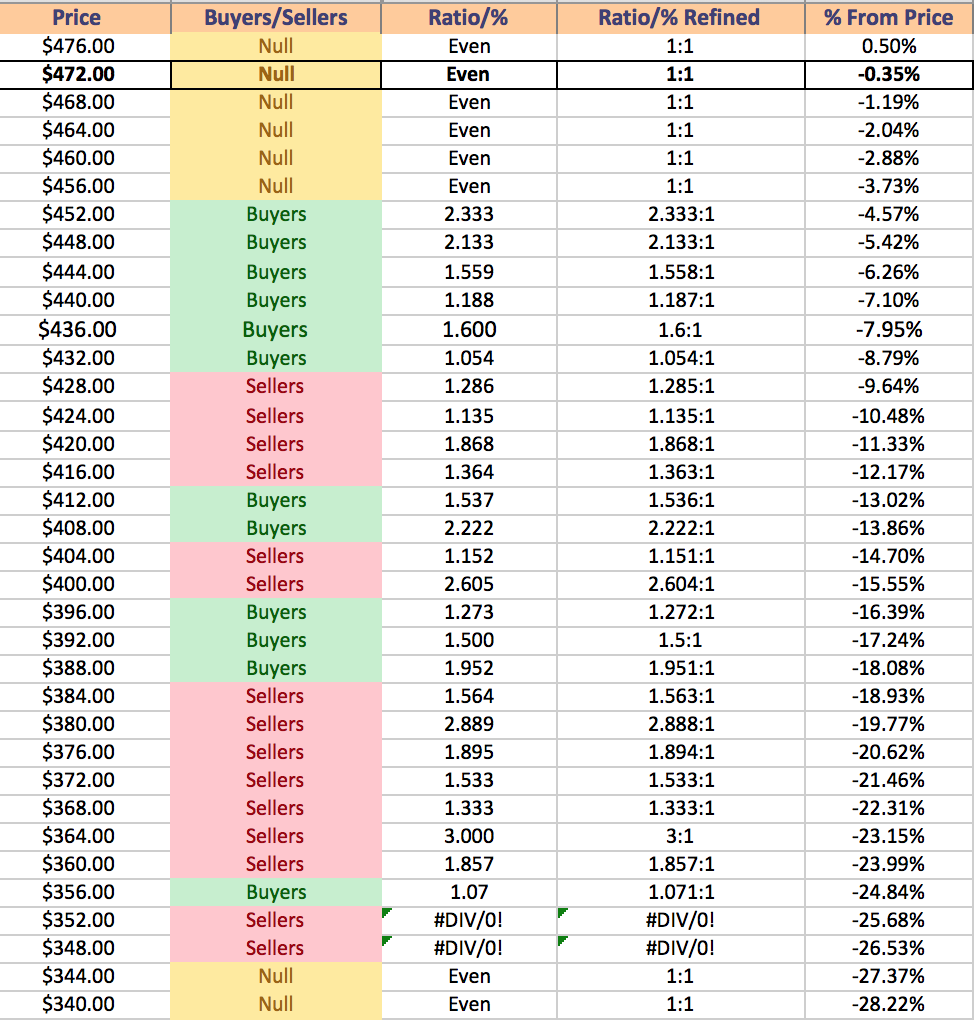
$476 – NULL – 0:0*; +0.5% From Current Price Level
$472 – NULL – 0:0*; -0.35% From Current Price Level – Current Price Box*
$468 – NULL – 0:0*; -1.19% From Current Price Level – 10 Day Moving Average*
$464 – NULL – 0:0*; -2.04% From Current Price Level
$460 – NULL – 0:0*; -2.88% From Current Price Level
$456 – NULL – 0:0*; -3.73% From Current Price Level
$452 – Buyers – 2.33:1; -4.57% From Current Price Level
$448 – Buyers – 2.133:1; -5.42% From Current Price Level
$444 – Buyers – 1.56:1; -6.26% From Current Price Level – 50 Day Moving Average*
$440 – Buyers – 1.19:1; -7.1% From Current Price Level
$436 – Buyers – 1.6:1; -7.95% From Current Price Level
$432 – Buyers – 1.05:1; -8.79% From Current Price Level
$428 – Sellers – 1.29:1; -9.64% From Current Price Level
$424 – Sellers – 1.14:1; -10.48% From Current Price Level
$420 – Sellers – 1.87:1; -11.33% From Current Price Level
$416 – Sellers – 1.36:1; -12.17% From Current Price Level
$412 – Buyers – 1.54:1; -13.02% From Current Price Level
$408 – Buyers – 2.22:1; -13.86% From Current Price Level
$404 – Sellers – 1.15:1; -14.7% From Current Price Level
$400 – Sellers – 2.06:1; -15.55% From Current Price Level
$396 – Buyers – 1.27:1; -16.39% From Current Price Level
$392 – Buyers – 1.5:1; -17.24% From Current Price Level
$388 – Buyers – 1.95:1; -18.08% From Current Price Level
$384 – Sellers – 1.56:1; -18.93% From Current Price Level
$380 – Sellers – 2.89:1; -19.77% From Current Price Level
$376 – Seller s- 1.89:1; -20.62% From Current Price Level
$372 – Sellers – 1.53:1; -21.46% From Current Price Level
$368 – Sellers – 1.33:1; -22.31% From Current Price Level
$364 – Sellers – 3:1; -23.15% From Current Price Level
$360 – Sellers – 1.86:1; -23.99% From Current Price Level
$356 – Buyers – 1.07:1; -24.84% From Current Price Level
$352 – Sellers – 2:0*; -25.68% From Current Price Level
$348 – Sellers – 3:0*; -26.53% From Current Price Level
$344 – NULL – 0:0*; -27.37% From Current Price Level
$340 – NULL – 0:0*; -28.22% From Current Price Level
Technical Analysis Of QQQ, The Invesco QQQ Trust ETF (NASDAQ)
QQQ, the Invesco QQQ Trust ETF climbed +0.95% last week, as investors found it slightly more favorable than SPY.
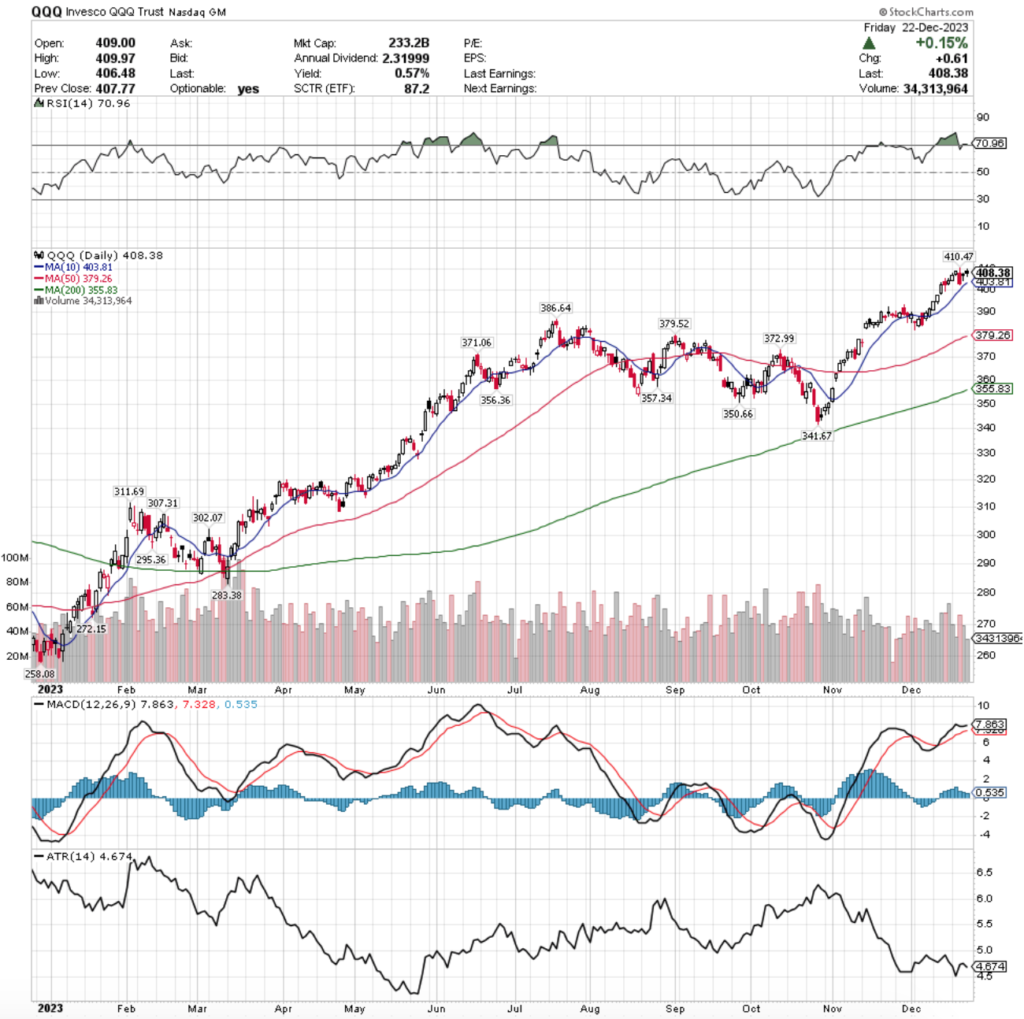
Their RSI is currently overbought at 70.96, while their MACD is bullish, but flattening out, which tends to signal that there will be a consolidation period in the near-term.
Volumes were -17.72% below average last week compared to the year prior (43,245,120 vs. 52,559,460), which signals a severe lack of confidence at these 52-week high price levels, particularly as the highest volume session came on Wednesday’s declining session.
Monday kicked off slightly higher than Friday’s close, with a slight upper shadow indicating that they may nudge higher on Tuesday, which occurred but on only ~80% of Monday’s volumes, signaling that not many more people were eager to jump into the pool.
This was confirmed on Wednesday where the week’s highest volume session occurred, opening near the open of Tuesday’s session, pushing higher to establish the new 52-week high level at $410.47, which then resulted in the rug being pulled out from under the session & declines that closed near the close of the prior Thursday’s session (below all other sessions in between & their shadows).
Conflicting energies were in the air on Thursday, as a dragonfly doji candle showed uncertainty, but a potential for a kick upward, while also forming a bearish harami pattern with the day prior.
While Thursday’s session had volume that was ~85% of Wednesday’s session, that still signals a yellow light.
Friday continued on the skating on thin ice theme, with a spinning top candle whose upper shadow did not break near the 52-week high set Wednesday & whose lower shadow dipped below the open of the day prior’s candle, sending the 10 day moving average into a flattening process, preparing it to curl over bearishly in the near-term & signaling the strength of support is weakening.
Due to Friday’s volumes being lowest of the week it also indicates that there was limited interest in carrying new risk into the holiday weekend.
Their Average True Range also has been signaling a weakening trend over the past week, which does not bode well for the near-term.
Market participants should have their eyes peeled for a bearish head & shoulders formation, particularly if the $390/share price level becomes tested in a consolidation, as the 50 DMA will become the nearest support level by that point in the event of decline.
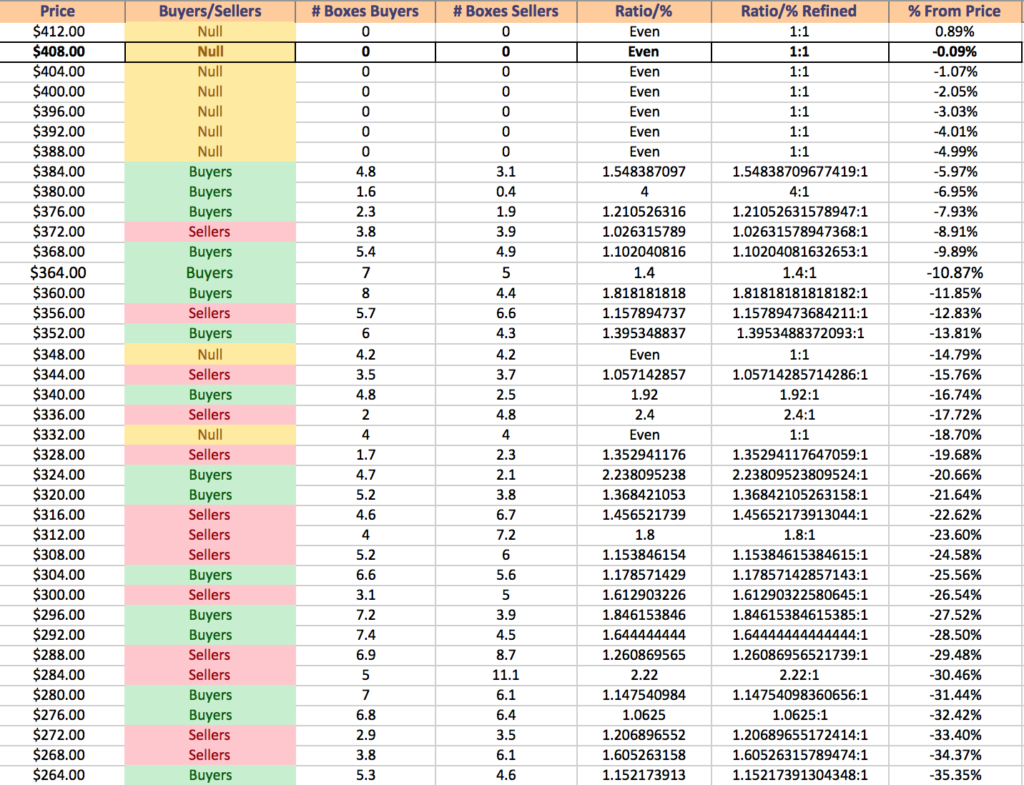
Price Level:Volume Sentiment Analysis For QQQ, The Invesco QQQ Trust ETF
Much like SPY, QQQ sits in a similar position near its 52-week high & has limited buyer:seller data near these price levels for the past 1-2 years.
After a -5% decline there is a window of buyer dominated prices, but minus the sturdy 4:1 Buyers:Sellers price zone of $380-383.99/share things begin to get a bit muddier.
This would enter the consolidation range that would become the right shoulder mentioned prior.
If prices are walked down to the $341.67 support level (which we may well be based on the volume sentiments below & the current positioning of QQQ’s moving averages), then there is no support until $311.69/share.
There is one price zone in between those levels (similar to SPY above) that has standout Buyer:Seller levels over the last 1-2 years, the $324-327.99/share price zone.
Should this not hold up there are strong chances that the $307.31/share support level is tested, which may lead to a test of the $300/share level based on the Seller:Buyer volume of that price level.
While this would be a medium-term price movement most likely, it will be something worth keeping an eye on along the way down.
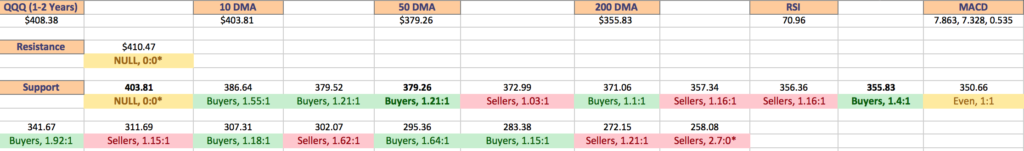

$412 – NULL – 0:0*; +0.89% From Current Price Level
$408 – NULL – 0:0*; -0.09% From Current Price Level – Current Price Box*
$404 – NULL – 0:0*; -1.07% From Current Price Level
$400 – NULL – 0:0*; -2.05% From Current Price Level – 10 Day Moving Average*
$396 – NULL – 0:0*; -3.03% From Current Price Level
$392 – NULL – 0:0*; -4.01% From Current Price Level
$388 – NULL – 0:0*; -4.99% From Current Price Level
$384 – Buyer s- 1.55:1; -5.97% From Current Price Level
$380 – Buyers – 4:1; -6.95% From Current Price Level
$376 – Buyers – 1.21:1; -7.93% From Current Price Level – 50 Day Moving Average
$372 – Sellers – 1.03:1; -8.91% From Current Price Level
$368 – Buyers – 1.1:1; -9.89% From Current Price Level
$364 – Buyers – 1.4:1; -10.87% From Current Price Level
$360 – Buyers – 1.82:1; -11.85% From Current Price Level
$356 – Sellers – 1.16:1; -12.83% From Current Price Level
$352 – Buyers – 1.40:1; -13.81% From Current Price Level – 200 Day Moving Average
$348 – Even – 1:1; -14.79% From Current Price Level
$344 – Sellers – 1.06:1; -15.76% From Current Price Level
$340 – Buyers – 1.92:1; -16.74% From Current Price Level
$336 – Sellers – 2.4:1; -17.72% From Current Price Level
$332 – Even – 1:1; -18.7% From Current Price Level
$328 – Sellers – 1.36:1; -19.68% From Current Price Level
$324 – Buyers – 2.24:1; -20.66% From Current Price Level
$320 – Buyers – 1.37:1; -21.64% From Current Price Level
$316 – Sellers – 1.46:1; -22.62 From Current Price Level
$312 – Sellers – 1.8:1; -23.6% From Current Price Level
$308 – Sellers – 1.15:1; -24.58% From Current Price Level
$304 – Buyers – 1.18:1; -25.56% From Current Price Level
$300 – Sellers – 1.62:1; 26.54% From Current Price Level
$296 – Buyers – 1.85:1; -27.52% From Current Price Level
$292 – Buyers – 1.64:1; -28.5% From Current Price Level
$288 – Sellers – 1.26:1; -29.48% From Current Price Level
$284 – Sellers – 2.22:1; -30.46% From Current Price Level
$280 – Buyers – 1.15:1; -31.44% From Current Price Level
$276 – Buyers – 1.06:1; -32.42% From Current Price Level
$272 – Sellers – 1.21:1; -33.4% From Current Price Level
$268 – Sellers – 1.61:1; -34.37% From Current Price Level
$264 – Buyers – 1.15:1; -35.35% From Current Price Level
$260 – Sellers – 3.6:1; -36.33% From Current Price Level
$256 – Sellers – 2.7:0*; -37.31% From Current Price Level
Technical Analysis Of IWM, The iShares Russell 2000 ETF
IWM, the iShares Russell 2000 ETF advanced +2.63% last week, as investors favored the small cap index over the other major indexes.
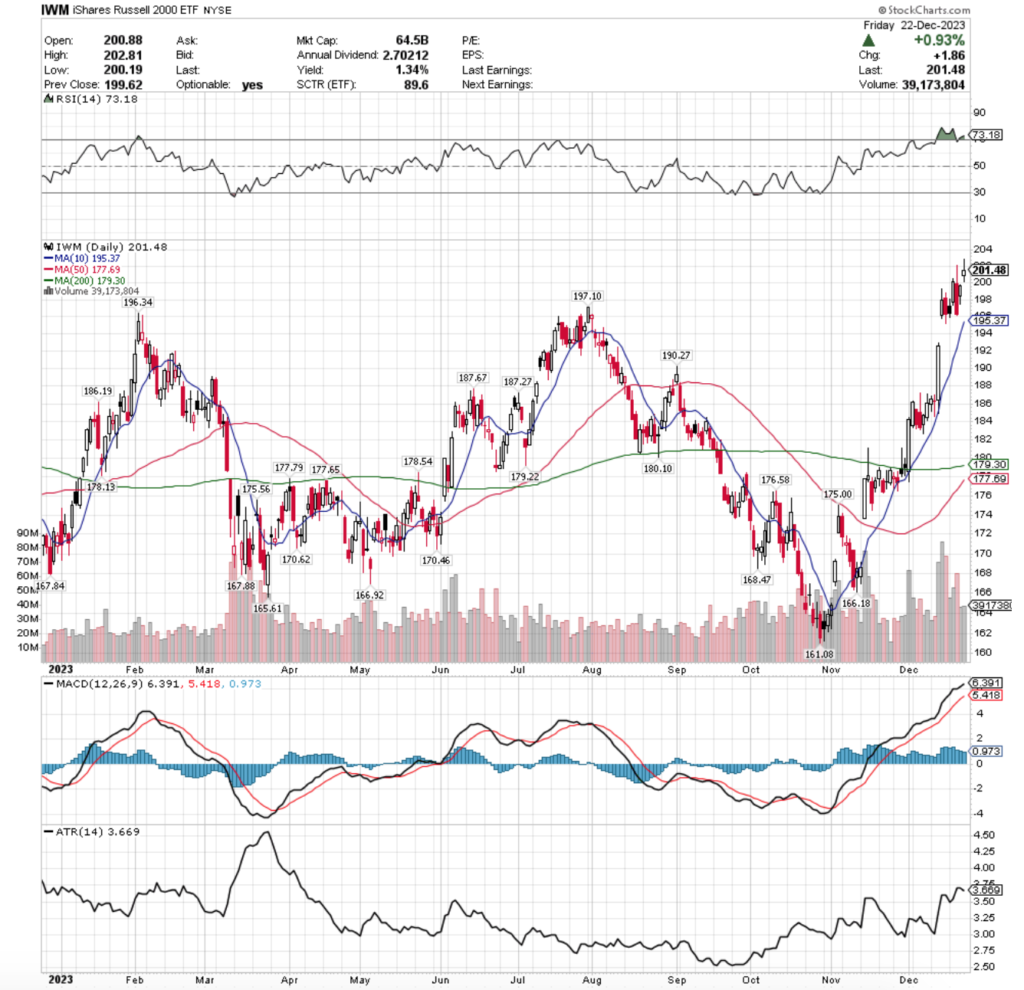
Their RSI is also currently overbought at 73.18, while their MACD is still bullish, but beginning to stretch out as if it is exhausting & preparing to roll over bearishly following a month & a half long advance.
Volumes were +50.54% above average last week compared tot he year prior (47,347,420 vs. 31,451,786), which is the aftershock of last week’s massive price jumps & high volume sessions of Wednesday & Thursday, as well as last Friday’s heavy volume profit taking day that followed.
Monday established a bearish harami that set up the squeeze that brought about the end of the week’s new 52-week high, as the day’s candle opened higher than Friday’s but closed lower for the session, with an upper shadow that tested near Friday’s open.
Tuesday’s session featured a wide-range real body higher, with slight upper & lower shadows on the second highest volume of the week, indicating that there was risk appetite, but that it was relatively confined to the open & closing prices & in between, not much higher or lower.
Wednesday set a new 52-week high for the time being before retreating like the other indexes into a day of steep declines on high volumes (highest of the week) as investors were eager to secure profits & take them off of the table.
Thursday completed a bearish harami pattern that tested much lower than it closed based on the lower shadow of the day’s candle, which broke below the $198/share price level on low volume.
Friday sent conflicting signals & clouds of uncertainty, with a gap up session whose lower shadow did not touch the $200/share price level, but whose real body was concentrated in the lower 50% of the day’s range, despite establishing a new 52-week high.
The low volume of the session also indicated that there was limited interest in carrying risk into the long weekend.
IWM’s Average True Range also has been declining, signaling that there is a weakening in the trend.
There is a support zone between the 10 DMA, $197.10 & $196.34/share price range which will be an area to keep an eye on in the coming days-to-weeks, particularly as their 50 & 200 day moving averages are primed to form a golden cross in the coming week.
Should prices drop below there, the window created last week between Wednesday & Thursday will become a problem area & likely lead to further declines.
Price Level:Volume Sentiment Analysis For IWM, The iShares Russell 2000 ETF
IWM is in a different camp than the other major indexes, as although they too are are 52-week highs & have limited data at these levels, they also have not ascended the same way as the others & have fluctuated more in ranges of the past year.
As they move differently than the other three ETFs noted in this article, it is imperative to consider that while reading their charts below.
The support zone of $194-197.99/share is currently jam packed with buyer sentiment, however, given that this contains two prior 52-week highs the sellers are underrepresented as there has been limited trading action at these price levels.
After a 7% drop from their current price level the buyer sentiment is much more diluted that it is at the higher price levels, which is where the shoulders of the prior head & shoulders patterns occurred.
Should it be tested, the $180-181.99/share price level will be interesting to see, given that it is currently even between buyers & sellers historically.
With how IWM tends to fluctuate in ranges & how their 52-week low was set only 2 months ago it will be interesting to see how buyers & sellers meet, as many of the price levels below do have limited/skewed data that is reflective of the oscillating nature of the ETF.
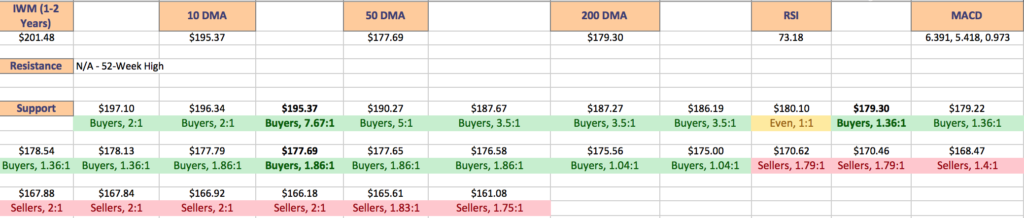
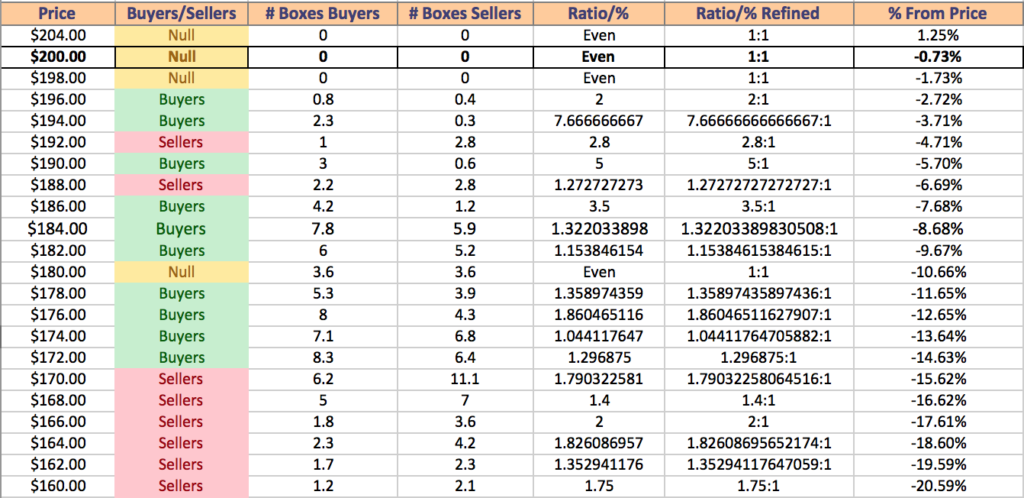
$204 – NULL – 0:0*; +1.25% From Current Price Level
$200 – NULL – 0:0*; -0.73% From Current Price Level – Current Price Box*
$198 – NULL – 0:0*; -1.73% From Current Price Level
$196 – Buyers – 2:1; -2.72% From Current Price Level
$194 – Buyers – 7.67:1; -3.71% From Current Price Level – 10 Day Moving Average*
$192 – Sellers – 2.8:1; -4.71% From Current Price Level
$190 – Buyers – 5:1; -5.7% From Current Price Level
$188 – Sellers – 1.27:1; -6.69% From Current Price Level
$186 – Buyers – 3.5:1; -7.68% From Current Price Level
$184 – Buyers – 1.32:1; -8.68% From Current Price Level
$182 – Buyers – 1.15:1; -9.67% From Current Price Level
$180 – Even – 1:1; -10.66% From Current Price Level
$178 – Buyers – 1.36:1; -11.65% From Current Price Level – 200 Day Moving Average*
$176 – Buyers – 1.86:1; -12.65% From Current Price Level – 50 Day Moving Average*
$174 – Buyers – 1.04:1; -13.64% From Current Price Level
$172 – Buyers – 1.30:1; -14.63% From Current Price Level
$170 – Sellers – 1.79:1; -15.62% From Current Price Level
$168 – Sellers – 1.4:1; -16.62% From Current Price Level
$166 – Sellers – 2:1; -17.61% From Current Price Level
$164 – Sellers – 1.83:1; -18.6% From Current Price Level
$162 – Sellers – 1.35:1; -19.59% From Current Price Level
$160 – Sellers – 1.75:1; -20.59% From Current Price Level
Technical Analysis Of DIA, The SPDR Dow Jones Industrial Average ETF
DIA, the SPDR Dow Jones Industrial Average ETF gained +0.31% last week, faring the worst of the major indexes, as investors took profits on Wednesday & Thursday, while remaining otherwise rangebound all week.
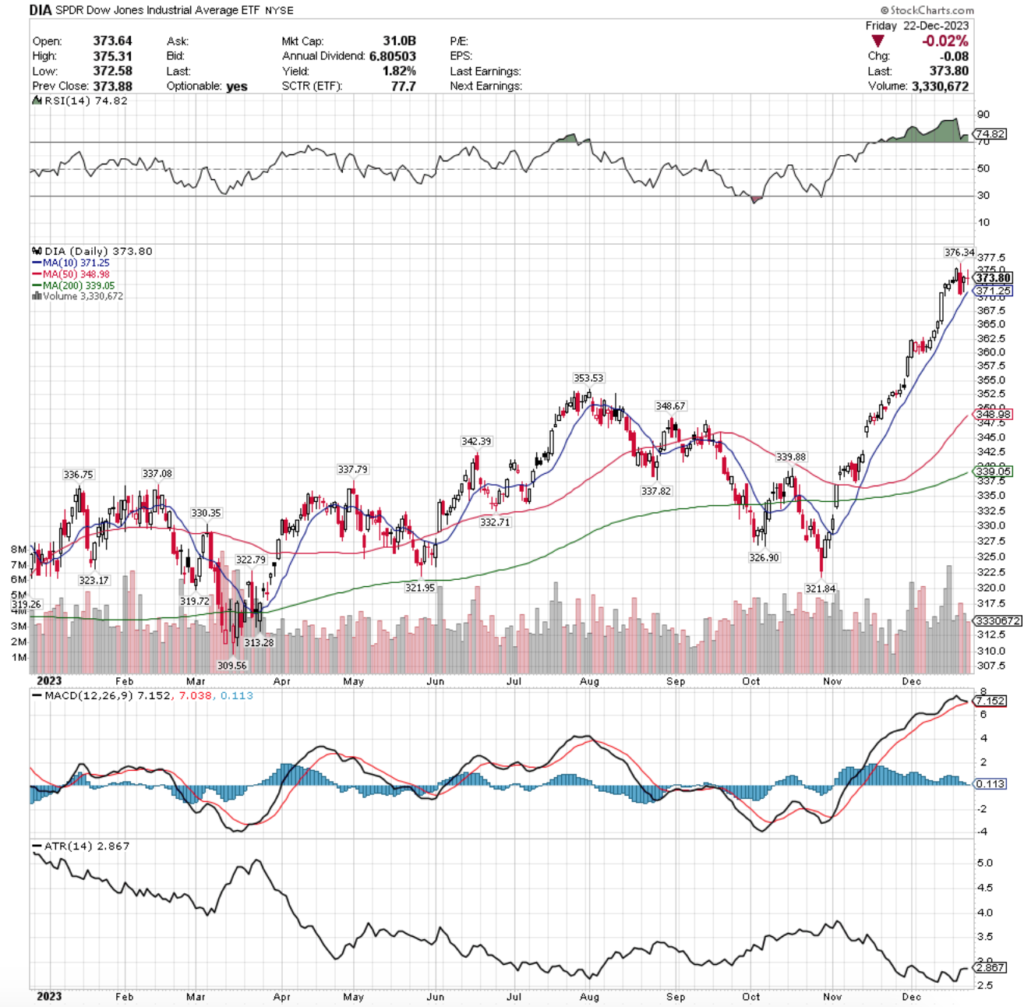
Their RSI is also overbought at 74.82, while their MACD is currently bullish, but showing an impending bearish crossover in the coming week.
Volumes were +8.53% above average last week compared to the year prior (3,777,000 vs. 3,480,259), which indicates that people are still interested in the larger cap names, but are also on edge due to Wednesday’s declining session being the highest volume of the week (the chart also looks like someone giving the middle finger for the week if you look closely at the volumes, reading between the lines).
Monday kicked off the week on an uncertain note, with a spinning top that closed lower than it opened & whose real body remained mostly in the bottom 60% of the candle.
Tuesday saw a run higher with a wide-range candle that broke the $375/share mark & set a temporary new 52-week high, but there was limited volume confirming that this was a bullish signal.
Wednesday opened midway through Tuesday’s candle’s real body, broke higher to set a new 52-week high, but declined to below the close of the previous Thursday’s session & whose lower shadow dipped into the range the prior Wednesday’s session traded in, while on the highest volume of the week.
Thursday completed a bearish harami pattern with a long lower shadow that found support just above the 10 day moving average, but managed to close higher.
Friday provided even more indecision on a declining session that was a doji, as it’s upper shadow tested lower than the two highest sessions of the week, while its lower shadow dipped below all of the sessions except for Wednesday’s real bodies (and all but Thursday’s lower shadows as well).
DIA’s Average True Range is signaling that there is not a strong trend, but the line is flat, signaling that there will soon be a break to one direction or another.
Should there be a move to the downside & the 10 DMA’s support is broken, it will be worth watching to see where the 50 DMA is at, as currently the only support level between the 10 & 50 DMAs is $353.53/share.
There is also a watch for a bearish head & shoulders for DIA in the medium term, particularly as so many market participants have sought shelter there over the past 6-12 months.
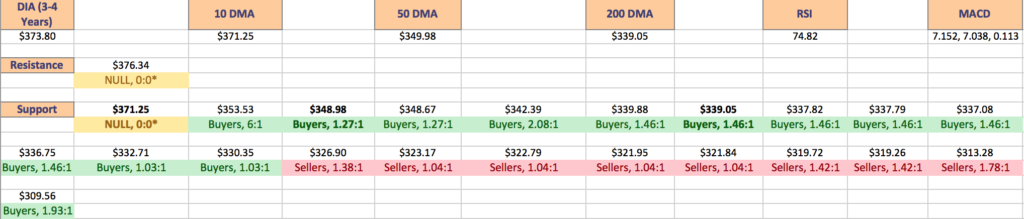
Price Level:Volume Sentiment Analysis For DIA, The SPDR Dow Jones Industrial Average ETF
DIA’s price level:volume sentiment is also different than SPY & QQQ, but not for the same reasons as IWM.
They’ve run up so far from their nearest support levels that aren’t moving averages that there is a lot of room without much footing to catch on to.
The 10 day moving average currently is so close to the 52-week high that there is limited data on whether its buyer or seller dominated.
What’s concerning regarding DIA is that so many market participants have continued to pile into them while other indexes have taken losses, which gives cause for concern should there be some event that leads everyone for the exits.
In the event of a 10% correction to DIA, the levels below it for the next 2.25% down are still buyer dominated, but weakly, before the seller dominance steps in for an additional 4.25%, which is in the price range of their current 52-week high (set in March of 2023).
This will be something to keep an eye on in the event of decline, especially if there happens to be a 10%+ fall.
Given that DIA is also using 3-4 years worth of data, the lower range data discussed above is not as lacking in sample size compared to the other indexes mentioned prior, making it more meaningful in the long-run.
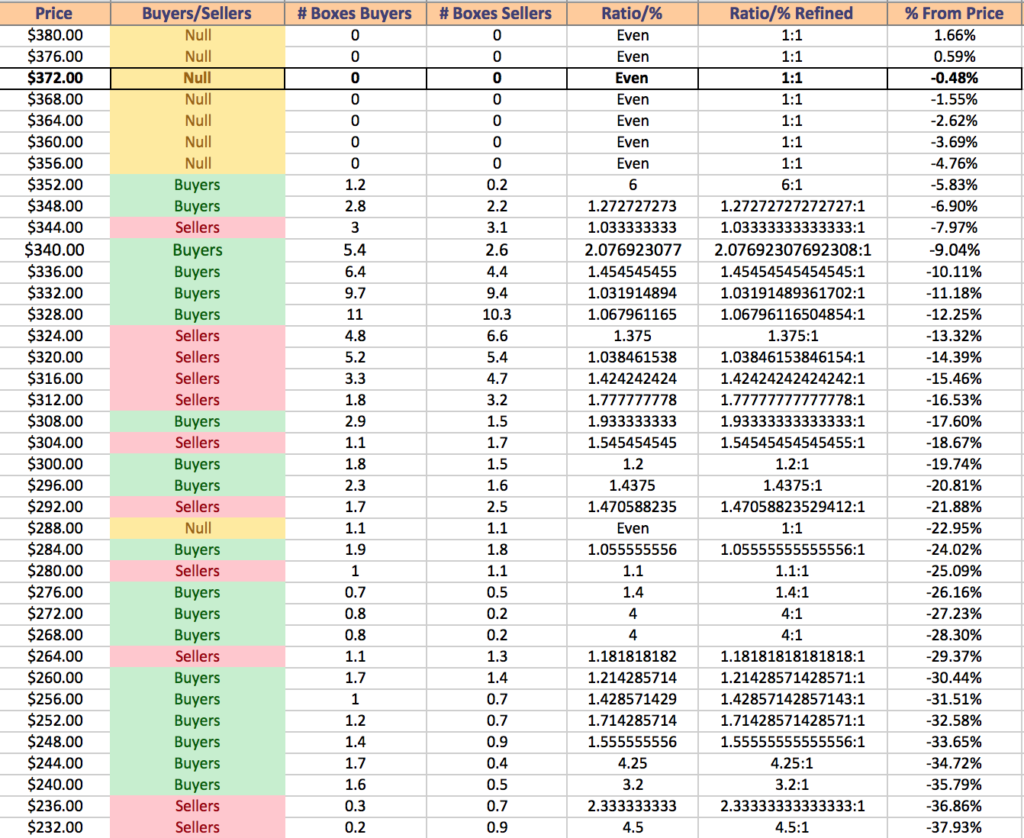
$380 – NULL – 0:0*; +1.66% From Current Price Level
$376 – NULL – 0:0*; +0.59% From Current Price Level
$372 – NULL – 0:0*; -0.48% From Current Price Level – Current Price Box & 10 Day Moving Average*
$368 – NULL – 0:0*; -1.55% From Current Price Level
$364 – NULL – 0:0*; -2.62% From Current Price Level
$360 – NULL – 0:0*; -3.69% From Current Price Level
$356 – NULL – 0:0*; -4.76% From Current Price Level
$352 – Buyers – 6:1; -5.83% From Current Price Level
$348 – Buyers – 1.27:1; -6.9% From Current Price Level – 50 Day Moving Average*
$344 – Sellers – 1.03:1; -7.97% From Current Price Level
$340 – Buyers – 2.08:1; -9.04% From Current Price Level
$336 – Buyers- 1.45:1; -10.11% From Current Price Level – 200 Day Moving Average*
$332 – Buyers – 1.03:1; -11.18% From Current Price Level
$328 – Buyers – 1.07:1; -12.25% From Current Price Level
$324 – Sellers – 1.38:1; -13.32% From Current Price Level
$320 – Sellers – 1.04:1; -14.39% From Current Price Level
$316 – Sellers – 1.42:1; -15.46% From Current Price Level
$312 – Sellers – 1.78:1; -16.53% From Current Price Level
$308 – Buyers – 1.93:1; -17.6% From Current Price Level
$304 – Sellers – 1.55:1; -18.67% From Current Price Level
$300 – Buyers – 1.2:1; -19.74% From Current Price Level
$296 – Buyers – 1.44:1; -20.81% From Current Price Level
$292 – Sellers – 1.47:1; -21.88% From Current Price Level
$288 – Even – 1:1; -22.95% From Current Price Level
$284 – Buyers – 1.06:1; -24.02% From Current Price Level
$280 – Sellers – 1.1:1; -25.09% From Current Price Level
$276 – Buyers – 1.4:1; -26.16% From Current Price Level
$272 – Buyers – 4:1; -27.23% From Current Price Level
$268 – Buyers – 4:1; -28.3% From Current Price Level
$264 – Sellers – 1.18:1; -29.37% From Current Price Level
$260 – Buyers – 1.21:1; -30.44% From Current Price Level
$256 – Buyers – 1.43:1; -31.51% From Current Price Level
$252 – Buyers – 1.71:1; -32.58% From Current Price Level
$248 – Buyer s- 1.56:1; -33.65% From Current Price Level
$244 – Buyers – 4.25:1; -34.72% From Current Price Level
$240 – Buyers – 3.2:1; -35.79% From Current Price Level
$236 – Sellers – 2.33:1; -36.86% From Current Price Level
$232 – Sellers – 4.5:1; -37.93% From Current Price Level
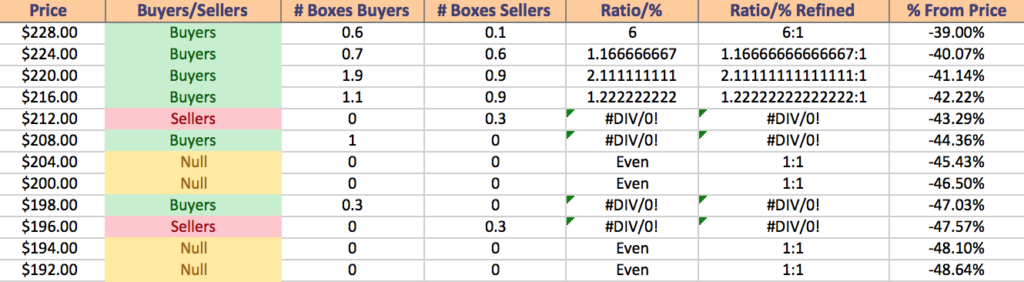
$228 – Buyers – 6:1; -39% From Current Price Level
$224 – Buyers – 1.17:1; -40.07% From Current Price Level
$220 – Buyers – 2.11:1; -41.14% From Current Price Level
$216 – Buyers – 1.22:1; -42.22% From Current Price Level
$212 – Sellers – 0.3:0**; -43.29% From Current Price Level
$208 – Buyers – 1:0*; -44.36% From Current Price Level
$204 – NULL – 0:0*; -45.43% From Current Price Level
$200 – NULL – 0:0*; -46.5% From Current Price Level
$198 – Buyers – 0.3:0*; -47.03% From Current Price Level
$196 – Sellers – 0.3:0*; -47.57% From Current Price Level
$194 – NULL – 0:0*; -48.1% From Current Price Level
$192 – NULL – 0:0*; -48.64% From Current Price Level
The Week Ahead
Monday will have no economic data to report as it is Christmas & markets will be closed.
Tuesday kicks the week off with S&P Case-Schiller Home Price Index (20 cities) dat at 9 am.
Wednesday has no data scheduled to be released.
Initial Jobless Claims, Advanced U.S. Trade Balance In Goods, Advanced Retail Inventories & Advanced Wholesale Inventories data are released Thursday at 8:30 am, followed by Pending Home Sales at 10 am.
Friday the week winds down with the Chicago Business Barometer data at 9:45 am & the bond market will be closing early.
See you back here next year!
*** I DO NOT OWN SHARES OR OPTIONS CONTRACT POSITIONS IN SPY, QQQ, IWM, OR DIA & THIS IS NOT INVESTING ADVICE, PLEASE DO YOUR OWN DUE DILIGENCE ***