Markets have reached an interesting point again recently, with the S&P 500 & Dow Jones Industrial Average flirting with a new 52-week high, the NASDAQ breaking their most recent 52-week high & the Russell 2000 recently recovered after setting a new 52-week low.
However, volumes & oscillators are not currently convincing of strength in the markets, making it important to take a step back & see how recent history may impact the near-future.
Read our breakdown of the markets’ recent technicals, as well as an updated price level:volume sentiment reading, which breaks down the volume levels of the past 1-4 years for each index on a price percentage basis.
Technical Analysis & Price Level:Volume Sentiment Analysis For The S&P 500 (SPY)
SPY, the SPDR S&P 500 ETF added +1.13% last week, faring the second worst of the indexes, second only to the NASDAQ.
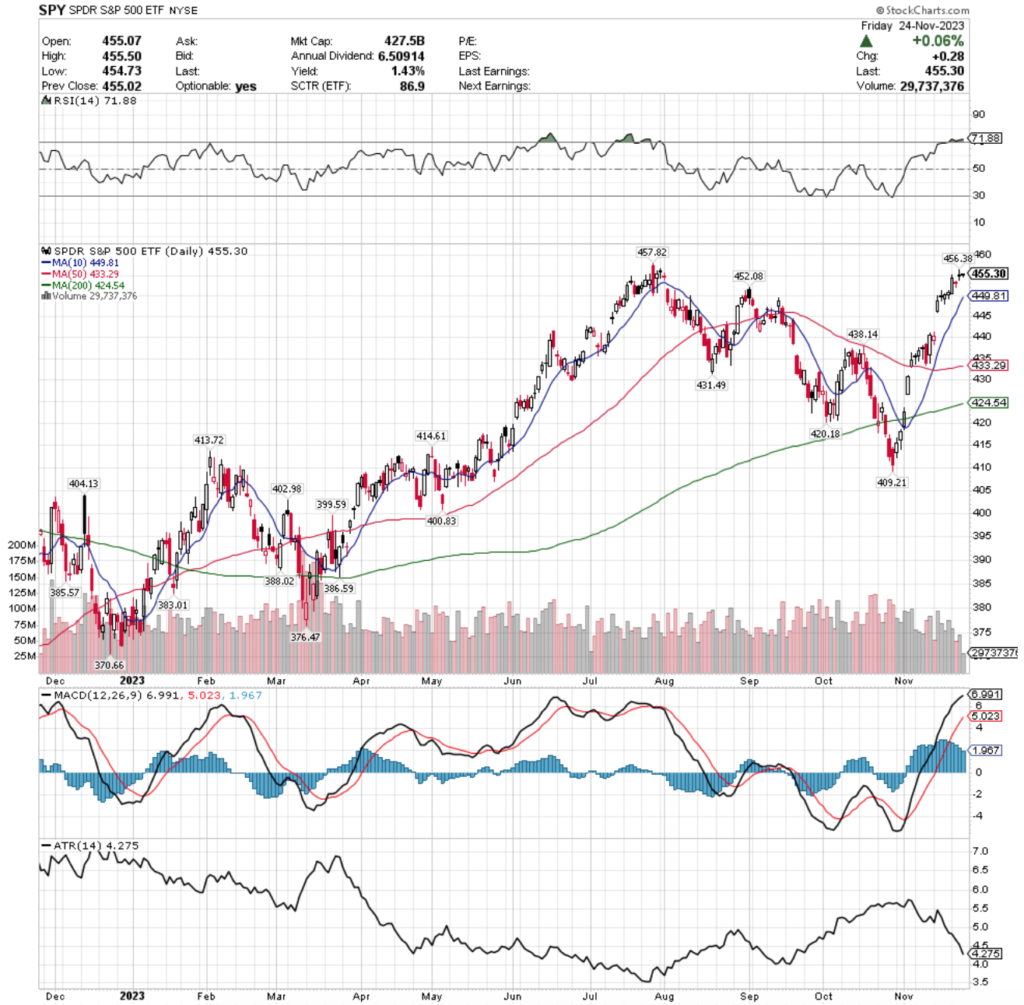
Their RSI is overbought at 71.88 & their MACD is showing signals of losing steam & an impending bearish crossover.
Volumes were a cause for concern last week, falling -27.32% below average compared to the year prior (59,685,350 vs. 82,125,986) & really signaling uncertainty in the near-term market environment.
Monday’s wide-range candle & advancing session also looks weaker than it first appeared, given that it was lower than 3 of the 5 sessions of the week before, neck & neck with 1 of the 5 & only higher than the prior Monday’s session, which was a declining day.
Tuesday’s candle created a bearish harami pattern, but as it was a dragonfly doji created the set up for Wednesday & Friday’s slight increases.
Wednesday & Friday both resulted in dojis, however they were tied tightly to the range created by the upper shadow of Monday’s session’s candle.
Also bearish, they closed lower than they opened, despite opening slightly up each day, signaling that risk appetite is weak as we sit near 52-week highs.
Wednesday’s session tried to push a bit higher based on the upper shadow, but it appears that there is limited-to-no interest in surpassing the current 52-week high currently.
SPY’s Average True Range is also signaling that there is not much strength to the current price trend & indicates that there will be a cool-down period in the near-future, pending no market catalyst appear from earnings reports or data reported next week.
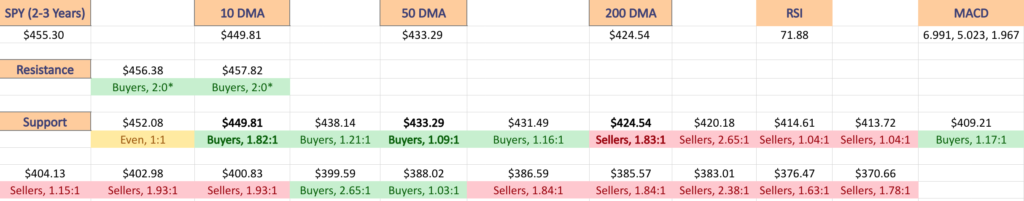
SPY does have more buyers than sellers at every price level between here & ~-7%, but if the $448 price level doesn’t hold up, the buyer-dominant sentiment weakens dramatically before giving way to seller dominated zones that have much more strength in terms of Sellers:Buyers.
There looks to be an additional 5-6% of declines that could come about if those buyer dominated zones give way, as the next strong level of buyers that is not nestled into the seller blocks is -13% from the current price.
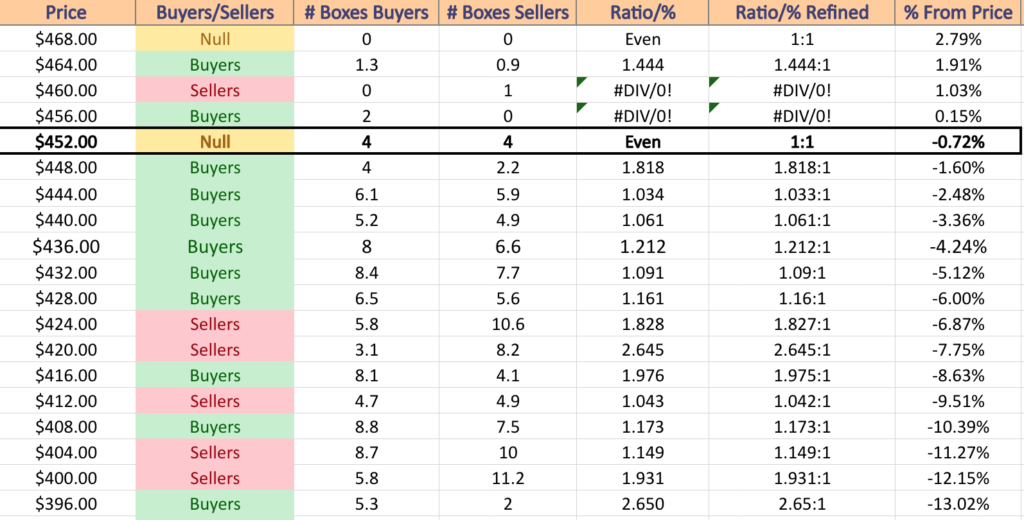
Price Level:Volume Sentiment Analysis For SPY, the SPDR S&P 500 ETF
$468 – NULL – 0:0*; +2.79% From Current Price Level
$464 – Buyers – 1.44:1; +1.91% From Current Price Level
$460 – Sellers – 1:0*; +1.03% From Current Price Level
$456 – Buyers – 2:0*; +0.15% From Current Price Level
$452 – Even – 1:1; -0.72% From Current Price Level – Current Price Box*
$448 – Buyers – 1.82:1; -1.6% From Current Price Level – 10 Day Moving Average*
$444 – Buyers – 1.03:1; -2.48% From Current Price Level
$440 – Buyers – 1.06:1; -3.36% From Current Price Level
$436 – Buyers – 1.21:1; -4.24% From Current Price Level
$432 – Buyers – 1.09:1; -5.12% From Current Price Level – 50 Day Moving Average*
$428 – Buyers – 1.16:1; -6% From Current Price Level
$424 – Sellers – 1.83:1; -6.87% From Current Price Level – 200 Day Moving Average*
$420 – Sellers – 2.65:1; -7.75% From Current Price Level
$416 – Buyers – 1.98:1; -8.63% From Current Price Level
$412 – Sellers – 1.04:1; -9.51% From Current Price Level
$408 – Buyers – 1.17:1; -10.39% From Current Price Level
$404 – Sellers – 1.15:1; -11.27% From Current Price Level
$400 – Sellers – 1.93:1; -12.15% From Current Price Level
$396 – Buyers – 2.65:1; -13.02% From Current Price Level
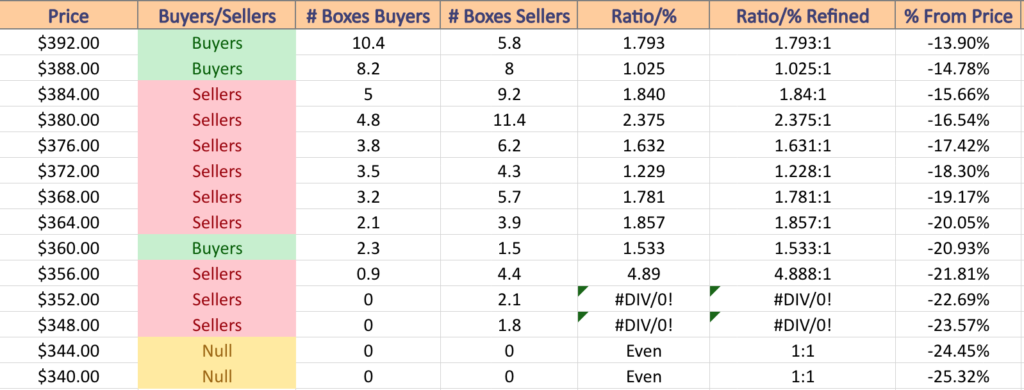
$392 – Buyers – 1.79:1; -13.9% From Current Price Level
$388 – Buyers – 1.03:1; -14.78% From Current Price Level
$384 – Sellers – 1.84:1; -15.66% From Current Price Level
$380 – Sellers- 2.38:1; -16.54% From Current Price Level
$376 – Sellers – 1.63:1; -17.42% From Current Price Level
$372 – Sellers – 1.23:1; -18.3% From Current Price Level
$368 – Sellers – 1.78:1; -19.17% From Current Price Level
$364 – Sellers – 1.86:1; -20.05% From Current Price Level
$360 -Buyers – 1.53:1; -20.93% From Current Price Level
$356 – Sellers – 4.89:1; -21.81% From Current Price Level
$352 – Sellers – 2.1:0*; -22.69% From Current Price Level
$348 – Sellers – 1.8:0*; -23.57% From Current Price Level
Technical Analysis & Price Level:Volume Sentiment Analysis For The NASDAQ (QQQ)
QQQ, the Invesco QQQ Trust ETF has the worst week of all the major indexes, gaining only +0.92% for the week.
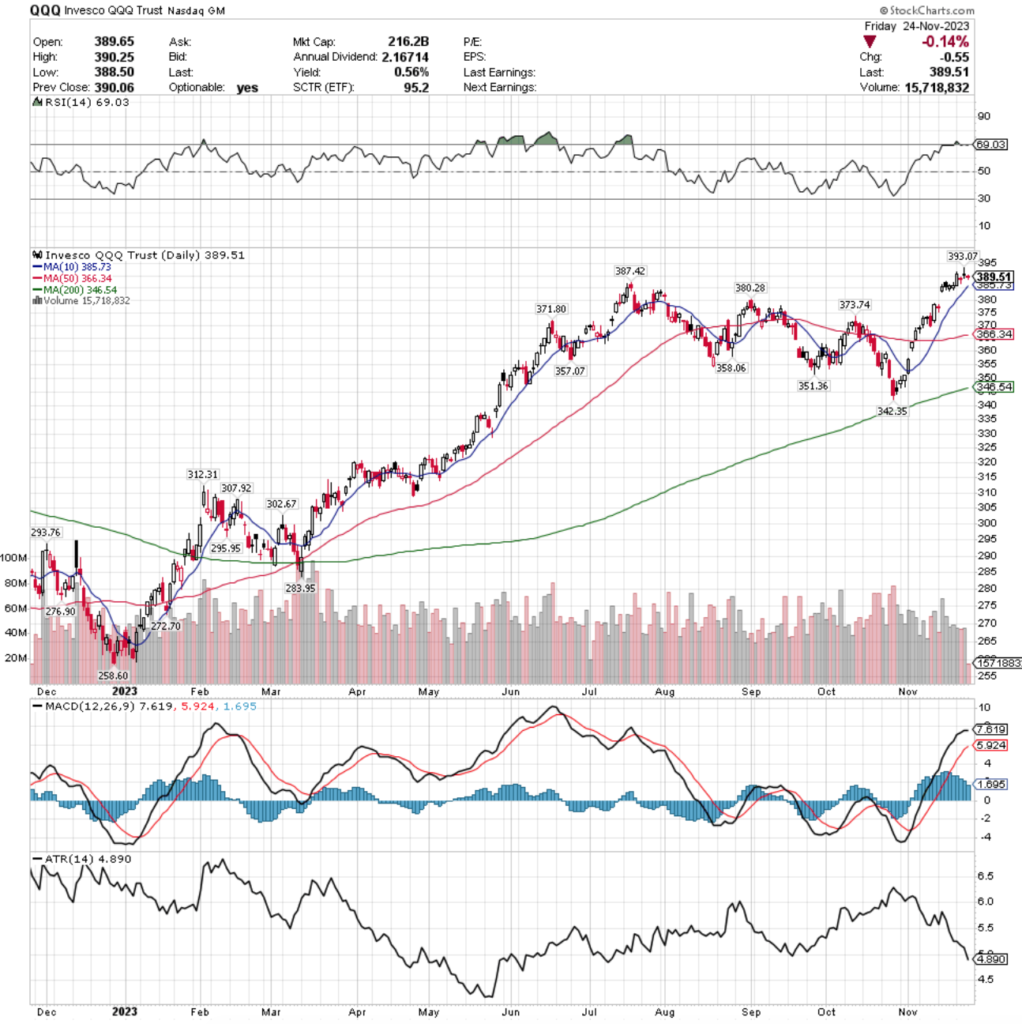
Their RSI is fluttering around the overbought level & sits currently at 69.03, but their MACD is aggressively barreling towards a bearish crossover in the coming sessions.
Volumes were also notably weak for QQQ this week, falling -24.6% below average compared to the year prior (39,920,300 vs. 52,941,855) as market participants got hesitant once reaching a new 52-week high & began to pump the brakes.
Monday opened strong, but the session’s volume was weaker than every session of the week prior’s & Tuesday’s bearish volume was neck & neck with Monday’s levels, as profits were eagerly taken.
Tuesday’s candle also formed a bearish harami with a dragonfly doji, similar to SPY’s set up, except QQQ was able to crack a new 52-week high on Wednesday’s spinning top session.
Given that Wednesday’s real body resides on the lower end of the day’s range & has a long upper shadow, it is safe to say that there is not much faith in strength at these price levels.
Friday’s doji candle will be of interest to watch into next week though, as it did not decline deep into Tuesday’s candle’s lower shadow, but the 10 day moving average is fast approaching & investors will want to know whether this will function as support or resistance in the near-term.
QQQ’s ATR also does not signal that this trend is particularly strong & implies that there is a cool-off/consolidation move in the making for the near-term.
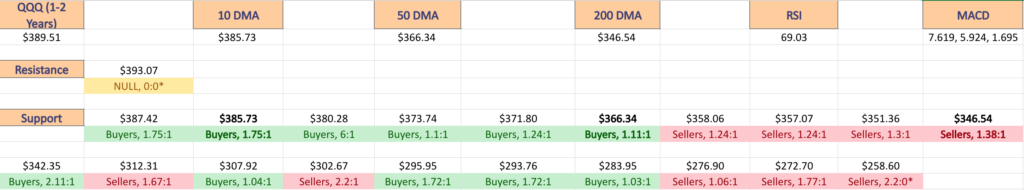
From their current price, QQQ has no seller dominated price zones until a decline of ~7.5%, which may be regarded as a signal of strength, but note that beyond the nearest two supporting price levels with buyer sentiment the enthusiasm historically has waned & seller dominated zones account for the next 10%+ of declines from there, which should be cause for concern.
Once prices decline beyond $335.99/share there will be a lot of selling pressure historically, with no support until $312.31 which will be another thing to keep an eye on.
There is a good support zone between $303.99-311.99/share though, which would be a relief given that at that point prices would have declined by ~20%.
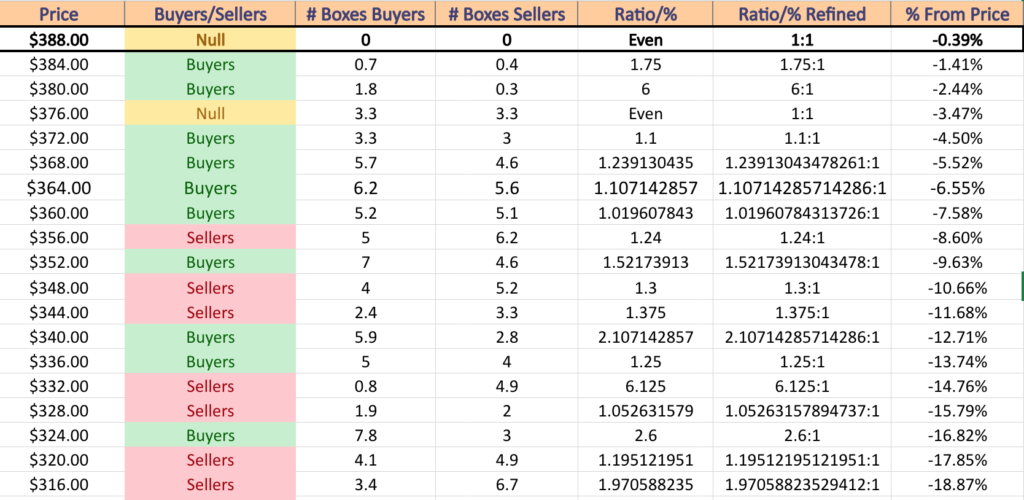
Price Level:Volume Sentiment Analysis For QQQ, the Invesco QQQ Trust ETF (NASDAQ)
$388 – NULL – 0:0*; -0.39% From Current Price Level – Current Price Box*
$384 – Buyers – 1.75:1; -1.41% From Current Price Level – 10 Day Moving Average*
$380 – Buyers – 6:1; -2.44% From Current Price Level
$376 – Even – 1:1; -3.47% From Current Price Level
$372 – Buyers – 1.1:1; -4.5% From Current Price Level
$368 – Buyers – 1.24:1; -5.52% From Current Price Level
$364 – Buyers – 1.11:1; -6.55% From Current Price Level – 50 Day Moving Average*
$360 – Buyers – 1.02:1; -7.58% From Current Price Level
$356 – Sellers – 1.24:1; -8.6% From Current Price Level
$352 – Buyers – 1.52:1; -9.63% From Current Price Level
$348 – Sellers – 1.3:1; -10.66% From Current Price Level
$344 – Sellers – 1.38:1; -11.68% From Current Price Level – 200 Day Moving Average*
$340 – Buyers – 2.11:1; -12.71% From Current Price Level
$336 – Buyers – 1.25:1; -13.74% From Current Price Level
$332 – Sellers – 6.13:1; -14.76% From Current Price Level
$328 – Sellers – 1.05:1; -15.79% From Current Price Level
$324 – Buyers – 2.6:1; -16.82% From Current Price Level
$320 – Sellers – 1.20:1; -17.85% From Current Price Level
$316 – Sellers – 1.97:1; -18.87% From Current Price Level
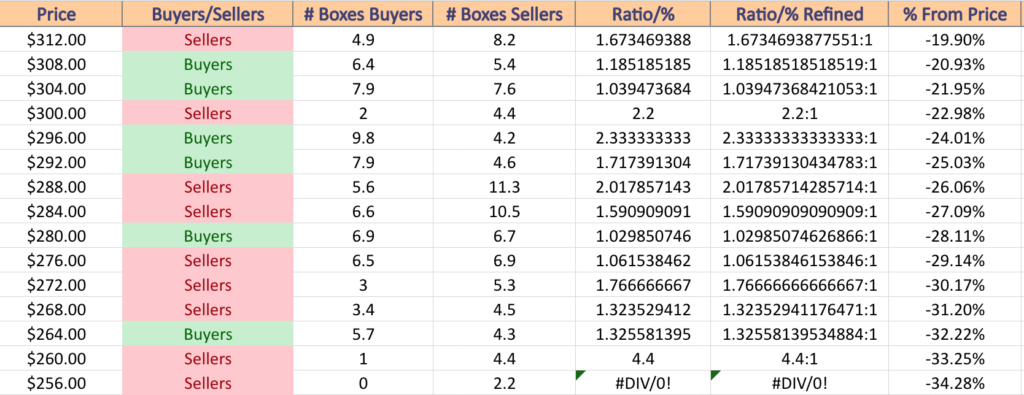
$312 – Sellers – 1.67:1; -19.9% From Current Price Level
$308 – Buyers – 1.19:1; -20.93% From Current Price Level
$304 – Buyers – 1.04:1; -21.95% From Current Price Level
$300 – Sellers – 2.2:1; -22.98% From Current Price Level
$296 – Buyers – 2.33:1; -24.01% From Current Price Level
$292 – Buyers – 1.72:1; -25.03% From Current Price Level
$288 – Sellers – 2.02:1; -26.06% From Current Price Level
$284 – Sellers – 1.59:1; -27.09% From Current Price Level
$280 – Buyers – 1.03:1; -28.11% From Current Price Level
$276 – Sellers – 1.06:1; -29.14% From Current Price Level
$272 – Sellers – 1.77:1; -30.17% From Current Price Level
$268 – Sellers – 1.32:1; -31.2% From Current Price Level
$264 – Buyers – 1.33:1; -32.22% From Current Price Level
$260 – Sellers – 4.4:1; -33.25% From Current Price Level
$256 – Sellers – 2.2:0*; -34.28% From Current Price Level
Technical Analysis & Price Level:Volume Sentiment Analysis For The Russell 2000 (IWM)
IWM, the iShares Russell 2000 ETF had the strongest week of all the major indexes last week, advancing +1.96% for the week.
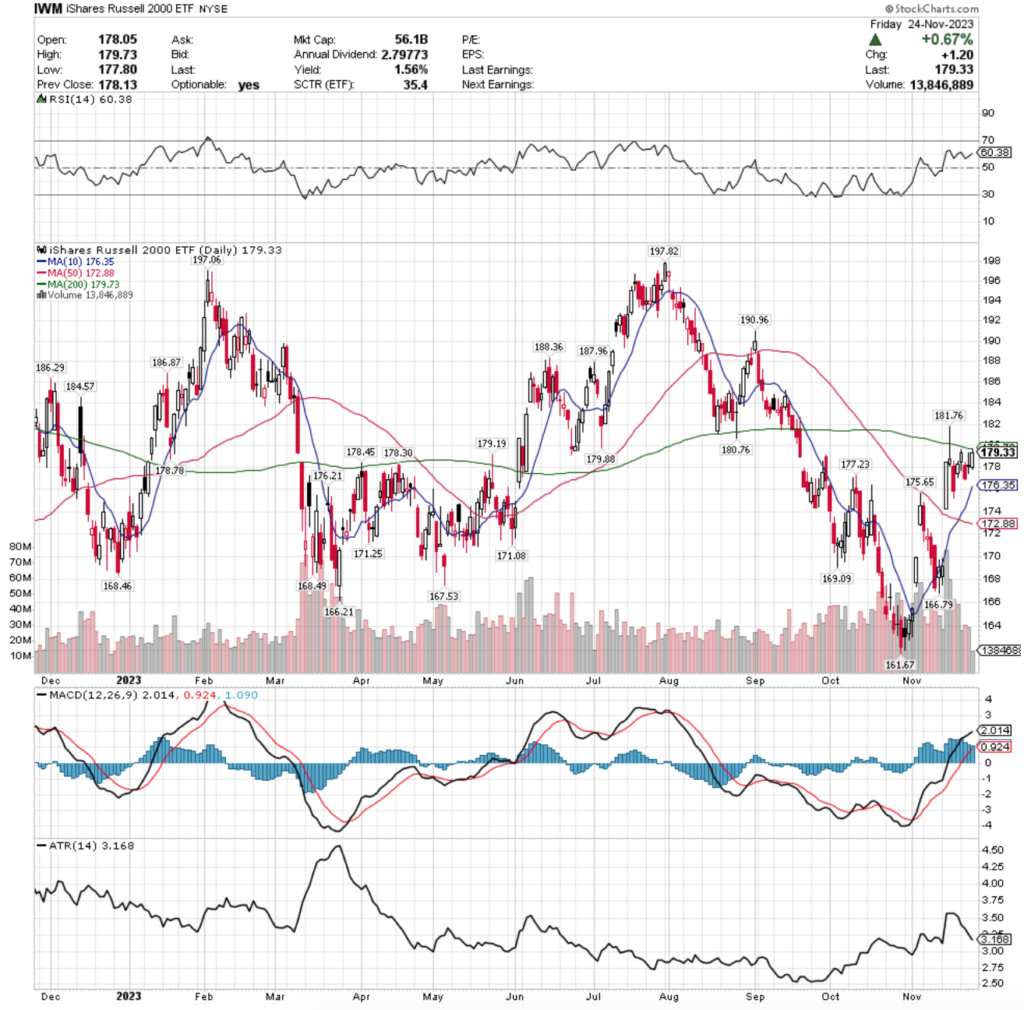
Their RSI is trending towards overbought after the gap up the week prior & sits at 60.38, while the MACD is beginning to show signs of exhaustion & looks like it may curl over bearishly in the coming days.
Volumes were +6.75% above average compared to the year prior (31,657,550 vs. 29,656,354), most likely attributed to people following the high volume trades of last week trying to make some last second profits.
IWM’s chart tells a different story than the previous two that we’ve reviewed, as they have recently bounced off of a 52-week low & been in recovery.
Monday had the third highest volume of the short week & prices made advances, but Tuesday’s declining session of profit taking was the highest volume session of the week, signaling a lack of strength at these price levels.
Wednesday featured a doji going into the holiday Thursday, where market participants sat unsure about which way to go next.
Friday’s candle is one of interest though, as we begin to see some of the downwards pressure that the 200 DMA is applying to IWM’s price & will be something to continue watching into next week to see if small caps can muster up the performance to break through the 200 DMA’s resistance.
Their ATR is also not indicating that there is much strength in the more recent price movements in terms of establishing a new trend.
IWM’s price level:volume sentiment shows that there is some support for ~5% from here in terms of the levels being buyer dominated over the past 1-2 years, but after that it is a seller dominated zone all the way through their 52-week low.
IWM’s 50 day moving average will be something to also keep an eye on, as it will continue to trend higher & is already the last support level that is buyer dominated before we enter that seller-dominated elevator down.
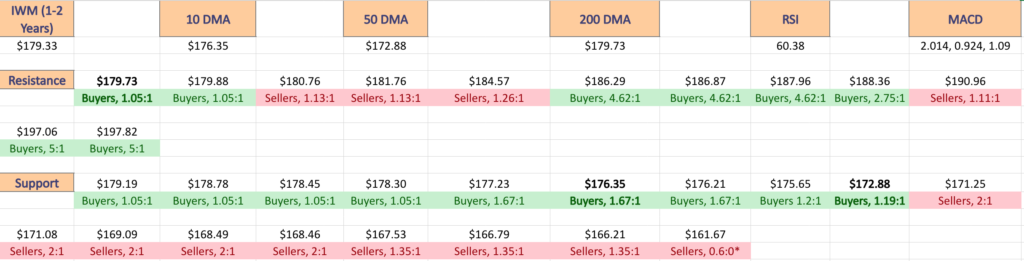
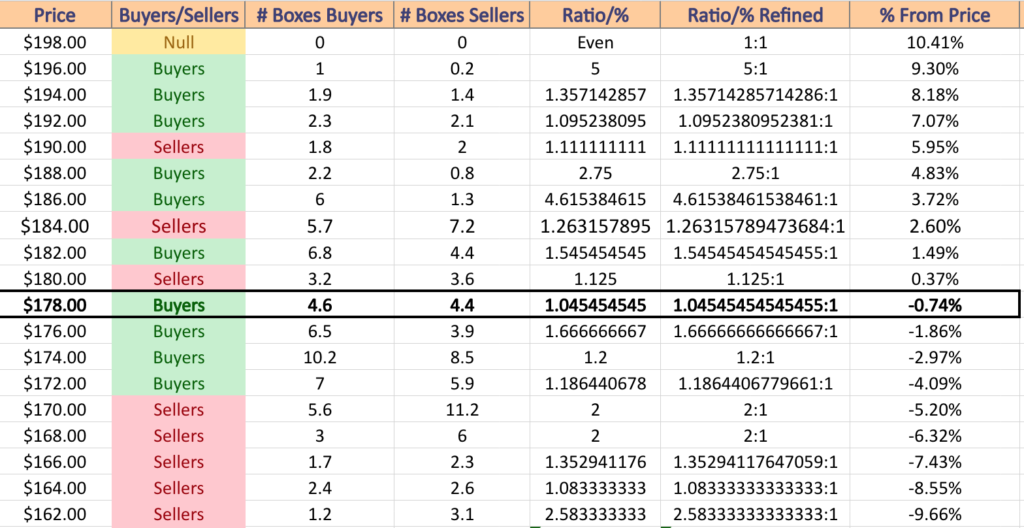

Price Level:Volume Sentiment For IWM, the iShares Russell 2000 ETF
$198 – NULL – 0:0*; +10.41% From Current Price Level
$196 – Buyers – 5:1; +9.3% From Current Price Level
$194 – Buyers – 1.36:1; +8.18% From Current Price Level
$192 – Buyers – 1.10:1; +7.07% From Current Price Level
$190 – Sellers – 1.11:1; +5.95% From Current Price Level
$188 – Buyers – 2.75:1; +4.83% From Current Price Level
$186 – Buyers – 4.62:1; +3.72% From Current Price Level
$184 – Sellers – 1.26:1; +2.6% From Current Price Level
$182 – Buyers – 1.55:1; +1.49% From Current Price Level
$180 – Sellers – 1.13:1; +0.37% From Current Price Level
$178 – Buyers – 1.05:1; -0.74% From Current Price Level – Current Price Box & 200 Day Moving Average**
$176 – Buyers – 1.67:1; -1.86% From Current Price Level – 10 Day Moving Average*
$174 – Buyers – 1.2:1; -2.97% From Current Price Level
$172 – Buyers – 1.19:1; -4.09% From Current Price Level
$170 – Sellers – 2:1; -5.2% From Current Price Level
$168 – Sellers – 2:1; -6.32% From Current Price Level
$166 – Sellers – 1.36:1; -7.43% From Current Price Level
$164 – Sellers – 1.08:1; -8.55% From Current Price Level
$162 – Sellers – 2.58:1; -9.66% From Current Price Level
$160 – Sellers – 0.6:0*; -10.78% From Current Price Level
Technical Analysis & Price Level:Volume Sentiment Analysis For The Dow Jones Industrial Average (DIA)
DIA, the SPDR Dow Jones Industrial Average ETF had the second best week of the major indexes, climbing +1.28% over the week.
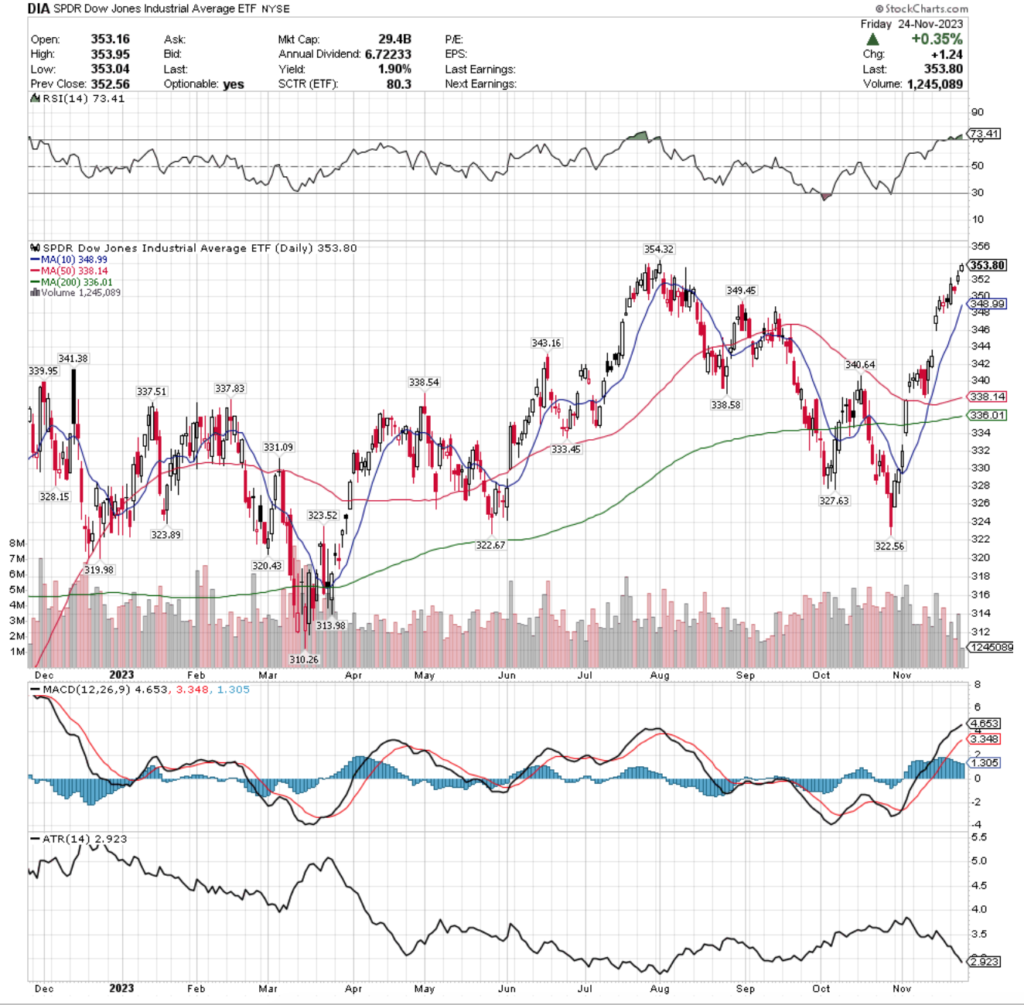
Their RSI is overbought at 73.41 & their MACD is signaling overextension & that there is a near-term consolidation period on the horizon.
Volumes were noteworthy though, falling -27.03% below average compared to the year prior (2,565,383 vs. 3,515,596), which does not make the week’s gains anything of note.
DIA is approaching their current 52-week high, but based on the last 2 sessions’ candles will not have an easy time breaking it.
Monday’s session looks like the other three indexes, non-noteworthy volume on a wide range session, Tuesday’s candle formed a bearish engulfing pattern on Monday’s, but its higher positioning in the day prior’s range did set up the slight gains of the next two sessions for the large caps.
However, Wednesday & Thursday’s spinning tops are signaling even more indecision, particularly as the volumes have been weak.
Note too that Friday’s open is at the extension of Thursday’s upper shadow that was on a relatively tall upper shadow, which is more indicative of a pump into weakness than of actual strength.
Like all of the other indexes, their ATR is also not supporting a narrative of strength around recent price movements & does flash a signal of near-term caution.
Their 10 DMA is also going to be something to keep a close eye on, as it is currently moving upwards still, while being the second highest level of support from the current price.
Once it becomes the highest support level it will be worth noting whether it acts as support or gets broken through, as then only the $349.45/share will be support before prices enter the window from the gap that we wrote about last week.
Buyers currently are in the drivers seat for the next ~7% downwards, however should there not be enough support there that 7% decline can very easily become 12%+ in losses based on the seller dominated price zones that sit just below the buyer blocks.
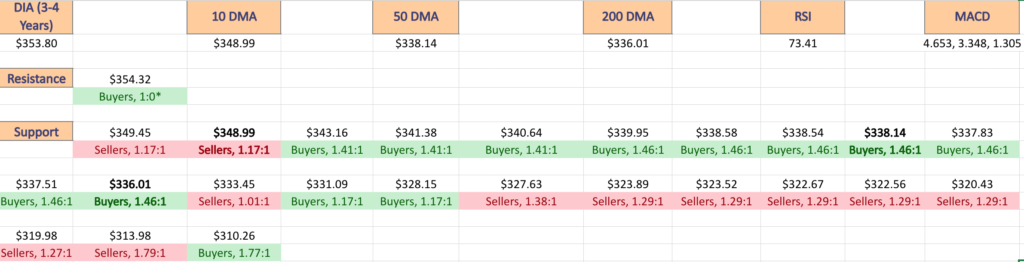
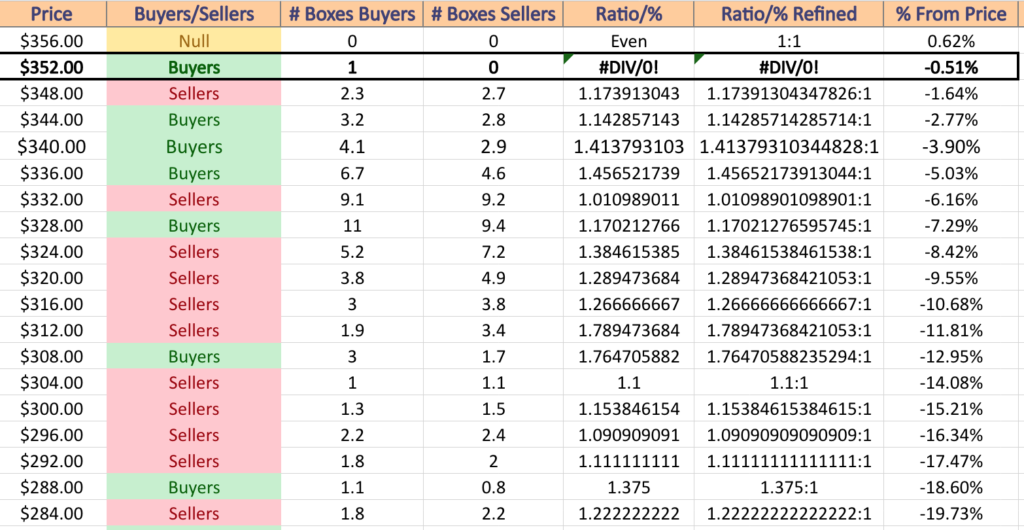
Price Level:Volume Sentiment For DIA, the SPDR Dow Jones Industrial Average ETF
$356 – NULL – 0:0*; +0.62% From Current Price Level
$352 – Buyers – 1:0*; -0.51% From Current Price Level – Current Price Box*
$348 – Sellers – 1.17:1; -1.64% From Current Price Level – 10 Day Moving Average*
$344 – Buyers – 1.14:1; -2.77% From Current Price Level
$340 – Buyers – 1.41:1; -3.9% From Current Price Level
$336 – Buyers, 1.46:1; -5.03% From Current Price Level – 50 & 200 Day Moving Averages**
$332 – Sellers – 1.01:1; -6.16% From Current Price Level
$328 – Buyers – 1.17:1; -7.29% From Current Price Level
$324 – Sellers – 1.39:1; -8.42% From Current Price Level
$320 – Sellers – 1.29:1; -9.55% From Current Price Level
$316 – Sellers – 1.27:1; -10.68% From Current Price Level
$312 – Sellers – 1.79:1; -11.81% From Current Price Level
$308 – Buyers – 1.77:1; -12.95% From Current Price Level
$304 – Sellers – 1.1:1; -14.08% From Current Price Level
$300 – Sellers – 1.15:1; -15.21% From Current Price Level
$296 – Sellers – 1.09:1; -16.34% From Current Price Level
$292 – Sellers – 1.11:1; -17.47% From Current Price Level
$288 – Buyers – 1.38:1; -18.6% From Current Price Level
$284 – Sellers – 1.22:1; -19.73% From Current Price Level
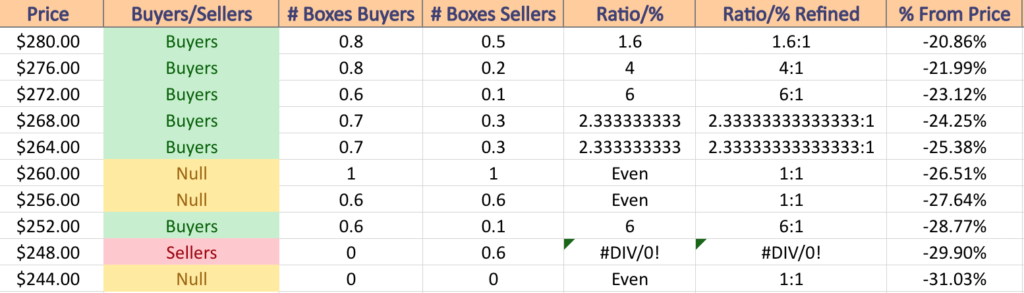
$280 – Buyers – 1.6:1; -20.86% From Current Price Level
$276 – Buyers – 4:1; -21.99% From Current Price Level
$272 – Buyers – 6:1; -23.12% From Current Price Level
$268 – Buyers – 2.33:1; -24.25% From Current Price Level
$264 – Buyers – 2.33:1; -25.38% From Current Price Level
$260 – Even – 1:1; -26.51% From Current Price Level
$256 – Even – 1:1; -27.64% From Current Price Level
$252 – Buyers – 6:1; -28.77% From Current Price Level
$248 – Sellers – 0.6:0*; -29.9% From Current Price Level
$244 – NULL – 0:0*; -31.03% From Current Price Level
The Week Ahead
Monday kicks the week off with New Homes Sales data at 10 am.
Cerence & Zscaler also are due to report earnings on Monday.
S&P Case-Shiller Home Price Index (20 Cities) data is released Tuesday at 9 am, followed by Consumer Confidence, Fed Governor Christopher Waller speaking & Chicago Fed President Austan Goolsbee speaking at 10 am, before Fed Governor Michelle Bowman speaks at 10:45 & the day winds down with Fed Governor Michael Barr speaking at 1:50 pm & 3:30 pm.
Tuesday’s earnings calls include AZEK, Bank of Montreal, CrowdStrike, Hewlett Packard Enterprise, Intuit, Leslie’s, NetApp, Pinduoduo, Splunk & Workday.
Wednesday delivers GDP (first revision), Advanced U.S. Trade Balance in Goods, Advanced Retail Inventories & Advanced Wholesale Inventories data at 8:30 am, Cleveland Fed President Loretta Mester speaking at 1:45 pm & the Fed Beige Book at 2 pm.
Dollar Tree, Salesforce, Arrowhead, Bilibili, Credo Technology Group, Donaldson, Farfetch, Five Below, Foot Locker, Hormel Foods, La-Z-Boy, Nutanix, Okta, Patterson Companies, Petco Health and Wellness, PVH, Snowflake, Synopsys, Vestis, Victoria’s Secret & Zuora are all scheduled to report earnings on Wednesday.
8:30 am Thursday will be busy, with Initial Jobless Claims, Personal Income (nominal), Personal Spending (nominal), PCE Index, Core PCE Index, PCE (Year-over-Year) & Core PCE (Year-over-Year) data being released, followed by New York Fed President John Williams speaking at 9:05 am, Chicago Business Barometer data at 9:45 am & Pending Home Sales data at 10 am.
Ulta Beauty, Academy Sports + Outdoors, Ambarella, American Woodmark, Big Lots, Cracker Barrel, Dell, Domo, Frontline, Kroger, PagerDuty, Royal Bank of Canada, Titan Machinery, Toronto-Dominion Bank, UBS AG, UiPath & Zumiez will all report earnings on Thursday.
Friday gives us Fed Governor Michael Barr speaking at 3 am, ISM Manufacturing data, Construction Spending & Austan Goolsbee speaking at 10 am, Fed Chair Jerome Powell speaks at 11 am & Chair Powell & Lisa Cook speak to local leaders in Atlanta at 2 pm.
Genesco is scheduled to report earnings on Friday.
See you back here next week!
*** I DO NOT OWN SHARES OR OPTIONS CONTRACT POSITIONS IN SPY, QQQ, IWM or DIA AT THE TIME OF PUBLISHING THIS ARTICLE ***