SPY, the SPDR S&P 500 ETF advanced +2.31% over the past week, faring second best to the small cap Russell 2000 index.
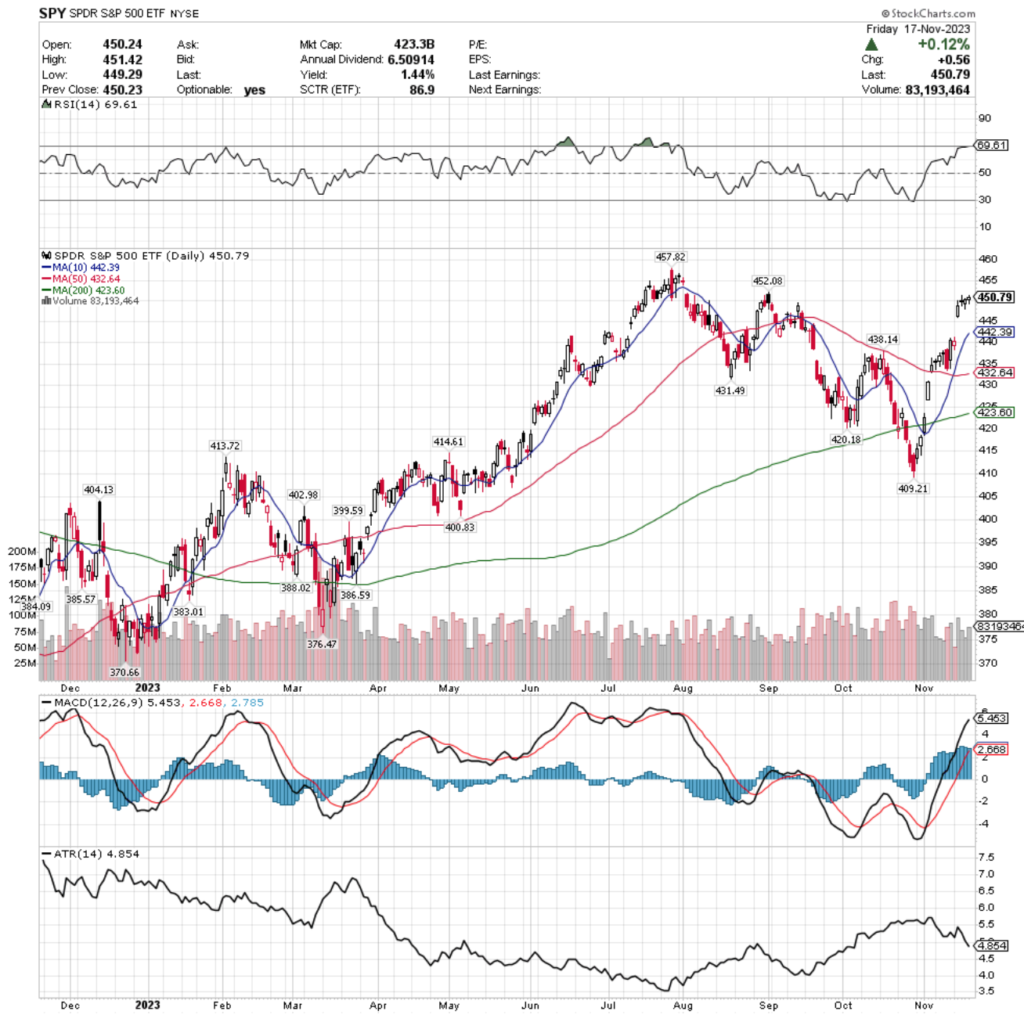
Their RSI is trending towards overbought conditions & sits at 69.61, while their MACD is currently bullish, but beginning to show signs of being over-extended & wearing out.
Volumes were -5.72% below average compared to the year prior (77,666,967 vs. 82,383,130), adding skepticism to last Tuesday’s gap up session that has led to the most recent price range it trades in.
Monday the week kicked off on a slightly negative note, resulting in a spinning top candlestick, a clear sign of indecision which was further confirmed by the low volume of the day’s session.
Tuesday’s gap up was the highest volume session of the week, but the price action was mostly consolidated to the lower range of the day’s candlestick, signaling that the tall upper shadow did not have much strength.
Wednesday’s session resulted in a doji, as investors didn’t know what to think & mostly sat still, while Thursday showed market participants were slightly inclined to take more risk, but the day’s session remained tightly range-bound.
Friday capped the week off with a spinning top, that if it did not have an upper shadow would have been a hanging man, giving a downbeat sentiment moving into a new week, but the price inched higher.
Tuesday’s gap will be a key area to keep an eye on in the coming days, as only the 10 day moving average is currently in a position of support within the window, with the next highest level of support being below it at $438.14.
Their Average True Range does not indicate that last week’s new range is particularly strong & should be watched carefully over the coming week, particularly if the resistance of the $452.08/share price level holds up & prices are unable to break through.
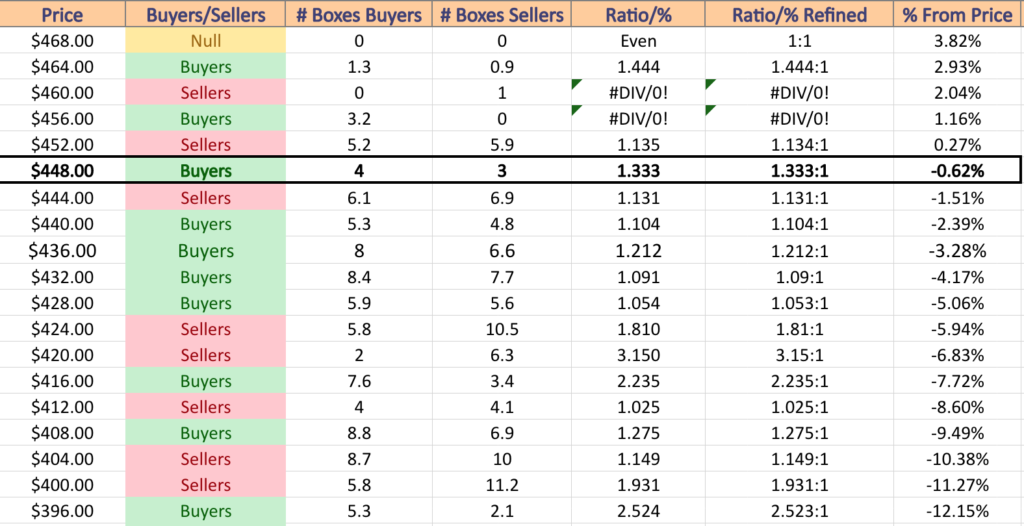
SPY has support at the $442.39 (10 Day Moving Average; Volume Sentiment: Buyers, 1.1:1), $438.14 (Volume Sentiment: Buyers, 1.21:1), $432.64 (50 Day Moving Average; Volume Sentiment: Buyers, 1.09:1) & $431.49/share (Volume Sentiment: Buyers, 1.05:1) price level, with resistance at the $452.08 (Volume Sentiment: Sellers, 1.13:1) & $457.82/share (52-Week High; Volume Sentiment: Buyers, 3.2:0*) price levels.
QQQ, the Invesco QQQ Trust ETF gained +2.02% last week, as market participants were least fond of the tech heavy index compared to the other major indexes.
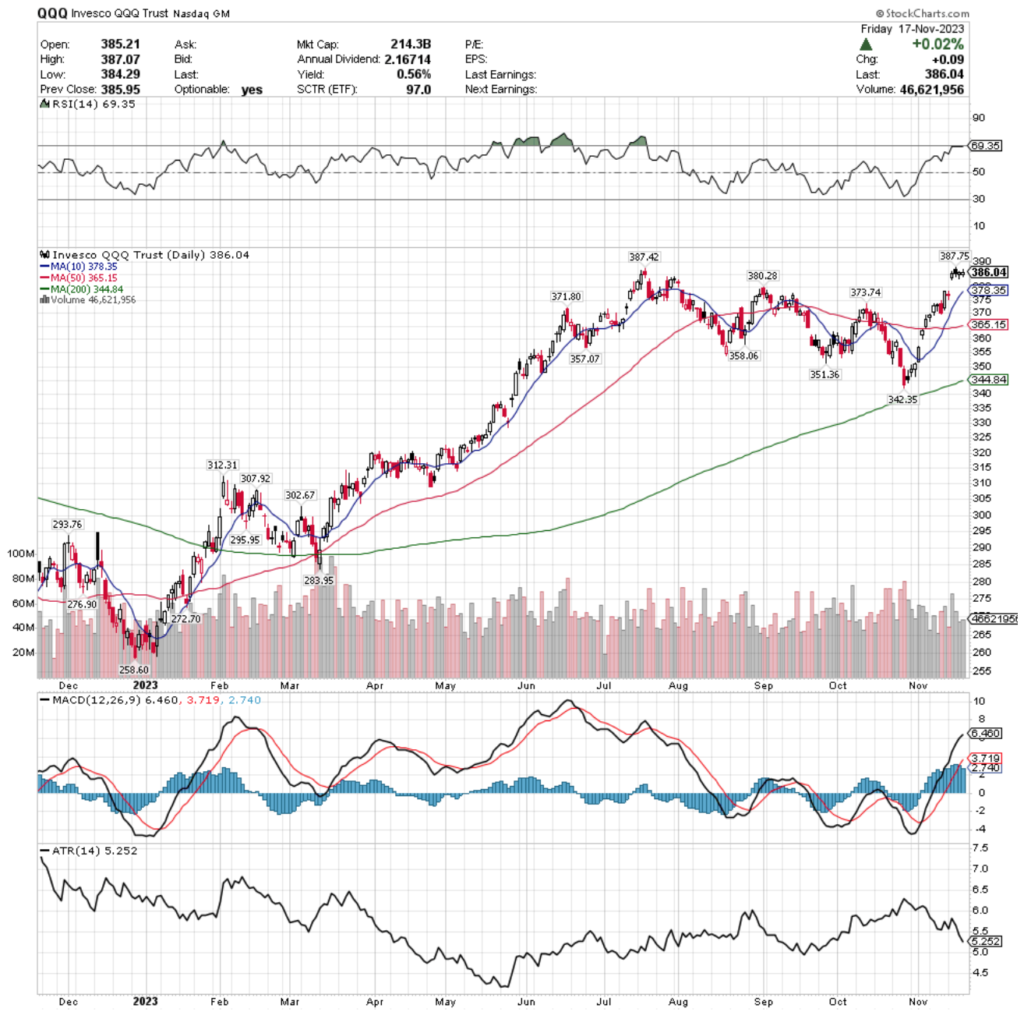
Their RSI is trending towards overbought levels at 69.35, with their MACD still bullish but beginning to show signals of exhaustion & the top is curling over.
Volumes were -1.75% below average last week compared to the year prior (52,148,783 vs. 53,078,624), and a new 52-week high was hit, but the sentiment does not overly bullish currently, as all of the prices post-Tuesday’s gap up session are rangebound.
Monday kicked off the week on a downward note, however the candle was a doji, signaling that market participants did not have a clue as to whether they wanted to assume more risk or not.
Tuesday’s reaction to CPI data was a gap up, but most of the week’s sessions resulted in spinning tops, indicating that there is still a great deal of uncertainty & indecision in the marketplace.
Wednesday’s session set a new 52-week high, however prices were scared into closing the day lower than they opened, despite the day ending green.
Volumes continued to decline, Thursday as prices stuck around the range established on Tuesday by the gap up, but all eyes will be on whether or not that window begins to close this week, as the 52-week high did not encourage market participants to come out in droves & force the NASDAQ higher.
Their ATR also suggests that this price level may be short-lived & that there is not much strength propping price levels up currently.
There is ~2% between the current price & the next support level, which happens to sit below Tuesday’s window as well.
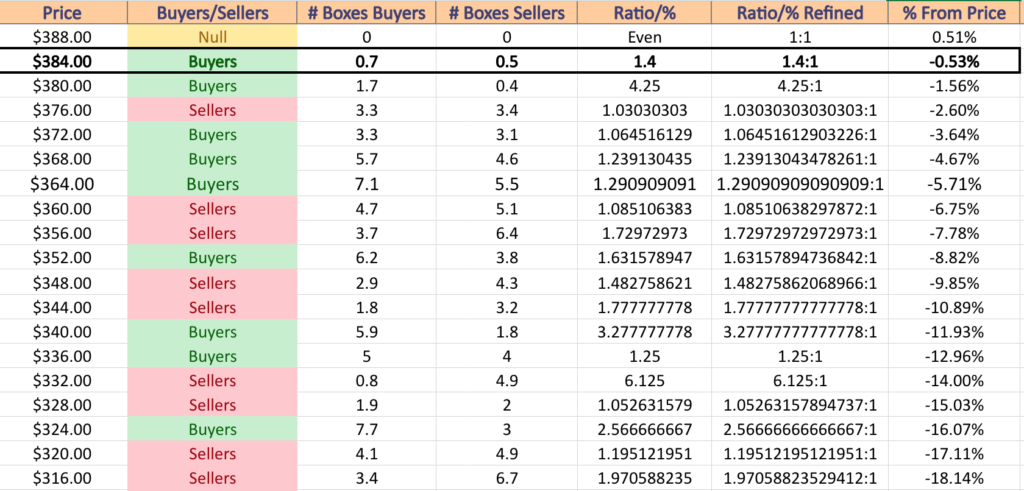
QQQ has support at the $380.28 (10 Day Moving Average; Volume Sentiment: Buyers, 4.25:1), $378.35 (10 Day Moving Average; Volume Sentiment: Sellers, 1.03:1), $373.74 (50 Day Moving Average; Volume Sentiment: Buyers, 1.07:1) & $371.80/share (Volume Sentiment: Buyers, 1.24:1) price level, with resistance at the $387.42 (Volume Sentiment: Buyers, 1.4:1) & $387.75/share (52-Week High; Volume Sentiment: Buyers, 1.4:1) price levels.
IWM, the iShares Russell 2000 ETF jumped +5.43% last week after months of steady decline, mostly attributed to a gap up session on Tuesday.
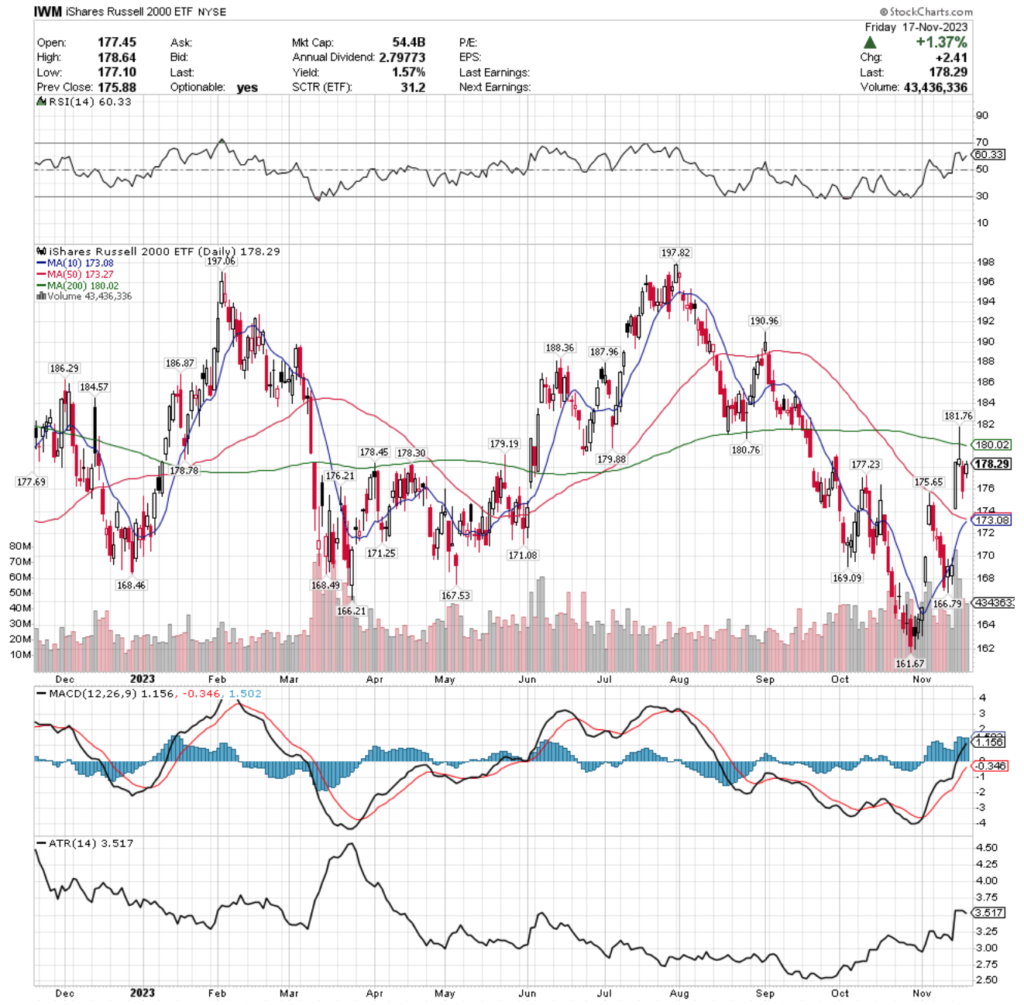
Their RSI is trending towards overbought & sits at 60.33, while their MACD is showing signals of being overextended following Tuesday’s gap up session.
Volumes were +63.92% above average compared to the year prior (48,503,233 vs. 29,588,731) as market participants jumped back in on Tuesday following the CPI print in a session that eclipsed the sessions of the past 52-weeks.
Monday was a slightly bullish session that stayed neck & neck with Friday prior’s range.
Tuesday created a gap window that jumped almost above the top of the previous price range on the open & proceeded higher.
Wednesday’s candle resulted in a shooting star after rallying higher & temporarily breaking the resistance of the 200 day moving average before closing at the lower end of the day’s range, well below the 200 DMA.
Thursday saw some profit taking following the two high volume sessions with Friday’s candle sticking by the top of Thursday’s trading range, as market participants became unclear as to how strong the recent moves will hold up.
Their ATR is suggesting some consolidation into Tuesday’s window is on the near-term horizon, which will be where we see the strength of the support of their 10 & 50 day moving averages, both of which are currently sitting towards the upper end of the window.
IWM has more support in their price window than the previously mentioned indexes, mostly due to their more range-bound behavior & lack of runaway rallies.
Their current price is now ~10% above their 52-week low, making it especially interesting to keep an eye on their current support levels & how strong they are.
The $178.30 resistance level is also another place to keep an eye on, with Friday’s price action failing to close above it.
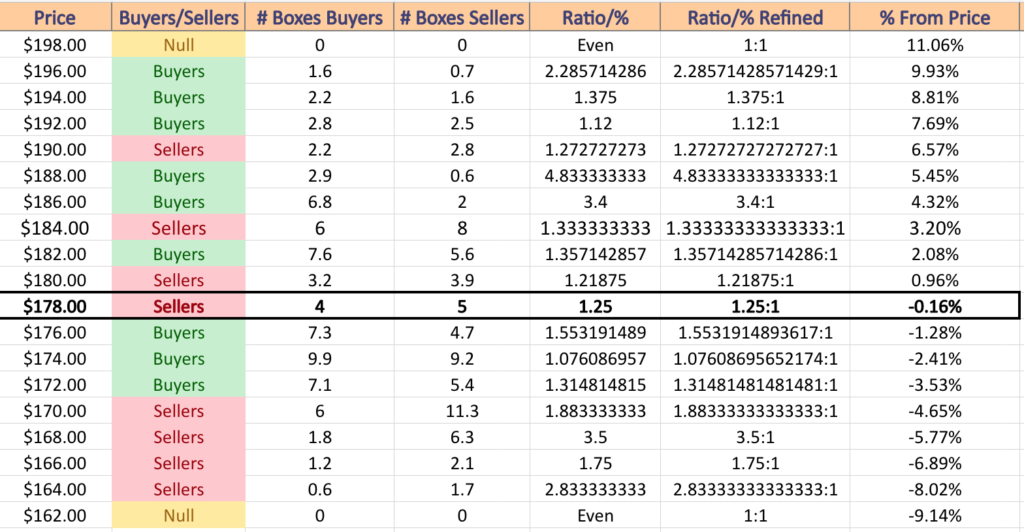
IWM has support at the $177.69 (10 Day Moving Average; Volume Sentiment: Buyers, 1.55:1), $177.23 (Volume Sentiment: Buyers, 1.55:1), $176.21 (50 Day Moving Average; Volume Sentiment: Buyers, 1.55:1) & $175.65/share (Volume Sentiment: Buyers, 1.08:1) price level, with resistance at the $178.30 (Volume Sentiment: Sellers, 1.25:1) & $178.45 (Volume Sentiment: Sellers, 1.25:1), $178.78 (Volume Sentiment: Sellers, 1.25:1) & $179.19/share (Volume Sentiment: Sellers, 1.25:1) price levels.
DIA, the SPDR Dow Jones Industrial Average ETF added +2.08% over the past week, outperforming only the NASDAQ in terms of major indexes.
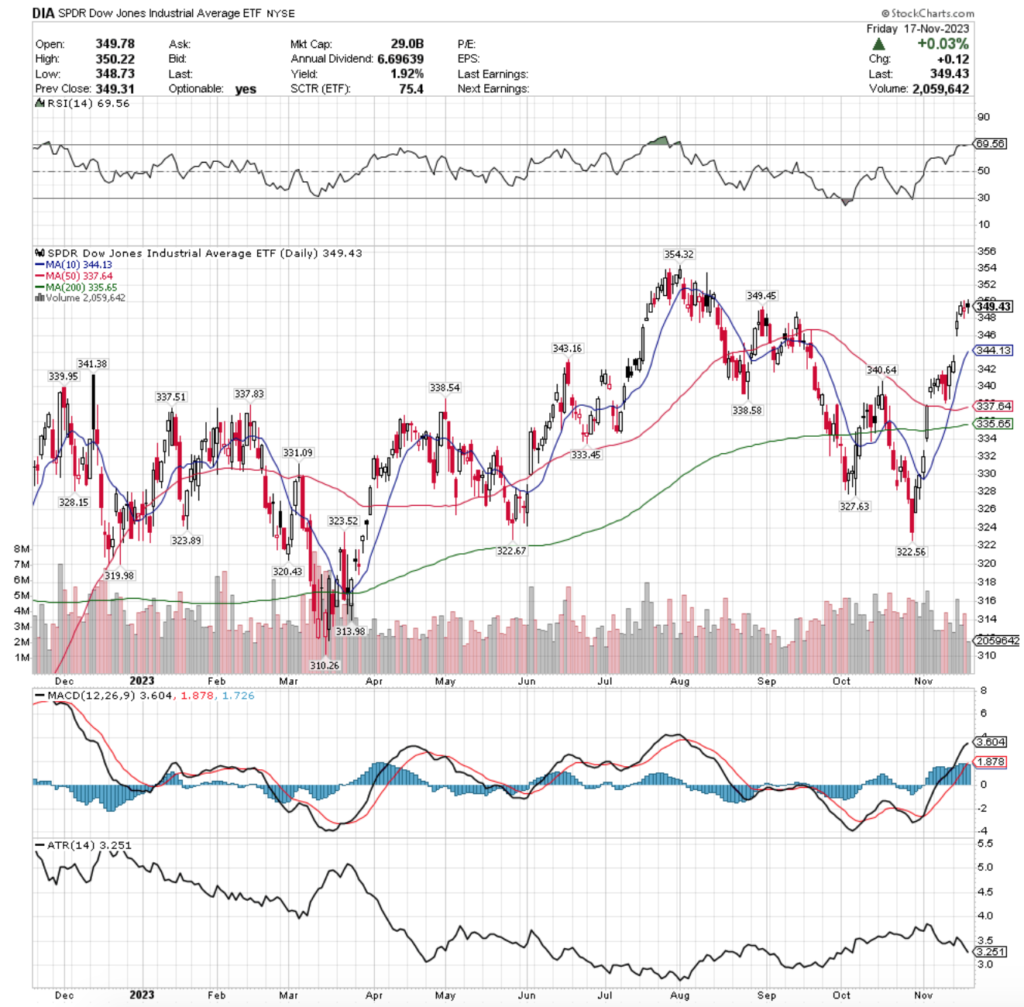
Their RSI is pushing into overbought territory at 69.56 & their MACD is still bullish, but beginning to show signs of weakening.
Volumes were -6.72% below average compared to the year prior (3,294,200 vs. 3,531,437) as investors were content for the most part, with exception to Tuesday’s higher than average volume session.
Much like IWM, DIA’s window that was created Tuesday has more support touch-points within the window than SPY or QQQ.
Friday’s spinning top that closed lower than it opened is cause for concern & something that investors will want to keep in mind stepping into the new week.
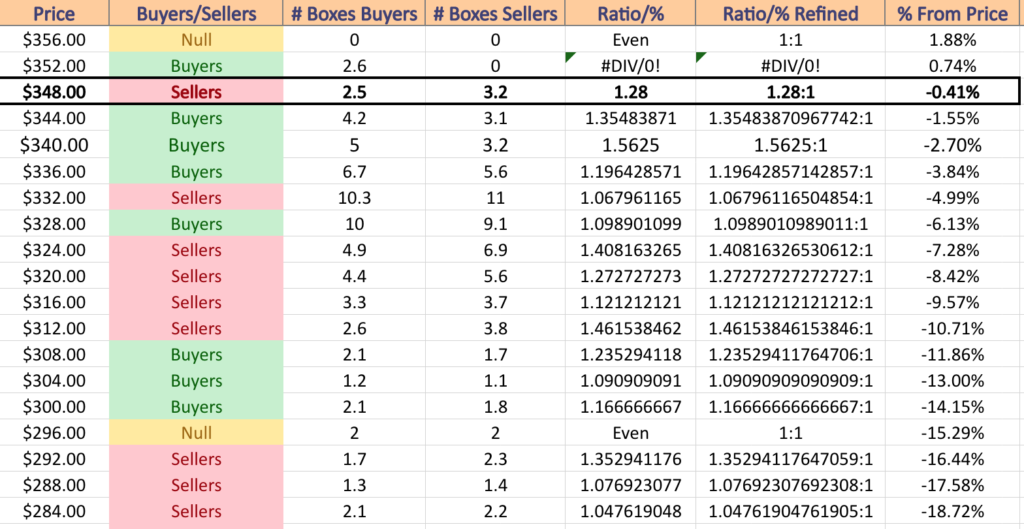
DIA has support at the $344.13 (10 Day Moving Average; Volume Sentiment: Buyers, 1.36:1), $343.16 (Volume Sentiment: Buyers, 1.56:1), $340.64 (50 Day Moving Average; Volume Sentiment: Buyers, 1.56:1) & $338.58/share (Volume Sentiment: Buyers, 1.2:1) price level, with resistance at the $349.45 (Volume Sentiment: Sellers, 1.28:1) & $354.32/share (52-Week High; Volume Sentiment: Buyers, 2.6:0*) price levels.
The Week Ahead
U.S. Leading Economic Indicators are released Monday at 10 am, followed by Richmond Fed President Tom Barkin making a TV appearance at 12 pm.
Monday’s earnings calls include Agilent, BellRing Brands, Keysight Technologies & Zoom Video Communications.
Existing Home Sales data is announced at 10 am Tuesday, with the Fed’s October 31-November 1st FOMC meeting minutes released at 2pm.
On Tuesday Abercrombie & Fitch, NVIDIA, Analog Devices, Autodesk, Baidu, Best Buy, Burlington Stores, Caleres, Dick’s Sporting Goods, Dycom, Guess?, Hibbett, HP, Jack In The Box, Jacobs Engineering, Kohl’s, Lowe’s, Medtronic, Nordstrom & Urban Outfitters are due to report earnings.
Wednesday kicks off with Initial Jobless Claims, Durable-goods Orders & Durable Goods-minus Transportation data at 8:30 am, followed by Consumer Sentiment (final) at 10 am.
Deere is scheduled to report earnings on Wednesday.
There are no major data announcements Thursday, as it is Thanksgiving.
Thursday (Thanksgiving) features earnings calls from Canadian banks Royal Bank of Canada & Toronto-Dominion Bank.
Friday has no noteworthy earnings reports scheduled & S&P Flash U.S. Services PMI & S&P Flash U.S. Manufacturing PMI data being released at 9:45 am.
See you back here next week!
*** I DO NOT OWN SHARES OR OPTIONS CONTRACT POSITIONS IN SPY, QQQ, IWM or DIA AT THE TIME OF PUBLISHING THIS ARTICLE ***