SPY, the SPDR S&P 500 ETF gained +0.83% last week, as investors favored the Russell 2000 small caps & Dow Jones Industrial Average.
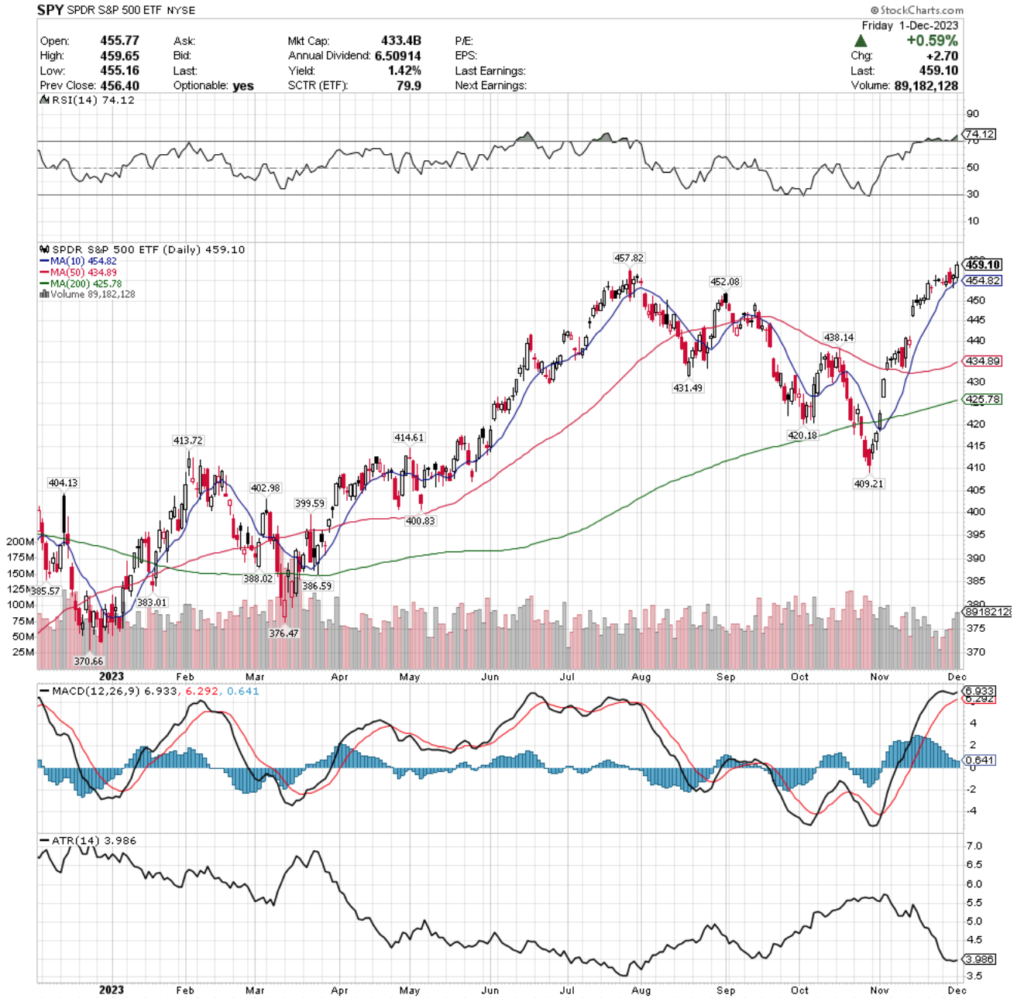
Their RSI is overbought at 74.12, with a MACD that is still bullish, but hanging on for life & trying to advance into more overbought territory, but looks set to roll over bearishly in the coming days.
Volumes were -23.93% below average last week compared to the year prior (62,392,500 vs. 82,018,080), with Thursday & Friday being the highest volume days of the week & Friday’s volume levels did not surpass last week’s high of volume, showing hesitancy on the part of market participants.
While volumes advanced day-over-day throughout the week, this is a signal of uncertainty, despite the recent 52-week high & not to be viewed as increasing confidence during the week.
Monday the week kicked off with a declining session with a doji candle, kicking the week off on the theme of caution.
Tuesday’s spinning top candle’s real body was concentrated in the lower range of the over candle, signaling that downside movement was imminent & that there was reluctance to edge higher.
Wednesday showed signs of optimism, with the open being above the day prior’s close & an upper shadow that tried to break higher, but profits were taken throughout the day’s session, pushing the prices lower until the day closed out lower than Tuesday’s session & with a slight lower shadow dipping into Tuesday’s candle’s real body.
Another sign of uncertainty emerged on Thursday, where the session opened higher than the day prior’s close, tested lower & dipped beneath the 10 day moving average’s support, but ultimately recovered as investors piled in & resulted in a spinning top with the real body of the candle concentrated on the high end of the day’s session, with a small upper shadow.
Friday resembled a last minute specialist breakout to the upside, testing the lower range of the candle’s shadow against the support of the 10 day moving average which held strong, but the upper shadow above the bullish close was roughly the same size as the lower shadow, which is not indicative of strength & signals further cautious outlook on the part of market participants.
Their Average True Range does not indicate a strong trend is in place, but has begun to flatten out after a half month of decline, signaling that we are likely to see a pivotal moment in the coming week; whether the new trend is up or down.
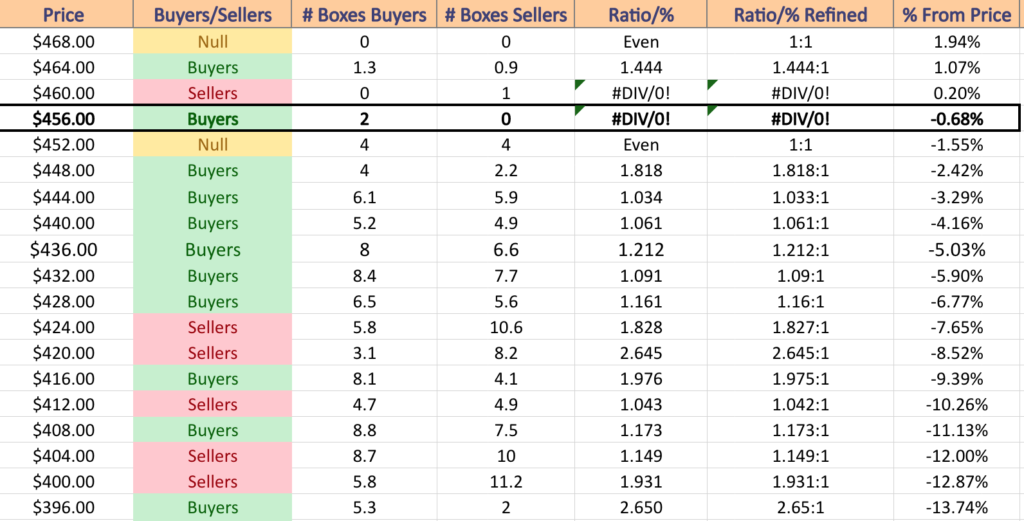
SPY has support at the $457.82 (Volume Sentiment: Buyers, 2:0*), $454.82 (10 Day Moving Average; Volume Sentiment: Even, 1:1), $452.08 (Volume Sentiment: Even, 1:1) & $438.14/share (Volume Sentiment: Buyers, 1.21:1) price levels, with no resistance levels in the past year as the price is currently at a new 52-week high (Volume Sentiment: NULL, 0:0*).
QQQ, the Invesco QQQ Trust ETF has the weakest week of the major indexes, nudging forward +0.11%, basically treading water.
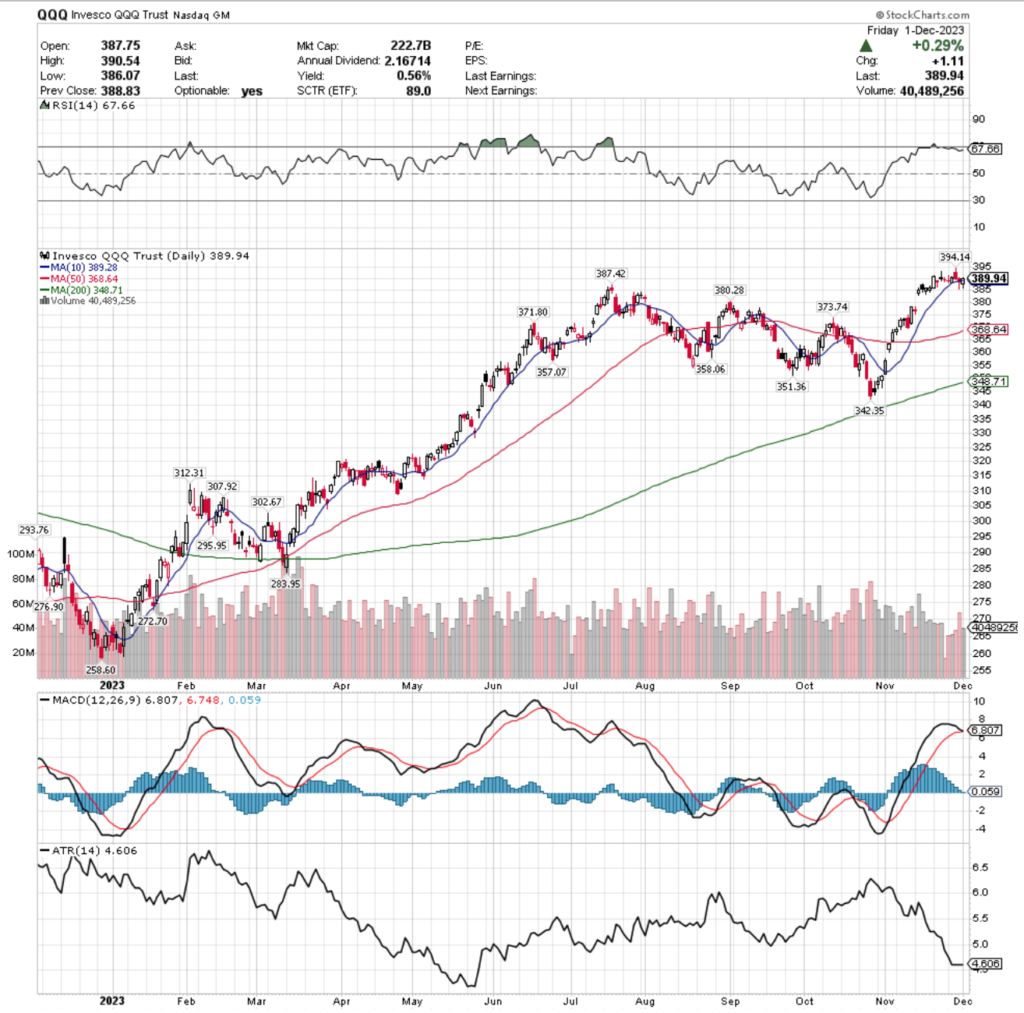
Their RSI is currently just underneath the overbought level & sits at 67.66, while their MACD is primed to cross over bearishly & looks set to continue downwards into more bearish territory into the coming week.
Volumes were -33.47% below average last week compared to the year prior (36,239,367 vs. 52,884,565), which is a cause for concern given that Thursday’s declining session was the highest volume day of the week.
Friday’s advancing volume was the second highest day of the week in terms of volume, however it was narrowly higher than the declining volume of Wednesday’s session & neither broke above any of last week’s sessions’ volumes.
This signals that there is a skeptical outlook on the NASDAQ currently, which matches the narrative of the MACD, painting a picture of brief consolidation on the horizon at best in the near-term.
There also looks to be a potential bearish head & shoulders formation forming, showing five & a half months of build up, which will be something to keep an eye on heading into Q2-3 2024.
Their Average True Range is also flat, like SPY’s, signaling that there will likely be some movement to establish a new, stronger trend that begins this week, with QQQ’s looking strongly to the downside.
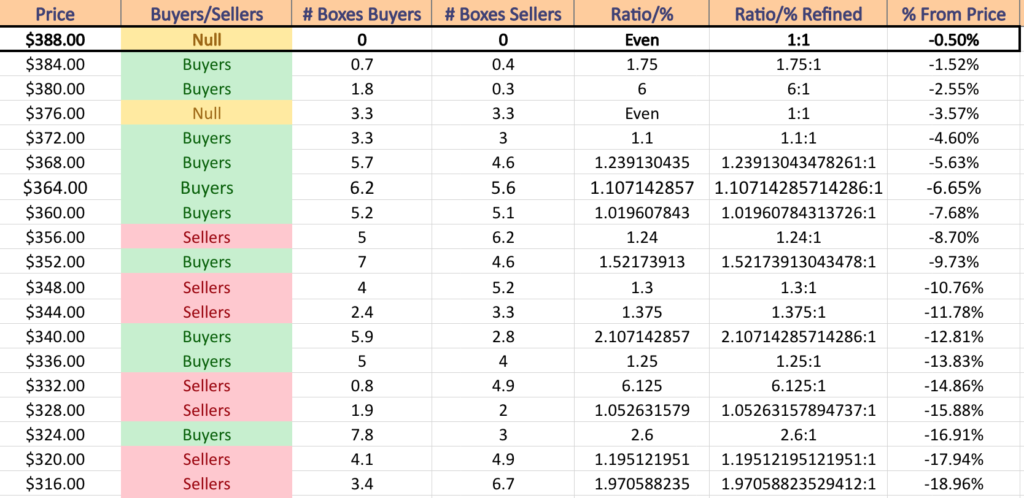
There is strong Buyers sentiment currently supporting QQQ, however, it should be noted that sentiment readings are always stronger at the extremes such as a 52-week high or low, as there has been limited price action at said levels.
There is currently -7.68% of cushion for QQQ’s share price before it reaches a seller dominated price level, with exception to the $376-379.99/share price box, which is currently 1:1 Buyers:Sellers.
QQQ has support at the $389.28 (10 Day Moving Average; Volume Sentiment: NULL, 0:0*), $387.42 (Volume Sentiment: Buyers, 1.75:1), $380.28 (Volume Sentiment: Buyers, 6:1) & $373.74/share (Volume Sentiment: Buyers, 1.1:1) price levels, with resistance only at the $394.14/share (Volume Sentiment: NULL, 0:0*) price level, as they are currently declining from their new 52-week high set last Thursday.
IWM, the iShares Russell 2000 ETF had the strongest week of the major indexes, advancing +3.11%, with Friday’s candle nearly jumping out of its shoes in terms of daily price range & closing well above the golden cross that was being created by the 10 & 200 day moving averages that day.
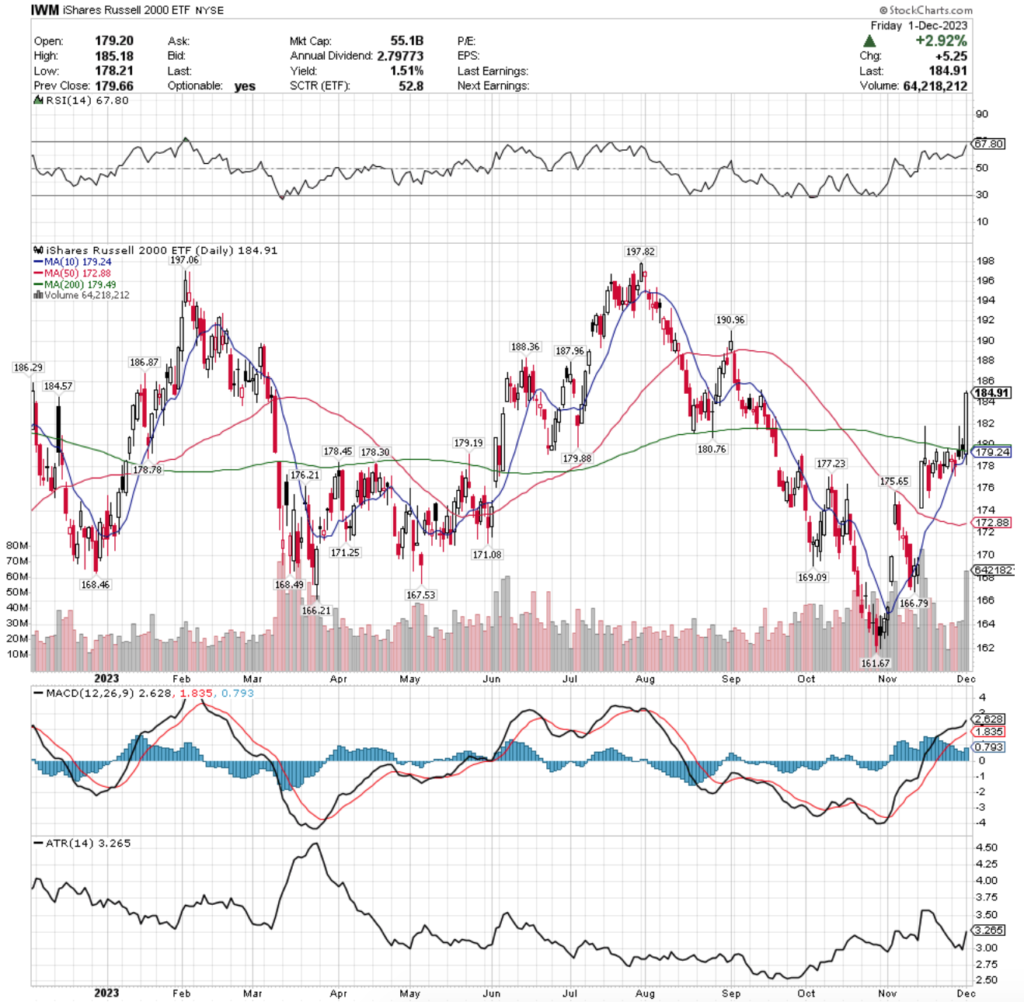
Their RSI is trending aggressively towards overbought after Friday’s wide range session & currently sits at 67.8, while their MACD is continuing higher due to Friday’s session after looking like it was set to lose steam & roll over bearishly last week.
Volumes were +11.49% above average compared to the year prior last week (33,473,717 vs. 30,023,244), but it should be noted that this is mostly on account of Friday’s session, whose volume eclipsed the volumes of the rest of the week & all but 4 sessions’ volumes throughout the year prior.
This does not necessarily indicate that there is strength in the move, and could likely have been market participants pivoting into small caps now before”the January effect” lifts small caps higher in the first half of next month.
Looking at how even the volumes of the early week declining days & then Wednesday & Thursday’s volumes also does not tell a story of strength & should be met with skepticism.
Monday’s session kicked the week off on an uncertain note for small cap names, with a slightly bearish day resulting in a spinning top candle.
Tuesday followed suit, although there was a much wider range on the candle’s real body, but the 10 day moving average was able to hold support & keep the declines from going too low.
Wednesday saw the power of the 200 day moving average’s resistance, as prices briefly fluctuated above it & tested higher for a bit, but the candle’s real body opened & closed below the 200 DMA.
It is also worth noting that they closed lower than they opened, despite finishing the day bullishly, which should be taken as a bearish situation.
Thursday’s candle was also a filled in black candle & a spinning top, that despite opening & closing above the support of the 200 DMA did not signal much confidence was in the air.
Friday was a very wide range day that exposed a few interesting bits of information from the market.
The day opened somewhere between the 10 DMA’s support & 200 DMA’s resistance & ultimately closed +2.92% higher for the day, however, the lower shadow of the day’s candle should be noted, as there was a bit of test to the downside that shouldn’t be ignored.
Their ATR is signaling that there is a stronger trend in play now after November did feature a steady advance, however the volatility of Friday’s session that has been added into the calculation does distort the otherwise slow advances of the month prior to appear like a stronger trend is in play than really is.
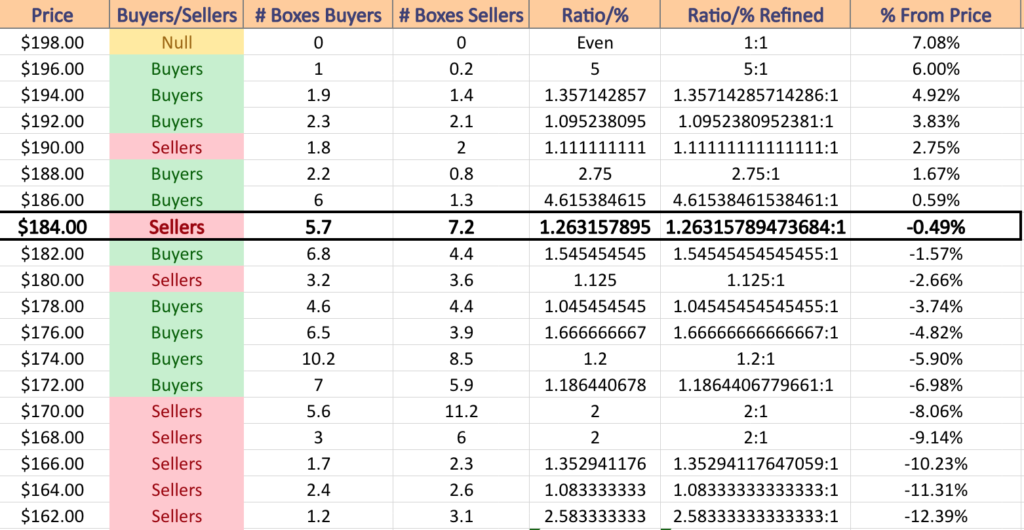
Prices are still in a seller dominated price level 1.26:1 & while there are buyers historically at a rate of 1.55:1 in the $182-183.99/share zone, the sellers resume control again until a ~3% drop in price.
The next 4 price zones are buyers dominated, before sellers lead the way back down to the 52-week low, which was hit in October.
It is worth noting that just as mentioned regarding stocks at/near their 52-week high, the volume readings are more extreme to one side or another when we reach price extremes, due to the lack of time spent in these price ranges.
IWM has support at the $184.57 (Volume Sentiment: Sellers, 1.26:1), $180.76 (Volume Sentiment: Sellers, 1.13:1), $179.88 (Volume Sentiment: Buyers, 1.05:1) & $179.49/share (200 Day Moving Average; Volume Sentiment: Buyers, 1.05:1) price levels, with resistance at the $186.29 (Volume Sentiment: Buyers, 4.62:1), $186.87 (Volume Sentiment: Buyers, 4.62:1), $187.96 (Volume Sentiment: Buyers, 4.62:1) & $188.38/share (Volume Sentiment: Buyers, 2.75:1) price levels.
DIA, the SPDR Dow Jones Industrial Average ETF ended the week second best of the major indexes, +2.61%, trailing on the Russell 2000, but still managing to close the week on a new 52-week high.
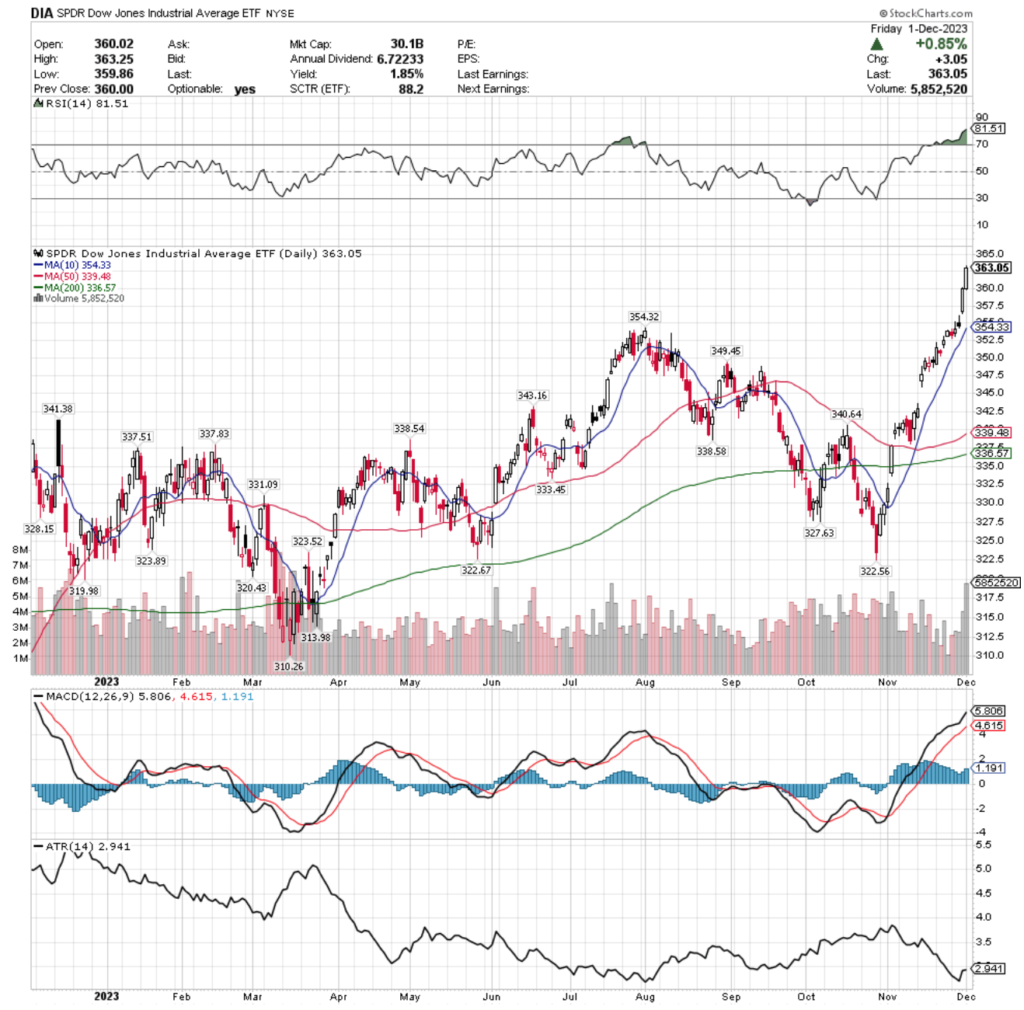
Their RSI is heavily overbought at 81.51, with a MACD that is still bullish, but looks to be beginning to lose steam & become ready to roll over for a bearish crossover in the coming sessions.
Volumes were -8.7% below average last week compared to the year prior (3,203,100 vs. 3,508,327), signaling a lack of enthusiasm & calling question to the strength of the gains that were achieved on Thursday & Friday.
Monday the week started off on unstable footing, resulting in a declining session with a spinning top candle, marking uncertainty among market participants.
Tuesday was another spinning top session, that despite nudging up to close bullishly, did not paint a picture of good things to come as the candle’s real body was concentrated on the lower end of the candle.
Wednesday the uncertainty continued, with prices closing lower than they opened, despite the day being bullish, which continued the story of caution, especially given how low the volumes were during the first three sessions of the week.
This lead up to the largely bullish days at the end of the week should’ve raised eyebrows of skepticism, particularly the gap up on Thursday that occurred on relatively average volumes.
Friday’s move higher should also be viewed with a critical eye, as while it did set a new 52-week high on strong volume, it stretched out oscillators such as the RSI to their highest overbought reading of the year.
Volume was strong (top 10 days by volume of the year), but this should be viewed as a last chance piling in for profits, which will be interesting to see the strength of in the coming week.
Another thing to keep an eye on this week will be the strength of support provided by the 10 day moving average, which is currently the closest support level to their price.
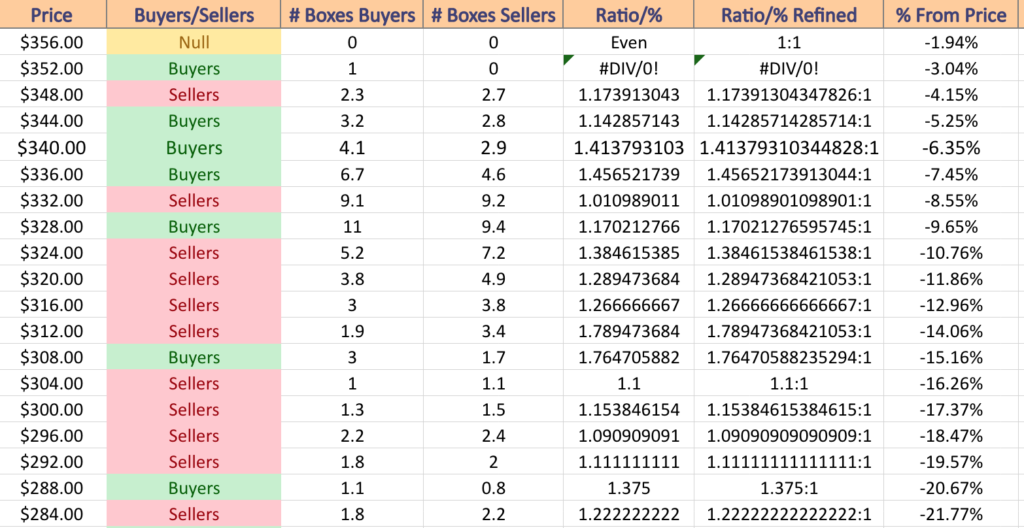
Given that we are at a price extreme the volume sentiment levels are don’t paint much of a picture as to what the strength of this support level will be, as the current ratio for the $352-355.99/share box is 1:0*.
Their Average True Range was indicating a more steady trend in November after the steady ascent from the mid-month gap up, but the violent movement of the last two days has disrupted that & now their ATR is looking flat, much like SPY & QQQ’s, indicating that a reversal in trend, possibly violent, is on the horizon.
They have enjoyed strength for the last couple of months, but if there is a proper correction there will be cause for concern, as after a -9.65% decline the next -5%+ is all seller dominated, minus the $308-311.99/share zone which historically has 1.76:1 Buyers:Sellers & the $288-291.99/share price zone, which has 1.38:1 Buyers:Sellers.
DIA has support at the $354.33 (10 Day Moving Average; Volume Sentiment: Buyers, 1:0*), $354.32 (Volume Sentiment: Buyers, 1:0*), $349.45 (Volume Sentiment: Sellers, 1.17:1) & $343.16/share (Volume Sentiment: Buyers, 1.42:1) price levels, with no resistance levels as Friday’s session marked a new 52-week high for DIA (Volume Sentiment: NULL, 0:0*).
The Week Ahead
Monday’s earnings reports include GitLab & Science Applications.
Factory Orders data is reported on Monday at 10 am.
AutoZone, AeroVironment, America’s Car-Mart, Asana, Box, Core & Main, Dave & Buster’s, Ferguson, G-III Apparel, MongoDB, Phreesia, SentinelOne, Signet Jewelers, Stitch Fix, Toll Brothers & Yext are all scheduled to report earnings on Tuesday.
Tuesday features S&P U.S. Services PMI data at 9:45 am, as well as ISM Services data & Job Openings data at 10 am.
Wednesday’s earnings reports feature Brown-Forman, C3.ai, Campbell Soup, ChargePoint, Chewy, Descartes, GameStop, Greif, Ollie’s Bargain Outlet, Oxford Industries, Semtech, Sportsman’s Warehouse, Thor Industries, United Natural Foods, Veeva Systems & Verint Systems.
ADP Employment data comes in Wednesday at 8:15 am, followed by U.S. Productivity (revision) & U.S. Trade Deficit data at 8:30 am.
Thursday’s earnings calls include Broadcom, Lululemon Athletica, BRP, Ciena, Cooper, DocuSign, Dollar General, GMS, Smith & Wesson Brands & Vail Resorts.
Initial Jobless Claims reports are released Thursday at 8:30 am, with Wholesale Inventories data at 10 am & Consumer Credit data at 3pm.
Hello Group is scheduled to report earnings on Friday.
U.S. Employment Report, U.S. Unemployment Rate, U.S. Hourly Wages & U.S. Hourly Wages Y-o-Y data are released at 8:30 am & Consumer Sentiment (prelim) data comes out at 10 am Friday
See you back here next week!