Broadcom Inc. stock has had a fantastic 2023, rising +111.83% (ex-dividends) from their 52-week low in October of 2022.
Much like other semiconductor industry peers, their price trend has been a very stable trajectory over the past year.
83.99% of AVGO’s outstanding share float is owned by institutional investors, and they are a major holding in many popular ETFs including SOXL (7.95% target, per their prospectus), USD (11.63%), SMH (5.4%) & many more.
The Price:Volume analysis seeks to display the volume at specific share-price levels from over the past year & is intended to serve as a reference point for how investors viewed AVGO stock’s value at each level.
It also includes a list of moving averages, as well as support & resistance levels, which will be marked in bold.
Broadcom Inc. AVGO Stock’s Price:Volume Sentiment Broken Down
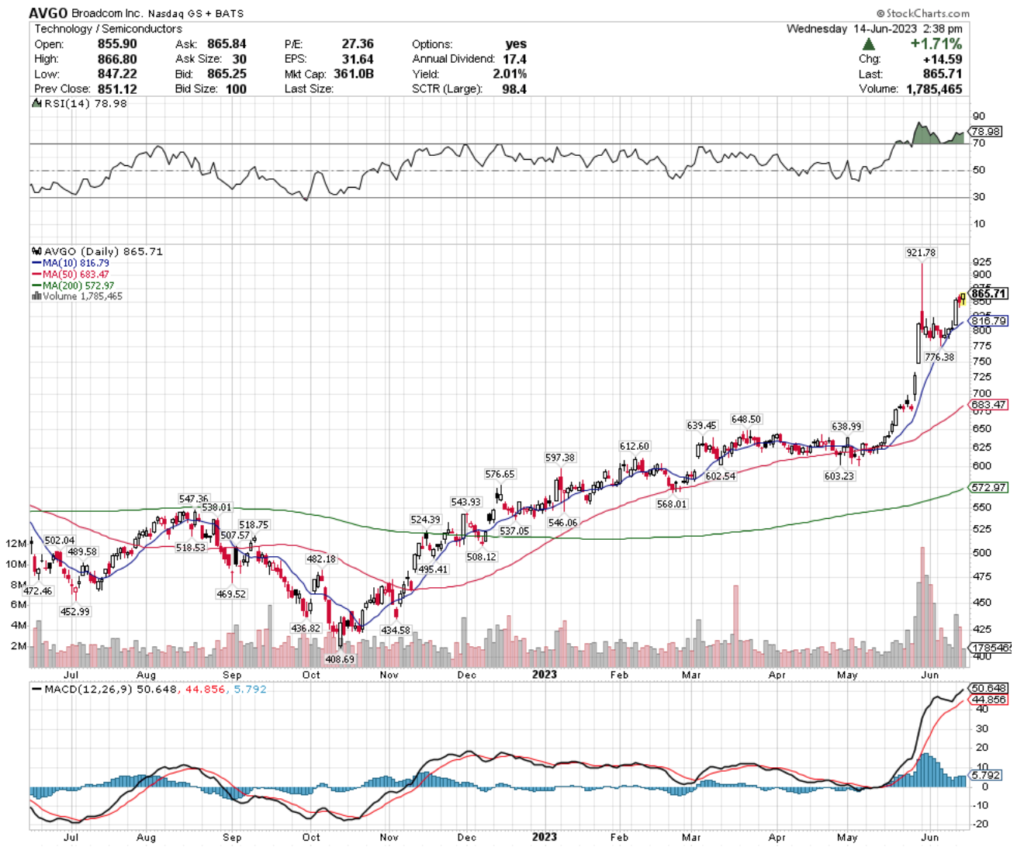
AVGO stock’s RSI is currently overbought at 78.98, with their MACD still bullishly trending upwards, as they’ve continued to climb higher after late May’s gap up session.
While the past week’s volumes have subsided a bit, the past month has seen above average volume compared to the year prior, signaling enthusiasm among investors & traders.
AVGO stock’s 10 Day Moving Average is $816.79, their 50 Day Moving Average is $683.47 & their 200 Day Moving Average is $572.97.
The bold prices on the image below denote the moving average levels just listed & the bold entries in the list form of the analysis under the images include other levels of support (there is no data for their limited resistance levels).
Each corresponding price level using a ratio of Buyers:Sellers (or Sellers:Buyers), NULL values denote that there was not enough data, so the ratio would’ve been 0:0.
Ratios with a 0 for the denominator/constant are denoted with an *, but are reported as is, as we are accounting for volume/sentiment.
Also, as there is such a wide spread between many price levels, many of the resistance levels are marked NULL, as there was limited volume data for them & they were not included in the long list.
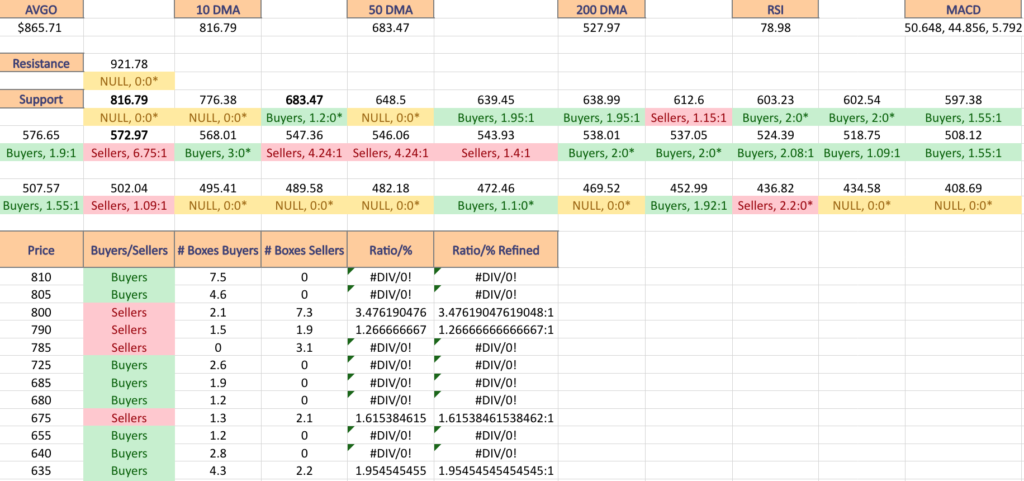
AVGO Stock’s Volume By Price Level
$810 – Buyers – 7.5:0
$805 – Buyers – 4.6:0*
$800 – Sellers – 3.48:1
$790 – Sellers – 1.27:1
$785 – Sellers – 3.1:0*
$725 – Buyers – 2.6:0*
$685 – Buyers – 1.9:0*
$680 – Buyers – 1.2:0* – 50 Day Moving Average
$675 – Sellers – 1.62:1
$655 – Buyers – 1.2:0*
$640 – Buyers – 2.8:0*
$635 – Buyers – 1.95:1
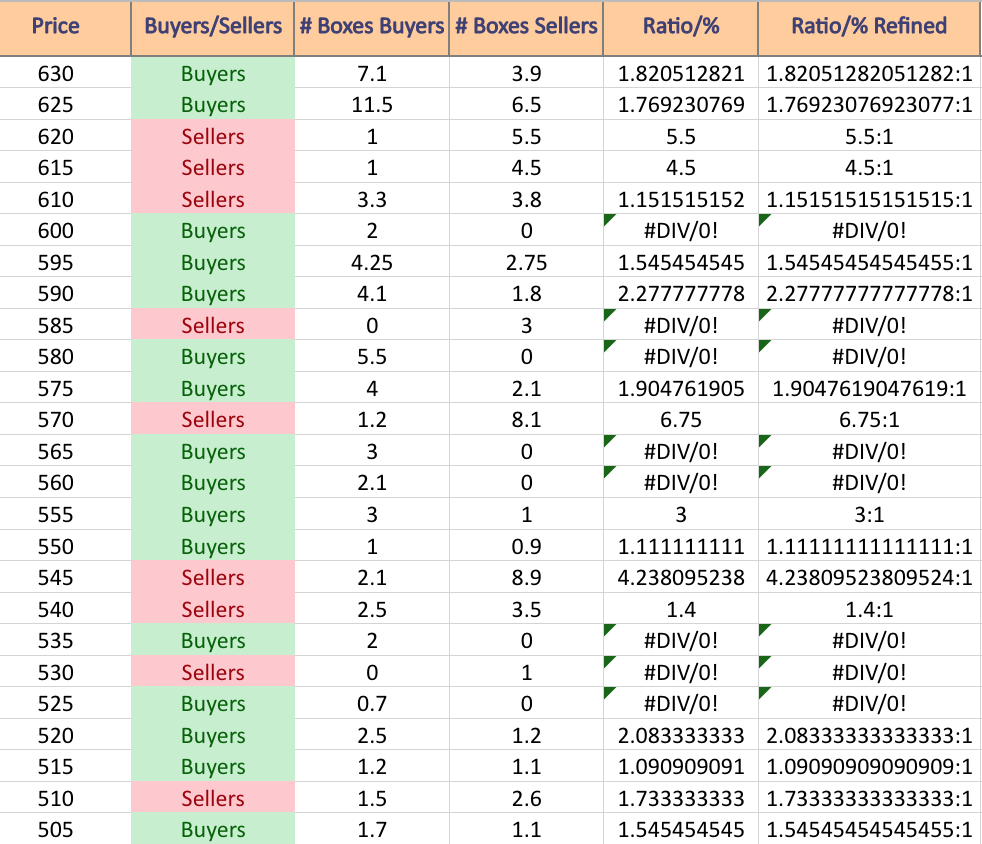
$630 – Buyers – 1.82:1
$625 – Buyers – 1.77:1
$620 – Sellers – 5.5:1
$615 – Sellers – 4.5:1
$610 – Sellers – 1.15:1
$600 – Buyers – 2:0*
$595 – Buyers – 1.55:1
$590 – Buyers – 2.28:1
$585 – Sellers – 3:0*
$580 – Buyers – 5.5:0*
$575 – Buyers – 1.90:1
$570 – Sellers – 6.75:1 – 200 Day Moving Average
$565 – Buyers – 3:0*
$560 – Buyers – 2.1:0*
$555 – Buyers – 3:1
$550 – Buyers – 1.11:1
$545 – Sellers – 4.24:1
$540 – Sellers – 1.4:1
$535 – Buyers – 2:0*
$530 – Sellers – 1:0*
$525 – Buyers – 0.7:0*
$520 – Buyers – 2.08:1
$515 – Buyers – 1.09:1
$510 – Sellers – 1.73:1
$505 – Buyers – 1.55:1
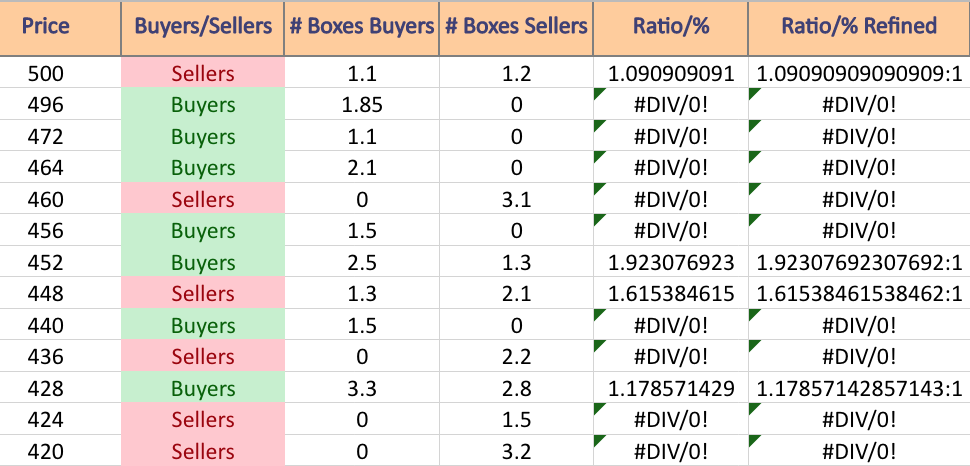
$500 – Sellers – 1.09:1
$496 – Buyers – 1.85:0*
$472 – Buyers – 1.1:0*
$464 – Buyers – 2.1:0*
$460 – Sellers – 3.1:0*
$456 – Buyers – 1.5:0*
$452 – Buyers – 1.92:1
$448 – Sellers – 1.62:1
$440 – Buyers – 1.5:0*
$436 – Sellers – 2.2:0*
$428 – Buyers – 1.18:1
$424 – Sellers – 1.5:0*
$420 – Sellers – 3.2:0*
Tying It All Together
The list & image above paint the picture as to how investors & traders have behaved at various price levels that AVGO has been at over the past one-to-two years.
It is not meant to serve as investment/trading advice, and is simply a way to visualize what investor/trader sentiment has been like at each of the price levels mentioned, as well as what it was at levels of support & resistance that are denoted in the image & list.
As always, do your own due diligence before making investing/trading decisions.
For more on the methodology on how the data was collected & put together, please refer to our original Price:Volume analysis.
*** I DO NOT OWN SHARES OR OPTIONS CONTRACT POSITIONS IN AVGO AT THE TIME OF PUBLISHING THIS ARTICLE ***