It’s no surprise that semiconductors have been leading the charge throughout 2023, as they have been one of the strongest performing areas of the market.
After publishing about SOXL in this week’s weekly market review I decided to dig a bit deeper into how well they’ve performed by doing a price:volume analysis, as they & other semiconductor ETFs have been atop my technical analysis ratings system output seemingly every week in recent memory.
Before we begin the analysis, let’s address who SOXL is.
SOXL, the Direxion Daily Semiconductor Bull 3x Shares ETF is a basket of securities (stocks, swaps, cash etc…) that aims to perform 300% better than the ICE semiconductor index.
The more popular semiconductors are in the market, the better SOXL will perform, ideally at 3x.
As more & more investors want to get exposure to the space, they can provide an easy way to profit, but also come with their own additional risk (3x gains can be counteracted by 3x losses, after-all…).
Some of their largest holdings include NVDA, TXN, AVGO & others, which you can find at the link to their prospectus three paragraphs above for more information.
Volume is a measure of investor enthusiasm (or lack thereof) & we are going to review how investor sentiment has been at various price levels, as well as pointing out what the dominant sentiment at various levels of support & resistance have been in the past year & change.
SOXL ETF’s Price:Volume Analysis Breakdown
As mentioned earlier, SOXL has had a strong year from a technical standpoint amongst other ETFs, driven by the outperformance of the underlying stocks in the industry.
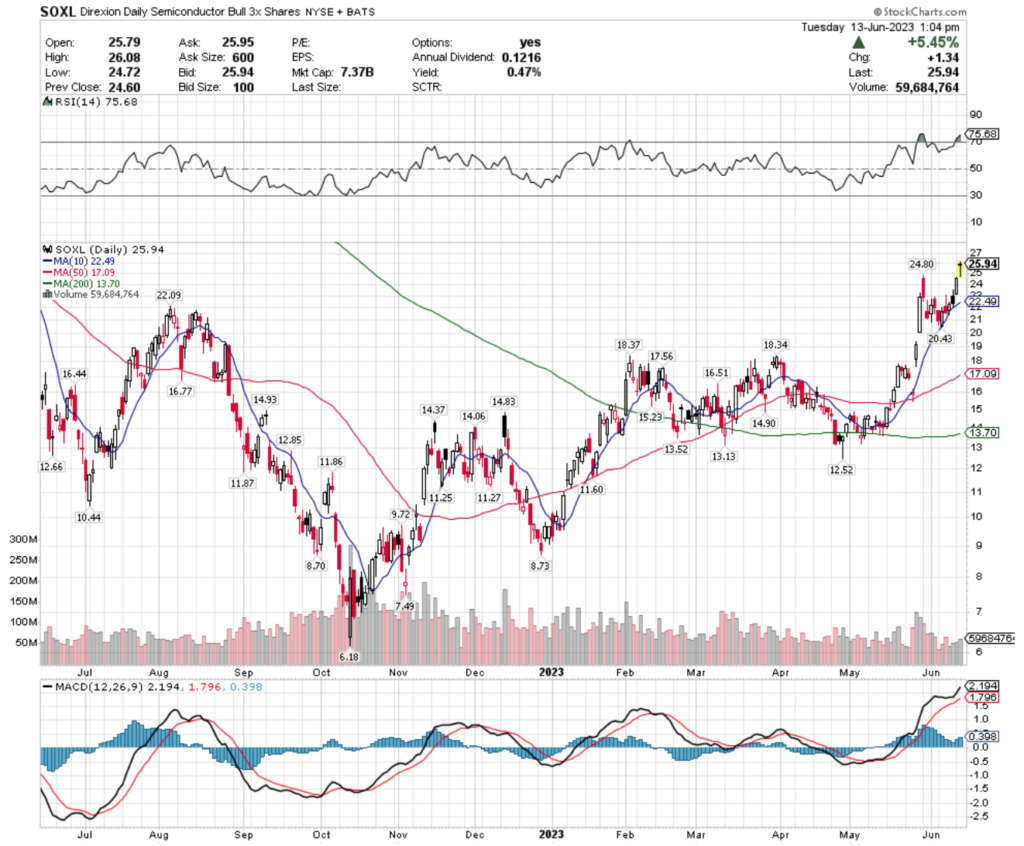
Their share price has appreciated +319.74% since their 52-week low in October of 2022 (ex-distributions & using their price from 1:04pm on 6/13/23 as denoted in the upper right hand corner of the chart).
After taking their support levels (I had to go to a 2 year chart to find resistance as they’re above their 52-week high) I constructed this list, which not surprisingly has limited/no data for the prices that are above their current share price.
Note that the prices in bold denote a moving average, which are treated as support/resistance levels themselves.
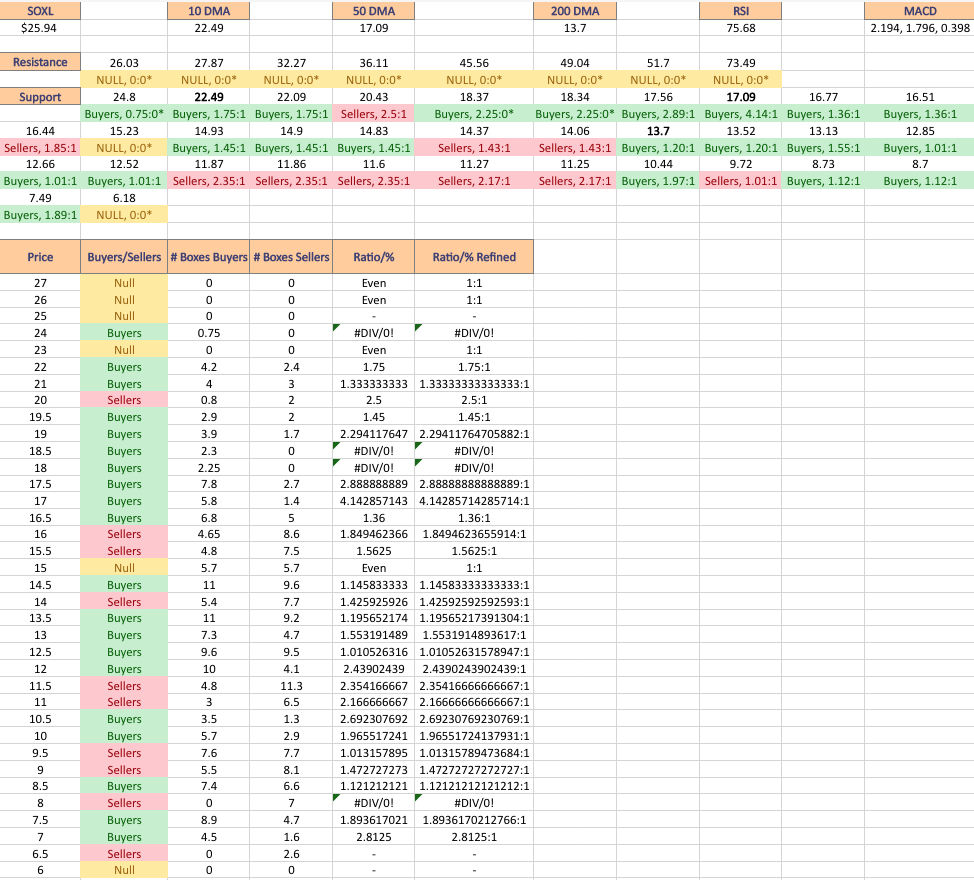
The list below maps out the volume sentiment at each corresponding price level using a ratio of Buyers:Sellers (or Sellers:Buyers), NULL values denote that there was not enough data, so the ratio would’ve been 0:0.
Ratios with a 0 for the denominator/constant are denoted with an *, but reported as is as we are accounting for volume/sentiment.
SOXL Volume By Price Level:
$27 – NULL – 0:0*
$26 – NULL – 0:0*
$25 – NULL – 0:0*
$24 – Buyers – 0.75:0*
$23 – NULL – 0:0*
$22 – Buyers – 1.75:1 (10 Day Moving Average is $22.49)
$21 – Buyers – 1.33:1
$20 – Sellers – 2.5:1
$19.50 – Buyers – 1.45:1
$19 – Buyers – 2.29:1
$18.50 – Buyers – 2.3:0*
$18 – Buyers – 2.25:0*
$17.50 – Buyers – 2.89:1
$17 – Buyers – 1.14:1 (50 Day Moving Average is $17.09)
$16.50 – Buyers – 1.36:1
$16 – Sellers – 1.85:1
$15.50 – Sellers – 1.56:1
$15 – Even – 1:1
$14.50 – Buyers – 1.46:1
$14 – Sellers – 1.43:1
$13.50 – Buyers – 1.20:1 (200 Day Moving Average)
$13 – Buyers – 1.55:1
$12.50 – Buyers – 1.01:1
$12 – Buyers – 2.44:1
$11.50 – Sellers – 2.35:1
$11 – Sellers – 2.17:1
$10.50 – Buyers – 2.69:1
$10 – Buyers – 1.97:1
$9.50 – Sellers – 1.01:1
$9 – Sellers – 1.47:1
$8.50 – Buyers – 1.12:1
$8 – Sellers – 7:0*
$7.50 – Buyers – 1.89:1
$7 – Buyers – 2.81:1
$6.50 – Sellers – 2.6:0*
$6 – NULL – 0:0*
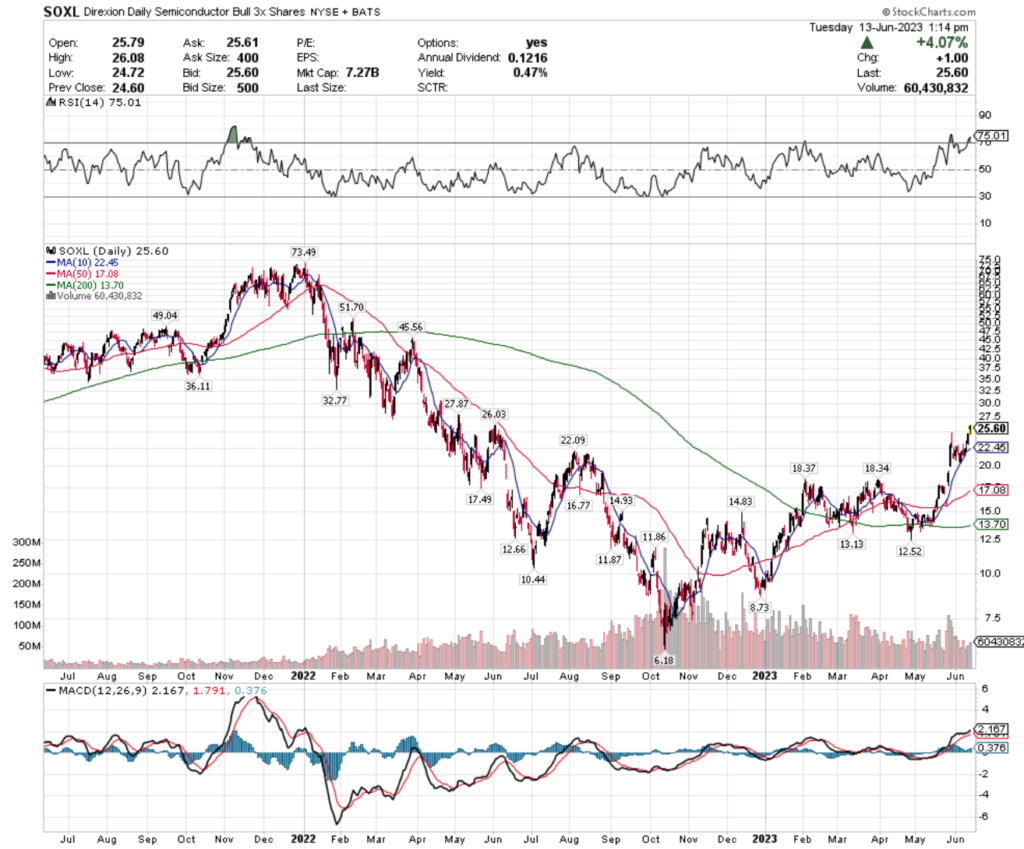
The two year chart is below:
Tying It All Together
The list & image above paint the picture as to how investors & traders have behaved at various price levels that SOXL has been at over the past one-to-two years.
It is not meant to serve as investment/trading advice, and is simply a way to visualize what investor/trader sentiment has been like at each of the price levels mentioned, as well as what it was at levels of support & resistance that are denoted in the image.
As always, do your own due diligence before making investing/trading decisions.
For more on the methodology on how the data was collected & put together, please refer to our original Price:Volume analysis.
*** I DO NOT OWN SHARES OR OPTIONS CONTRACT POSITIONS IN SOXL AT THE TIME OF PUBLISHING THIS ARTICLE ***