NAIL, the Direxion Daily Homebuilders & Supplies Bull 3x Shares ETF has been one of the top performing ETFs in the market this past year, returning +254.89% (ex-distributions) since their 52-week low in October of 2022.
The ETF is powered by the strength in homebuilder data that we have witnessed, as well as in the supplies that go into construction.
Some of its largest holdings include D.R. Horton (15.04%), Lennar Corporation (13.12%), NVR (8.3), Pultegroup (6.48%), Sherwin Williams (4.45%), Home Depot (4.41%), Lowe’s (4.33%), Topbuild Corp (3.28%), Toll Brothers (3.04%) & Builders Firstsource (2.28%).
The Price:Volume analysis seeks to display the volume at specific share-price levels from over the past one-to-two years & is intended to serve as a reference point for how investors viewed NAIL ETF’s value at each level.
It also includes a list of moving averages, as well as support & resistance levels, which will be marked in bold.
NAIL, The Direxion Daily Homebuilders & Supplies Bull 3x Shares ETF’s Price:Volume Sentiment Broken Down
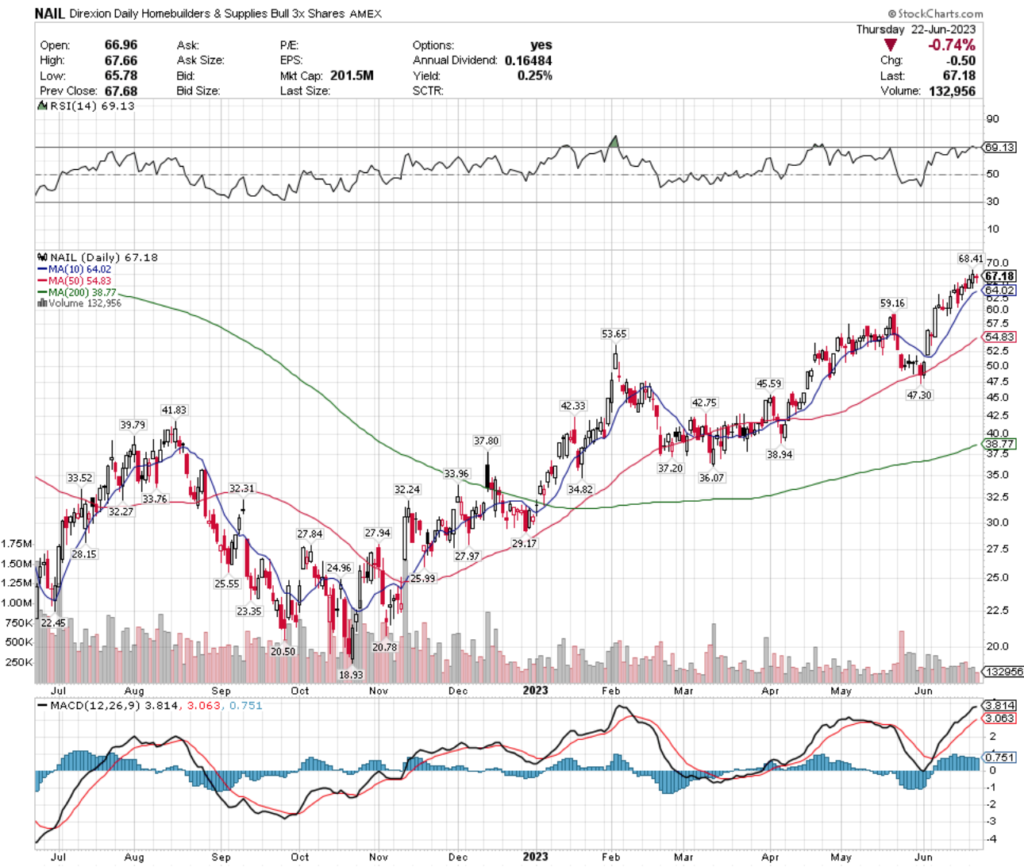
Their RSI is approaching overbought at 69.13 & their MACD is beginning to show signs of cooling down & rolling over bearishly.
Recent trading volumes have been below average compared to the year prior, signaling that investors are beginning to cool off & become hesitant of buying more shares in the near-term, although their price has continued to climb.
Yesterday’s dragonfly doji candlestick also signals that there may be a reversal on the horizon, which also supports the waning volume in confirming the near-term weakness on the horizon.
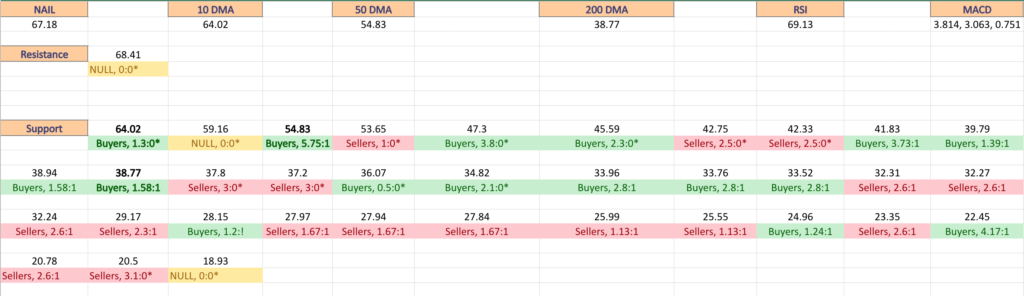
The list below can be used to identify how investors have generally behaved at the price levels listed over the past year, which can be beneficial as a resource during a correction in the ETF’s price.
The bold prices on the image below denote the moving average levels just listed & the bold entries in the list form of the analysis under the images include other levels of support (there is no data for their resistance levels as they are near the highest price level of the past year).
Each corresponding price level using a ratio of Buyers:Sellers (or Sellers:Buyers), NULL values denote that there was not enough data, so the ratio would’ve been 0:0.
Ratios with a 0 for the denominator/constant are denoted with an *, but are reported as is, as we are accounting for volume/sentiment.
Also, as there is such a wide spread between many price levels having activity data, many of the levels are marked NULL, as there was limited volume data for them, and they were not included in the long list below unless they were relevant to support/resistance levels.
NAIL, The Direxion Daily Homebuilders & Supplies ETF’s Volume By Price Level
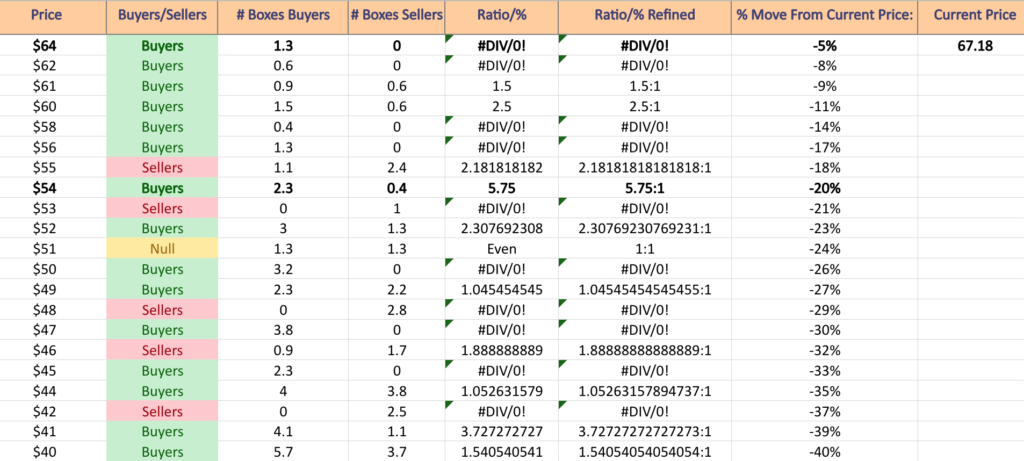
$64 – Buyers – 1.3:0*; -5% From Current Price – 10 Day Moving Average
$62 – Buyers – 0.6:0*; -8% From Current Price
$61 – Buyers – 1.5:1; -9% From Current Price
$60 – Buyers – 2.5:1; -11% From Current Price
$58 – Buyers – 0.4:0*; -14% From Current Price
$56 – Buyers – 1.3:0*; -17% From Current Price
$55 – Sellers – 2.18:1; -18% From Current Price
$54 – Buyers – 5.75:1; -20% From Current Price – 50 Day Moving Average
$53 – Sellers – 1:0*; -21% From Current Price
$52 – Buyers – 2.31:1; -23% From Current Price
$51 – Even – 1:1; -24% From Current Price
$50 – Buyers – 3.2:0*; -26% From Current Price
$49 – Buyers – 1.05:1; -27% From Current Price
$48 – Sellers – 2.8:0*; -29% From Current Price
$47 – Buyers – 3.8:0*; -30% From Current Price
$46 – Sellers – 1.89:1; -32% From Current Price
$45 – Buyers – 2.3:0*; -33% From Current Price
$44 – Buyers – 1.05:1; -35% From Current Price
$42 – Sellers – 2.5:0*; -37% From Current Price
$41 – Buyers – 3.73:1; -39% From Current Price
$40 – Buyers – 1.54:1; -40% From Current Price
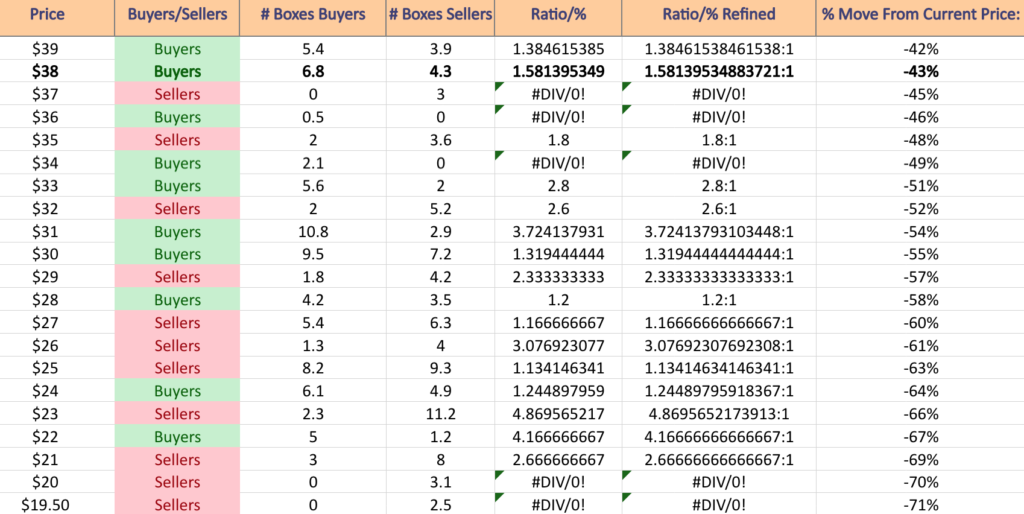
$39 – Buyers – 1.38:1; -42% From Current Price
$38 – Buyers – 1.58:1; -43% From Current Price – 200 Day Moving Average
$37 – Sellers – 3:0*; -45% From Current Price
$36 – Buyers – 0.5:0*; -46% From Current Price
$35 – Sellers – 1.8:1; -48% From Current Price
$34 – Buyers – 2.1:0*; -49% From Current Price
$33 – Buyers – 2.8:1; -51% From Current Price
$32 – Sellers – 2.6:1; -52% From Current Price
$31 – Buyers – 3.72:1; -54% From Current Price
$30 – Buyers – 1.32:1; -55% From Current Price
$29 – Sellers – 2.33:1; -57% From Current Price
$28 – Buyers – 1.2:1; -58% From Current Price
$27 – Sellers – 1.17:1; -60% From Current Price
$26 – Sellers – 3.08:1; -61% From Current Price
$25 – Sellers – 1.13:1; -63% From Current Price
$24 – Buyers – 1.24:1; -64% From Current Price
$23 – Sellers – 4.87:1; -66% From Current Price
$22 – Buyers – 4.17:1; -67% From Current Price
$21 – Sellers – 2.67:2; -69% From Current Price
$20 – Sellers – 3.1:0*; -70% From Current Price
$19.50 – Sellers- 2.5:0*; -71% From Current Price
Tying It All Together
The list & image above paint the picture as to how investors & traders have behaved at various price levels that NAIL has been at over the past one-to-two years.
It is not meant to serve as investment/trading advice, and is simply a way to visualize what investor/trader sentiment has been like at each of the price levels mentioned, as well as what it was at levels of support & resistance that are denoted in the image & list.
As always, do your own due diligence before making investing/trading decisions.
For more on the methodology on how the data was collected & put together, please refer to our original Price:Volume analysis.
*** I DO NOT OWN SHARES OR OPTIONS CONTRACT POSITIONS IN NAIL AT THE TIME OF PUBLISHING THIS ARTICLE ***