SPY, the SPDR S&P 500 ETF shed -1.42% this past week, as investors broadly were taking chips off of the table from stocks of all market cap sizes.
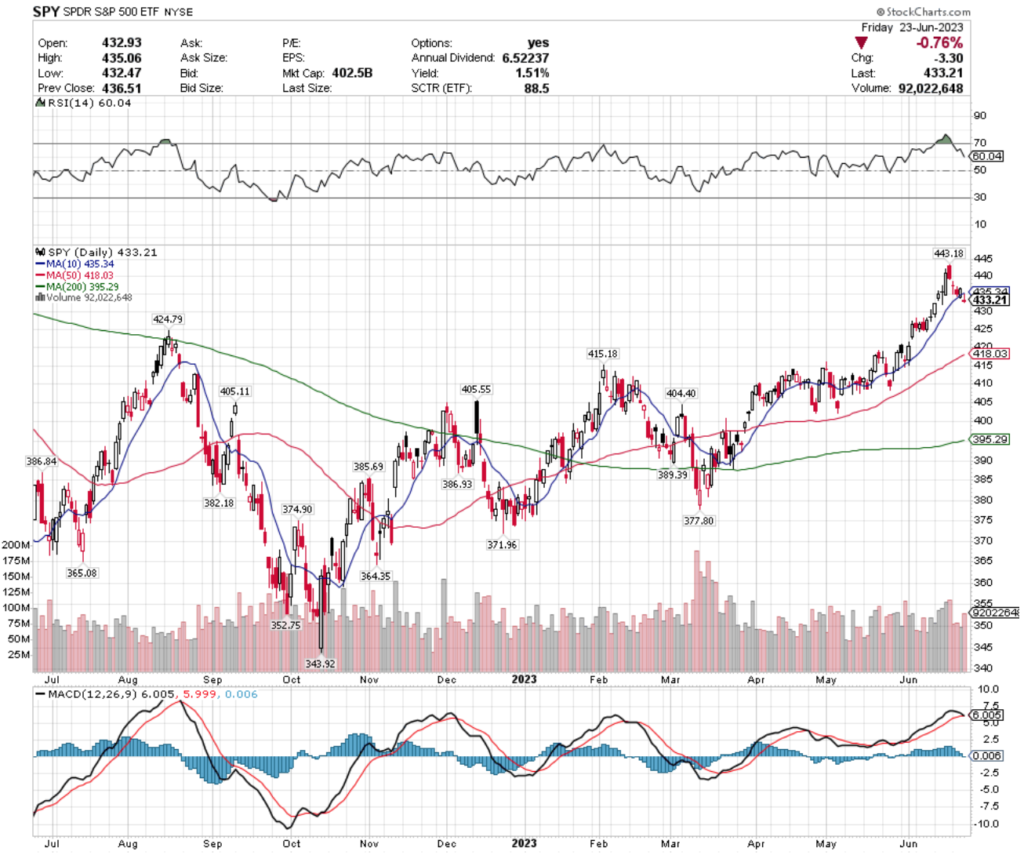
Their RSI is trending towards oversold at 60.04, and their MACD is primed to bearishly crossover in the coming session.
Volumes this past week were roughly average compared to the year prior, with Friday’s gravestone doji candlestick indicating that investors have begun to lose enthusiasm & points towards more declines in the coming week.
The week kicked off with SPY hitting a new high, only to retreat & close lower, followed by a dragonfly doji candle on Tuesday, indicating a reversal was imminent & a spinning top Wednesday, which indicated further indecision by market participants.
Friday’s session’s price action taking place largely underneath the 10 day moving average is also a sign of support being broken in early stages, which is also bearish.
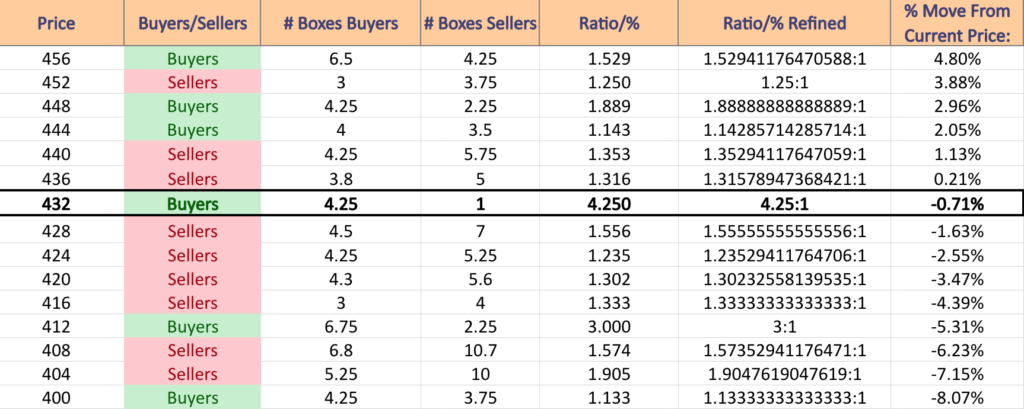
SPY has support at the $424.79 (Volume Sentiment: Sellers, 1.24:1), $418.03 (50 Day Moving Average; Volume Sentiment: Sellers, 1.33:1), $415.18 (Volume Sentiment: Buyers, 3:1) & $405.55/share (Volume Sentiment: Sellers, 1.90:1) price levels, with resistance at the $435.34 (10 Day Moving Average; Volume Sentiment: Buyers, 4.25:1), $443.18 (Volume Sentiment: Sellers, 1.35:1) $447.43 (Volume Sentiment: Buyers, 1.14:1) & $452.69/share (Volume Sentiment: Sellers, 1.25:1) price levels.
QQQ, the Invesco QQQ Trust ETF lost -1.33% this past week, faring the best of the major indexes in a week of declines across the board.
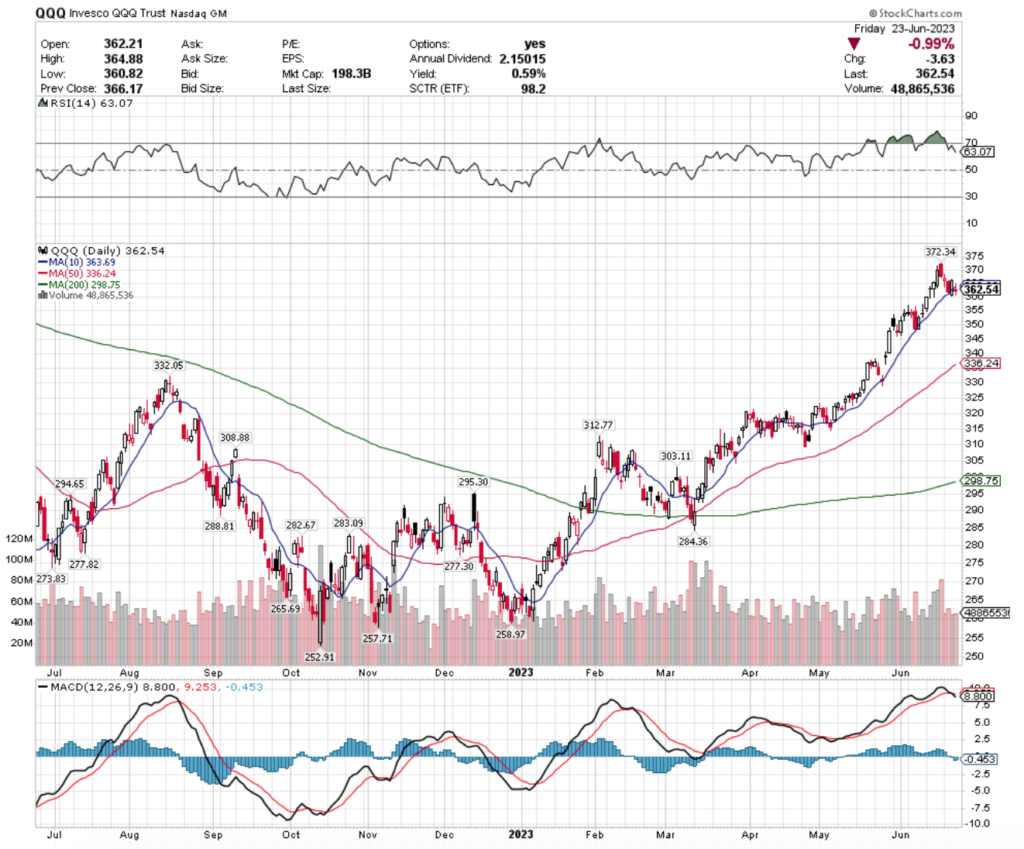
Their RSI has retreated from overbought conditions this past week to settle at 63.07 & their MACD has bearishly crossed over.
Trading volumes were about average compared to the year prior, with last week’s candlesticks indicating further declines are on the horizon.
Like SPY, QQQ opened the week testing to break out of last week’s highs, but ultimately closed lower on Monday, followed by a spinning top of Tuesday that showed investors weren’t certain about last week’s trend.
Thursday’s candle was a bullish engulfing candle, but Friday closed off with a doji where the open & close were on the bottom half of the candle, indicating that the sentiment overall has become more cautious.
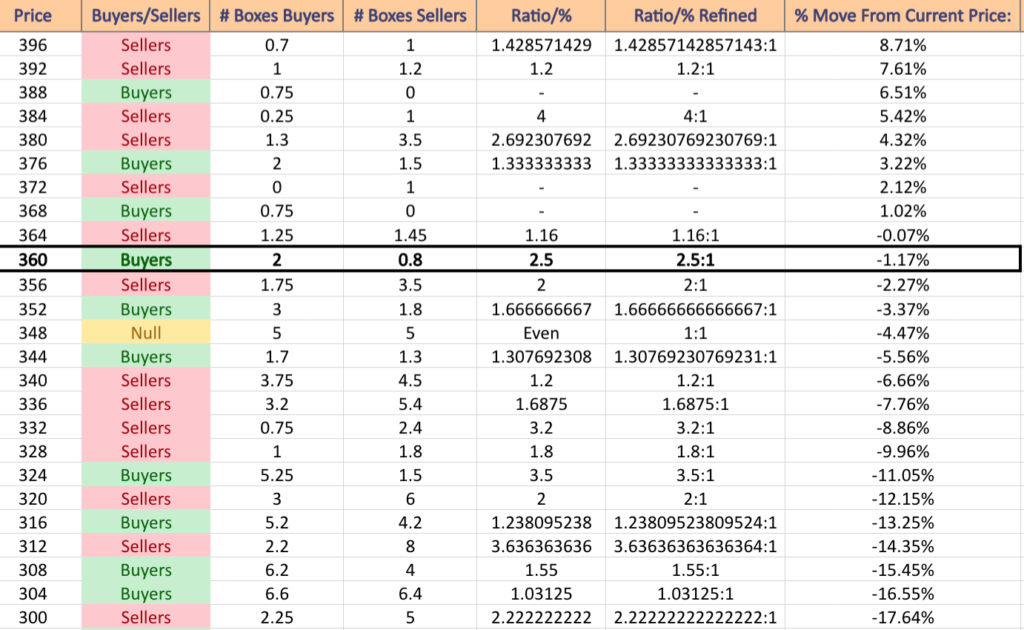
QQQ has support at the $336.24 (50 Day Moving Average; Volume Sentiment: Sellers, 1.69:1), $332.05 (Volume Sentiment: Sellers, 3.2:1), $312.77 (Volume Sentiment: Sellers, 3.64:1) & $308.88/share (Volume Sentiment: Buyers, 1.55:1) price levels, with resistance at the $363.69 (10 Day Moving Average; Volume Sentiment: Buyers, 2.5:1), $372.34 (Volume Sentiment: Sellers, 1:0*), $377.97 (Volume Sentiment: Buyers, 1.33:1) & $404.02/share (Volume Sentiment: NULL, 0:0*) price levels.
IWM, the iShares Russell 2000 ETF fell -2.89% this past week, as small cap stocks were the most fled from.
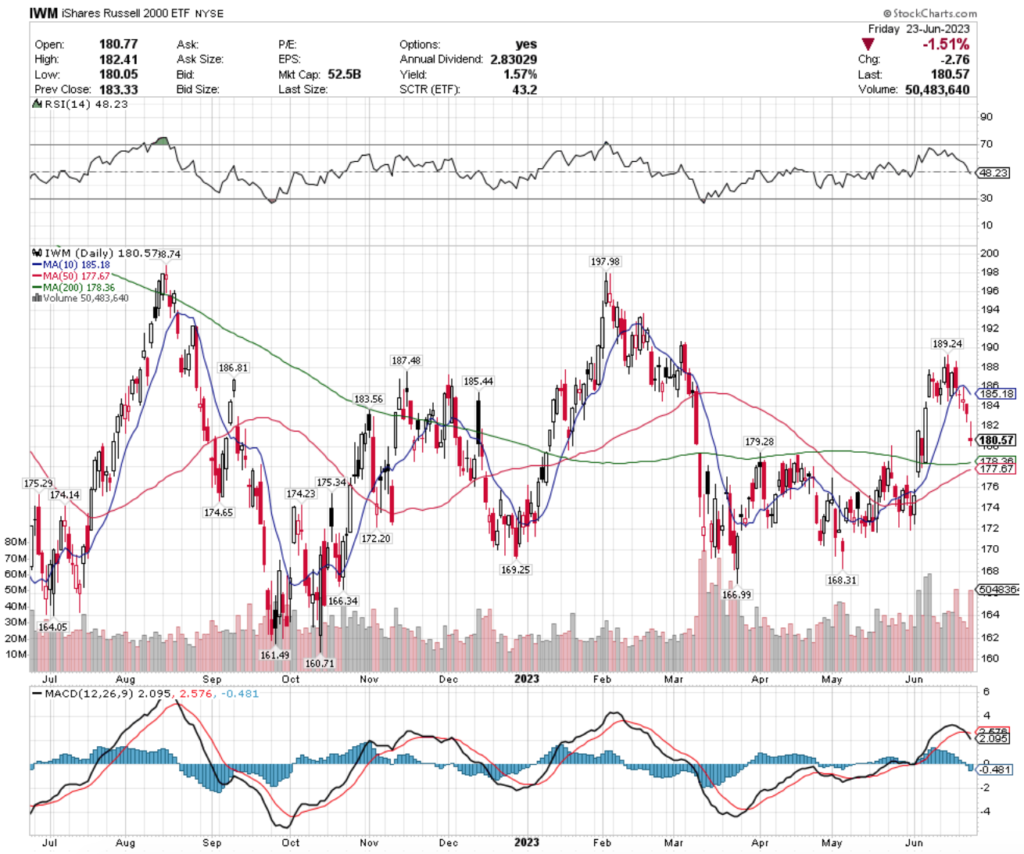
Their RSI is just below the neutral level of 50 at 48.23, and their MACD bearishly crossed over during the past week.
Volumes were above average this past week compared to the year prior, indicating investor sentiment is largely negative.
The week before, IWM indicated a reversal on the horizon with a piercing line pattern on Thursday & Friday, with Monday’s session forming a dark cloud cover pattern with the previous Friday’s candle.
Tuesday’s dragonfly doji confirmed the reversal, as Wednesday’s spinning top candle, and Friday’s gravestone doji candle indicates that more bearishness is likely to come in the upcoming week.
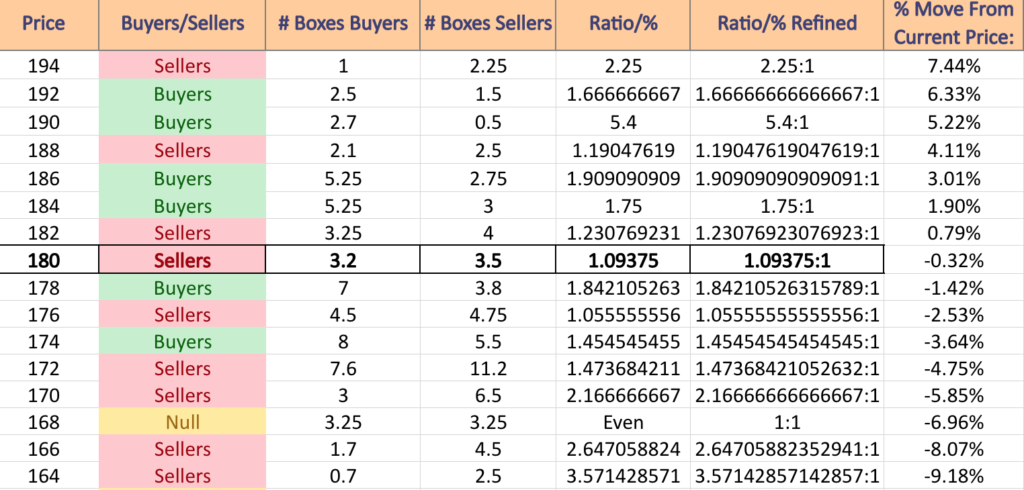
IWM has support at the $179.28 (Volume Sentiment: Buyers, 1.84:1), $178.36 (200 Day Moving Average; Volume Sentiment: Buyers, 1.84:1), $177.67 (50 Day Moving Average; Volume Sentiment: Sellers, 1.06:1) & $175.34/share (Volume Sentiment: Buyers, 1.45:1) price levels, with resistance at the $183.56 (Volume Sentiment: Sellers, 1.23:1), $185.18 (10 Day Moving Average; Volume Sentiment: Buyers, 1.75:1), $185.44 (Volume Sentiment: Buyers, 1.75:1) & $186.81/share (Volume Sentiment: Buyers, 1.91:1) price levels.
DIA, the SPDR Dow Jones Industrial Average ETF declined -1.69% over the past week, as even large cap names were not spared from the week’s selling pressure.
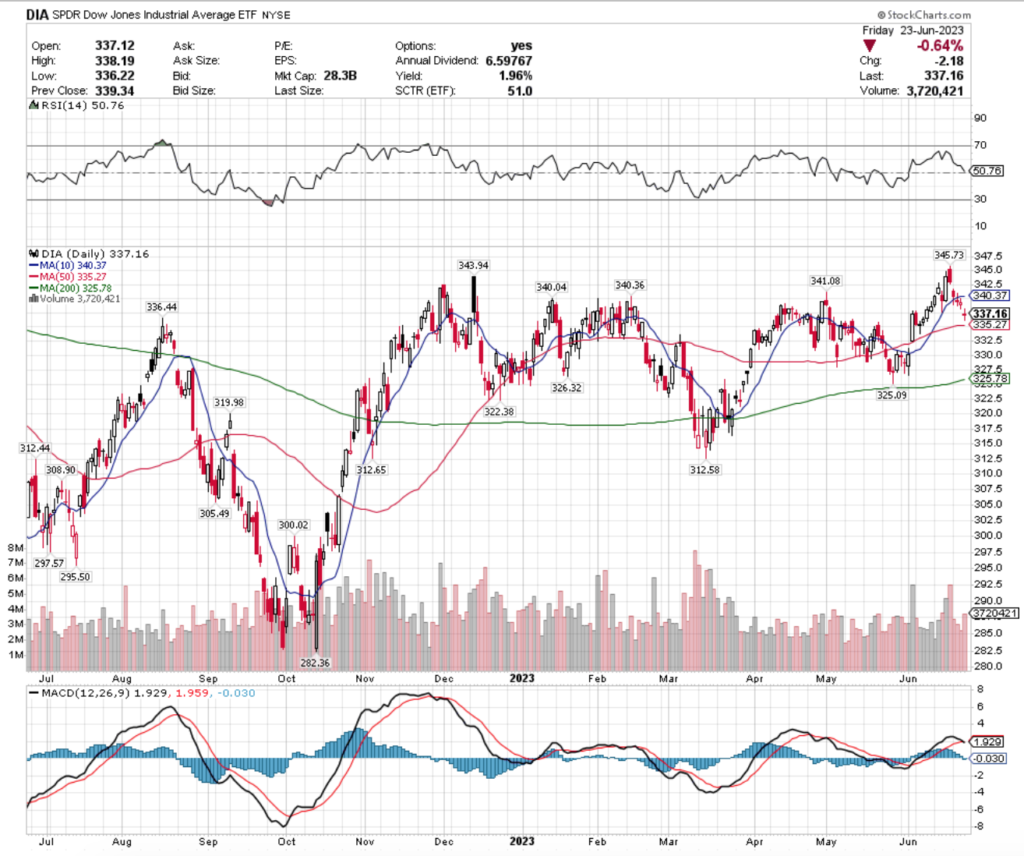
Their RSI is neutral, with their MACD also giving a bearish signal reading.
Last week’s volumes were overall relatively average compared to the year prior, signaling that investors have become less confident in the large cap DJIA names.
The week kicked off Monday forming a dark cloud cover pattern over Friday’s candlestick, which led to the declines of the rest of the week.
The middle of the week signaled further bearishness/uncertainty, with a handing man, doji & spinning top, that was finished off with more bearish uncertainty Friday, which closed with a gap down session doji candle.
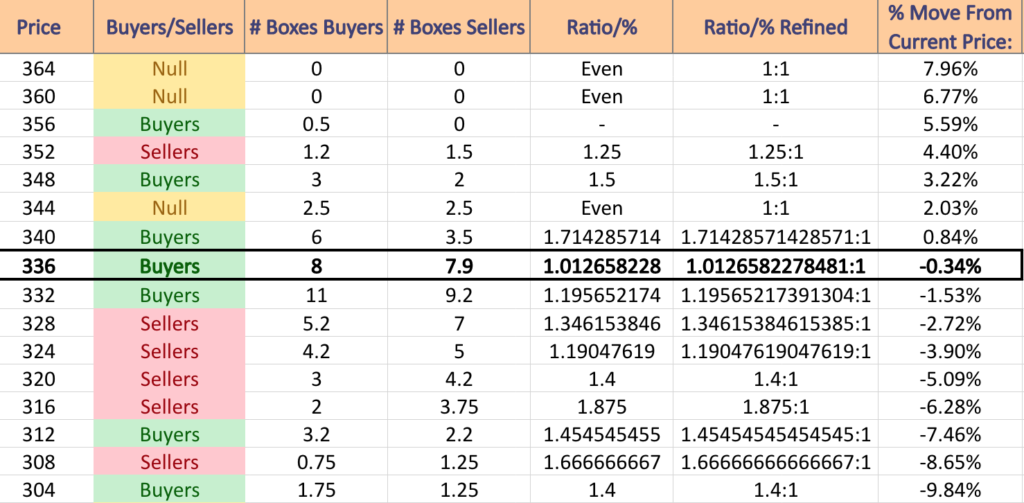
DIA has support at the $336.44 (Volume Sentiment: Buyers, 1.01:1), $335.27 (50 Day Moving Average, Volume Sentiment: Buyers, 1.20:1), $326.32 (Volume Sentiment: Sellers, 1.19:1) & $325.09/share (Volume Sentiment: Sellers, 1.19:1) price levels, with resistance at the $340.04 (Volume Sentiment: Buyers, 1.71:1), $340.36 (Volume Sentiment: Buyers, 1.71:1), $340.37 (10 Day Moving Average; Volume Sentiment: Buyers, 1.71:1) & $341.08/share (Volume Sentiment: Buyers, 1.71:1) price levels.
Argentina (ARGT), U.S. Home Construction (ITB), Emerging Markets Local Debt (ELD) & Spain (EWP) Are All Bullishly Leading The Market
ARGT, the Global X MSCI Argentina ETF has climbed +82.37% over the past year, including a +96.65% ascent from their 52-week low in July of 2022 (ex-distributions).
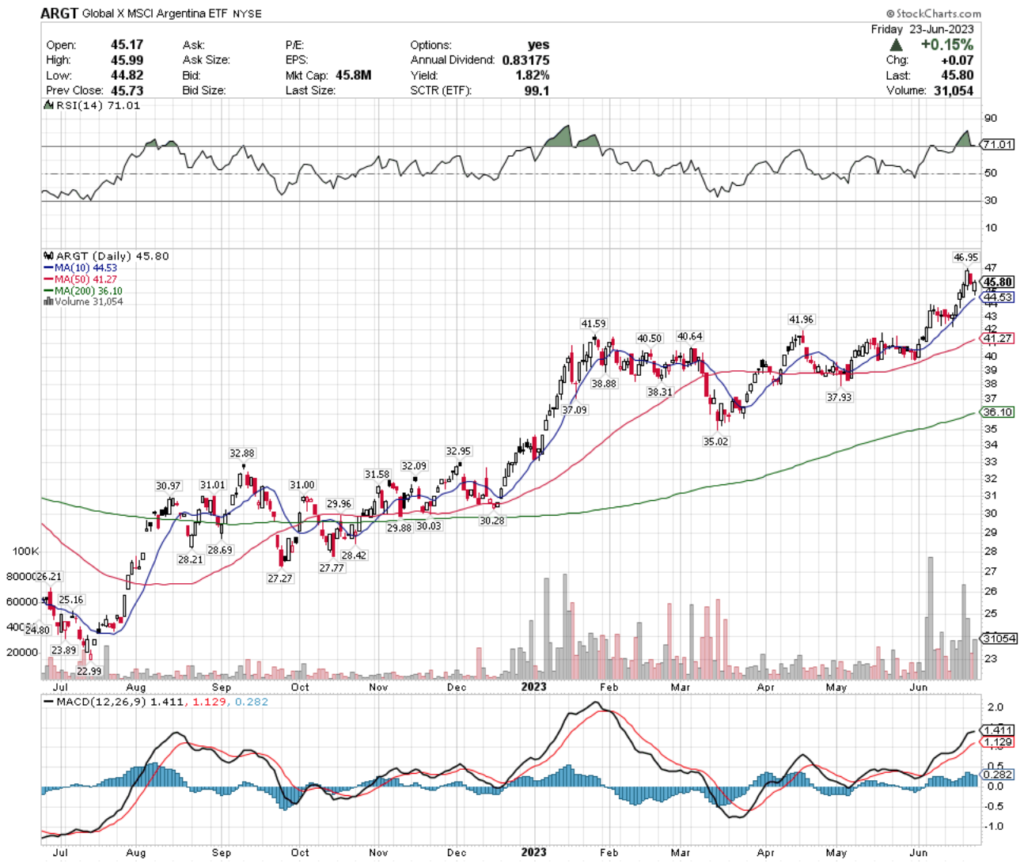
Their RSI is overbought at 71.01 & their MACD is beginning to curl over signaling near-term bearishness after climbing aggressively in the latter portions of June.
Recent trading volumes have been above average compared to the year prior, signaling strong conviction among investors, but Thursday’s completion of a bearish Harame pattern further indicates a near-term reversal.
The 10 day moving average at $44.53 will be an area of support to watch in the coming week.
Note that ARGT pays a 1.82% distribution yield for long-term holders, which provides a moderate cushion against losses, which suggests that an insurance policy using options is best for investors with an open positions (such as selling near-term out of the money calls or buying puts), while watching their behavior at support levels.
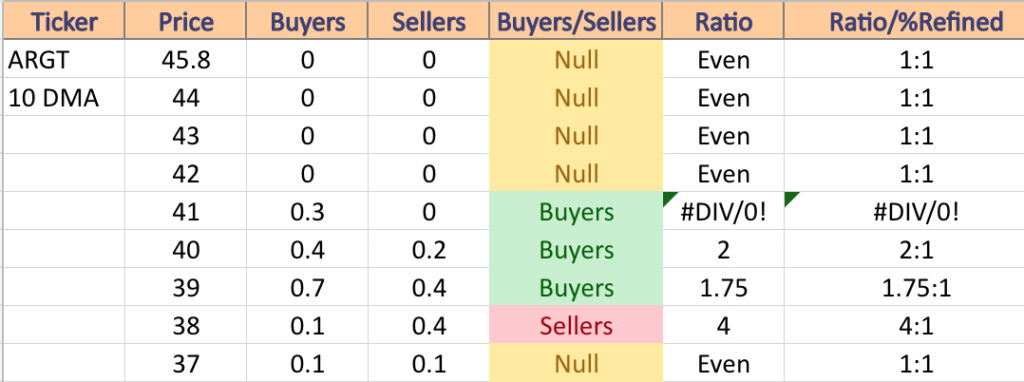
ARGT has support at the $44.53 (10 Day Moving Average; Volume Sentiment: NULL, 0:0*), $41.96 (Volume Sentiment: Buyers, 0.3:0*), $41.59 (Volume Sentiment: Buyers, 0.3:0*) & $41.27/share (50 Day Moving Average: ; Volume Sentiment: Buyers, 0.3:0*), with resistance overhead at the $46.95 (Volume Sentiment: NULL, 0:0*), as they are near an all-time high.
ITB, the iShares U.S. Home Construction ETF has gained +58.42% over the past year, earning +63.54% since their 52-week low in October of 2022 (ex-distributions).
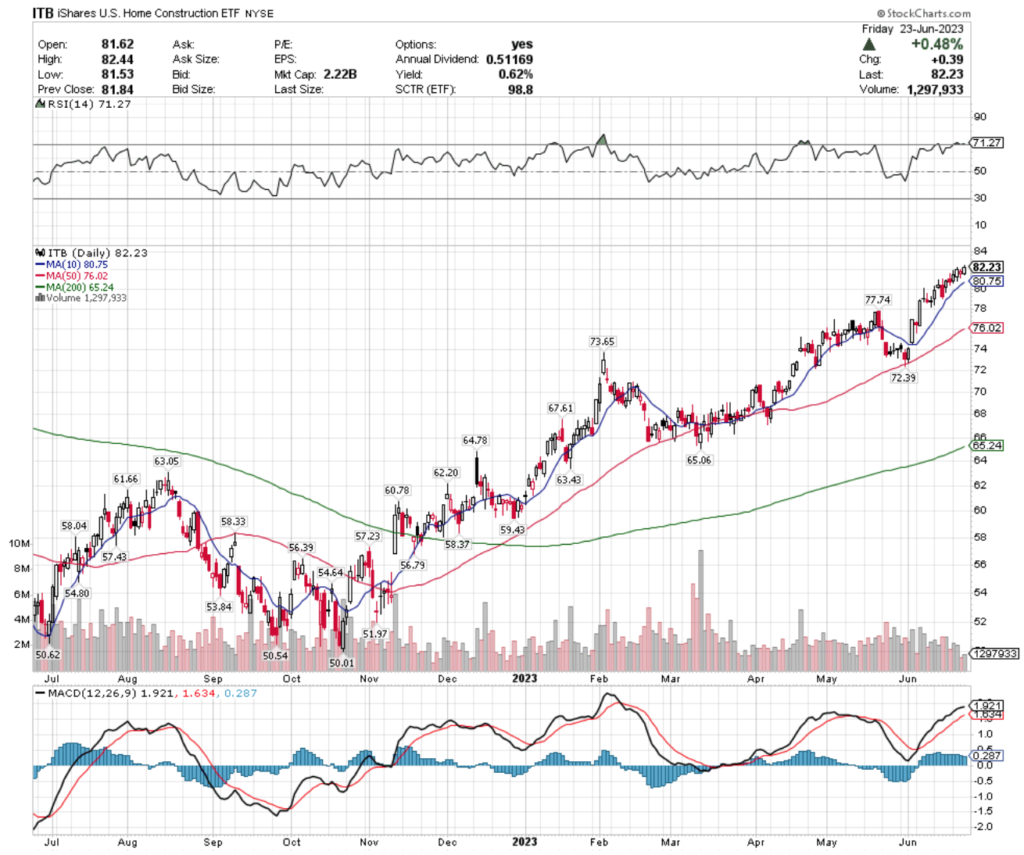
Their RSI is also overbought at 71.27, with their MACD still bullish, but signaling a bearish crossover is on the near-term horizon, as they closed Friday’s session near their all-time high (from 2022).
Recent trading volumes have been slightly below average compared to the year prior, signaling waning enthusiasm among investors & Thursday’s inside candle when combined with Friday’s session, that while was a bullish day, had a much longer upper shadow than lower shadow (barely visible) signals investors are becoming skittish at these high levels & a correction is on the near-horizon.
Unfortunately, ITB’s distribution yield for long-term investors is only 0.62%, which hardly provides any cushion against losses, making it wise to have an insurance policy using options, or to liquidate a position while waiting to see where the dust settles as they retest support levels.
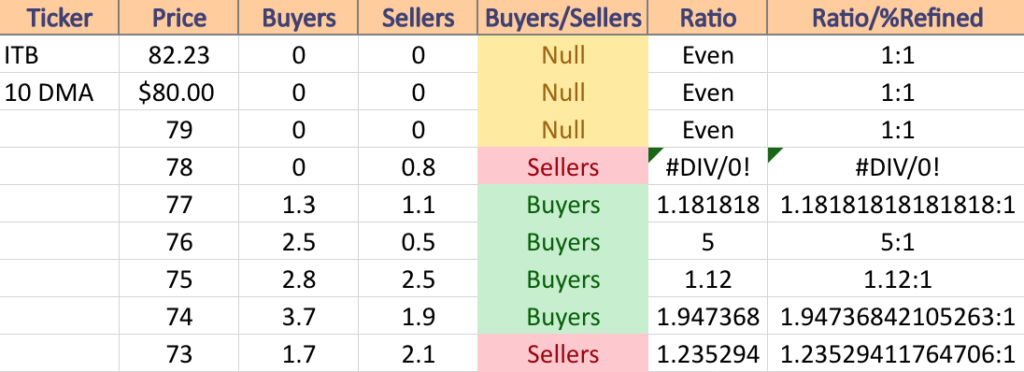
ITB has support at the $80.75 (10 Day Moving Average; Volume Sentiment: NULL, 0:0*), $77.74 (Volume Sentiment: Buyers, 1.18:1), $76.02 (50 Day Moving Average; Volume Sentiment: Buyers, 5:1) & $73.65/share (Volume Sentiment: Sellers, 1.24:1) price levels, with resistance at the $82.42/share price level (All-time high, from 2022; Volume Sentiment: NULL, 0:0*).
ELD, the Wisdom Tree Emerging Markets Local Debt Fund ETF has improved +14.39% over the past year, edging up +16.44% since their 52-week low in October of 2022 (ex-distributions).
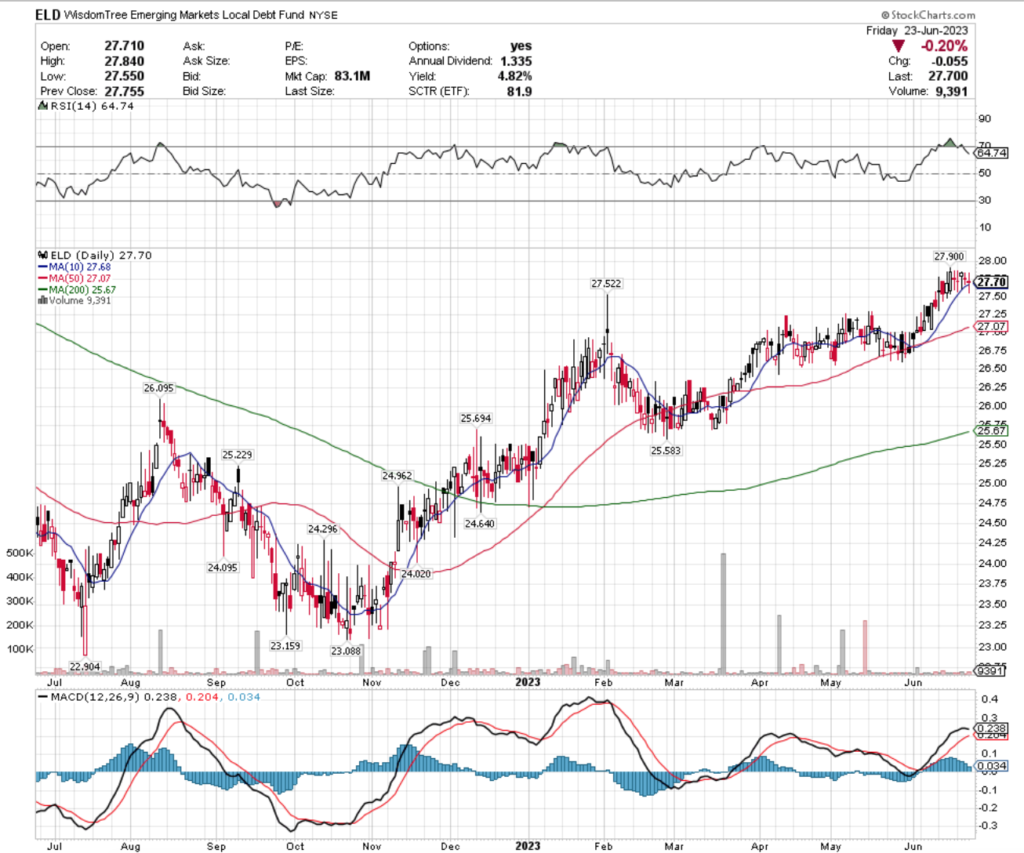
Their RSI is returning from overbought conditions & has fallen to 64.74 (still above neutral), with their MACD having curled over bearishly & prone to crossover bearish in the coming days.
Investors seem to be unenthused at the moment, with recent trading volumes being below average compared to the year prior & last week’s candlesticks consisting of all spinning tops & a hanging man on Wednesday, signaling a reversal is imminent.
While they offer a generous 4.82% distribution yield, unless holding an options strategy to protect against losses investors should be weary of impending losses on the near horizon & be ready to watch their behavior at support levels in the coming weeks.
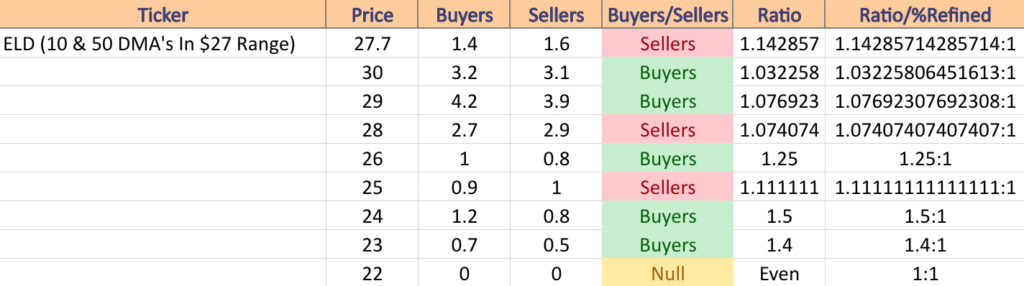
ELD has support at the $27.68 (10 Day Moving Average; Volume Sentiment: Sellers, 1.14:1), $27.52 (Volume Sentiment: Sellers, 1.14:1), $27.07 (50 Day Moving Average; Volume Sentiment: Sellers, 1.14:1) & $26.10/share (Volume Sentiment: Buyers, 1.25:1), with resistance at the $27.90 (Volume Sentiment: Sellers, 1.14:1), $28.45 (2022; Volume Sentiment: Sellers, 1.07:1), $28.61 (2021; Volume Sentiment: Sellers, 1.07:1) $30.50/share (2021; Volume Sentiment: Buyers, 1.03:1) price levels.
EWP, the iShares MSCI Spain Capped ETF has gained +21.83% over the past year, climbing 43.49% since their 52-week low in October of 2022 (ex-distributions).
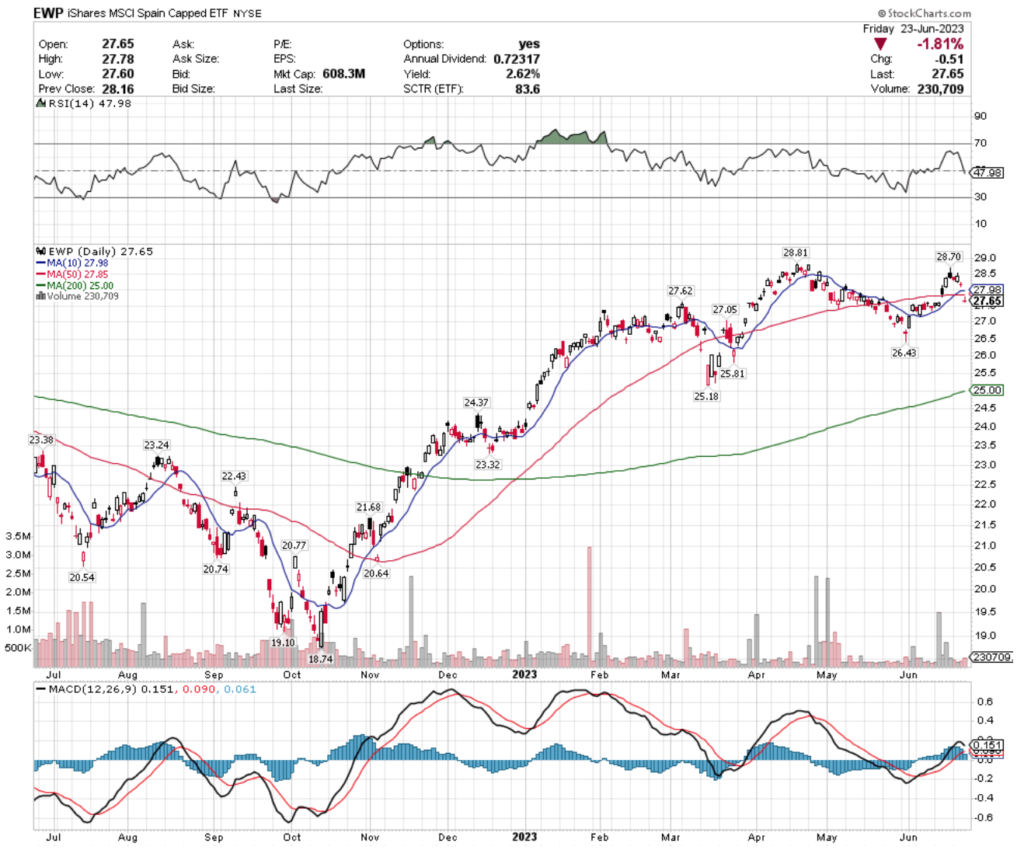
Their RSI is neutral at 47.98, with their MACD looking ready to crossover bearishly during Monday or Tuesday’s session.
Recent trading volumes have been below average compared to the year prior (with exception to a couple of days 2 weeks ago) signaling that enthusiasm is running low among investors, and Thursday’s doji candle combined with Friday’s -1.81% gap down gravestone doji candle that opened below the 10 & 50 day moving averages & never came near them as resistance levels signals near-term bearishness.
With a 2.62% distribution yield there is some protection against future losses, but shareholders would be wise to protect themselves with an options strategy that is appropriate to their experience level while watching their behavior at support levels.
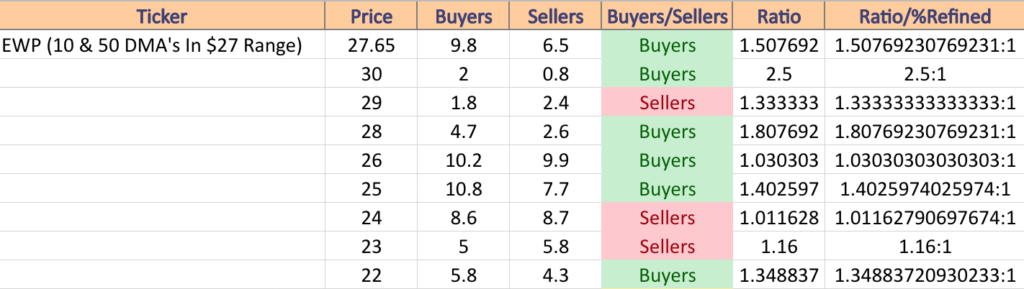
EWP has support at the $27.62 (Volume Sentiment: Buyers, 1.51:1), $27.05 (Volume Sentiment: Buyers, 1.51:1), $26.43 (Volume Sentiment: Buyers, 1.03:1) & $25.81/share (Volume Sentiment: Buyers, 1.40:1) price levels, with resistance at the $27.85 (50 Day Moving Average; Volume Sentiment: Buyers, 1.51:1), $27.98 (10 Day Moving Average; Volume Sentiment: Buyers, 1.51:1), $28.70 (Volume Sentiment: Buyers, 1.81:1) & $28.81/share (Volume Sentiment: Buyers, 1.81:1) price levels.
Cannabis (POTX), Energy (ERX), China (MCHI) & Global Natural Resources (GNR) Are All Bearishly Lagging The Market
POTX, the Global X Cannabis ETF has lost -61.16% over the past year, losing -66.82% from their 52-week high in August of 2022, but has improved +1.36% since their 52-week low in June of 2023 (ex-distributions).
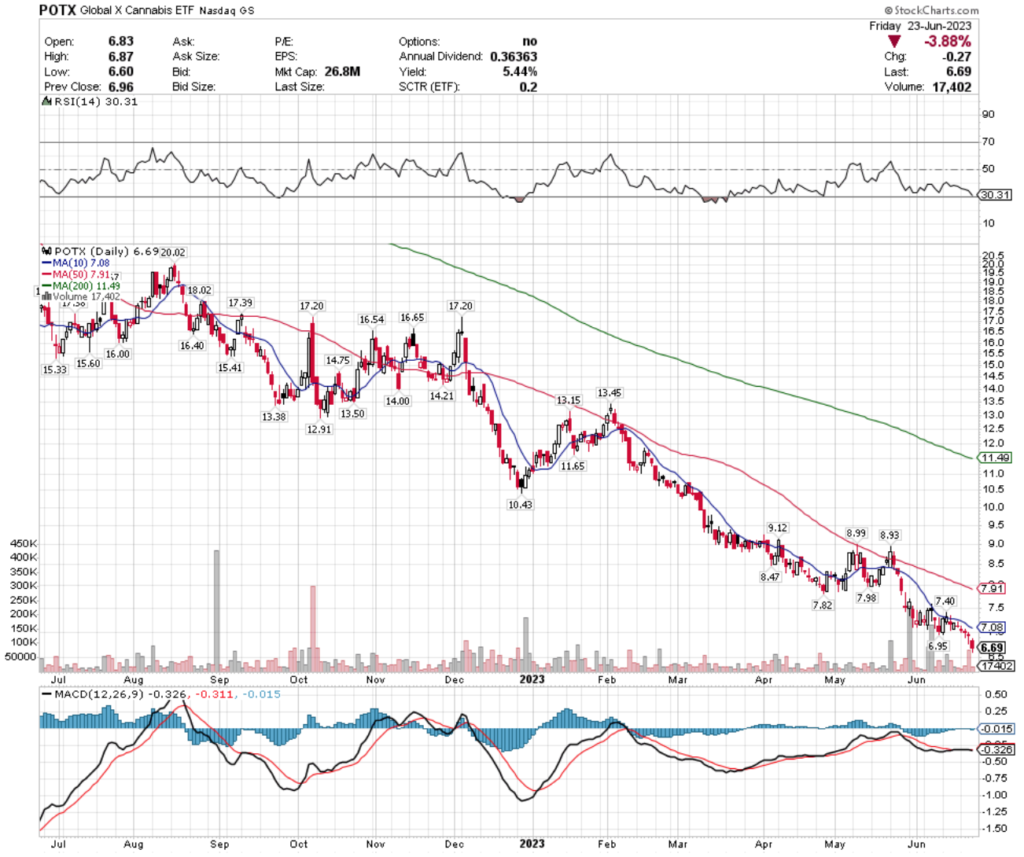
Their RSI is just above oversold levels at 30.31 after a long, steady decline over the past few years, with their MACD also bearish.
Most of the past week’s candlesticks were dojis, including two dragonfly dojis midweek as they declined on below average volume as investors really don’t seem to know what to make of this ETF currently & are most likely waiting for some regulatory news to spark a turnaround.
While their 5.44% distribution yield is generous, I’m not certain that this is worth the risk for the reasons outlined above, but for those who want to take the risk be advised to have insurance for the position just in case.
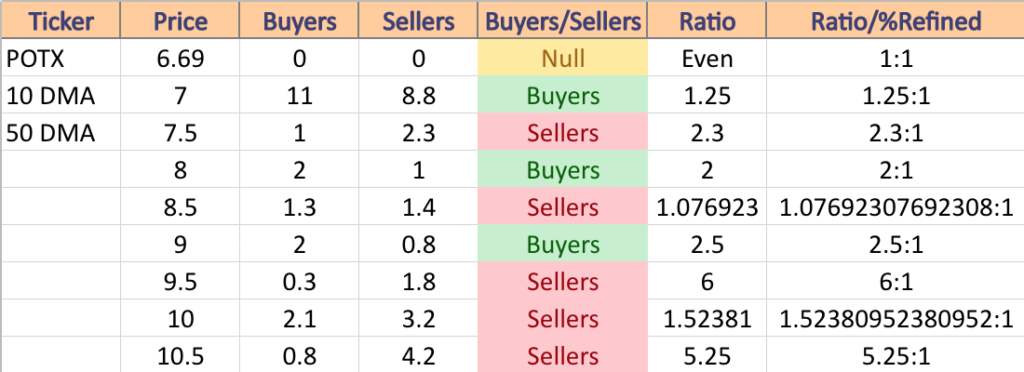
There is no support level as they are at an all time low with Friday’s close, with resistance overhead at the $6.95 (Volume Sentiment: NULL, 0:0), $7.08 (10 Day Moving Average; Volume Sentiment: Buyers, 1.25:1), $7.40 (Volume Sentiment: Buyers, 1.25:1), $7.82 (Volume Sentiment: Buyers, 1.25:1) & $7.91/share (50 Day Moving Average; Volume Sentiment: Buyers, 1.25:1).
ERX, Direxion Daily Energy Bull 2x Shares ETF has gained +12.39% over the past year, but has fallen -36.18% from their 52-week high in November of 2022, while rebounding +28% from their 52-week low in July of 2022 (ex-distributions).
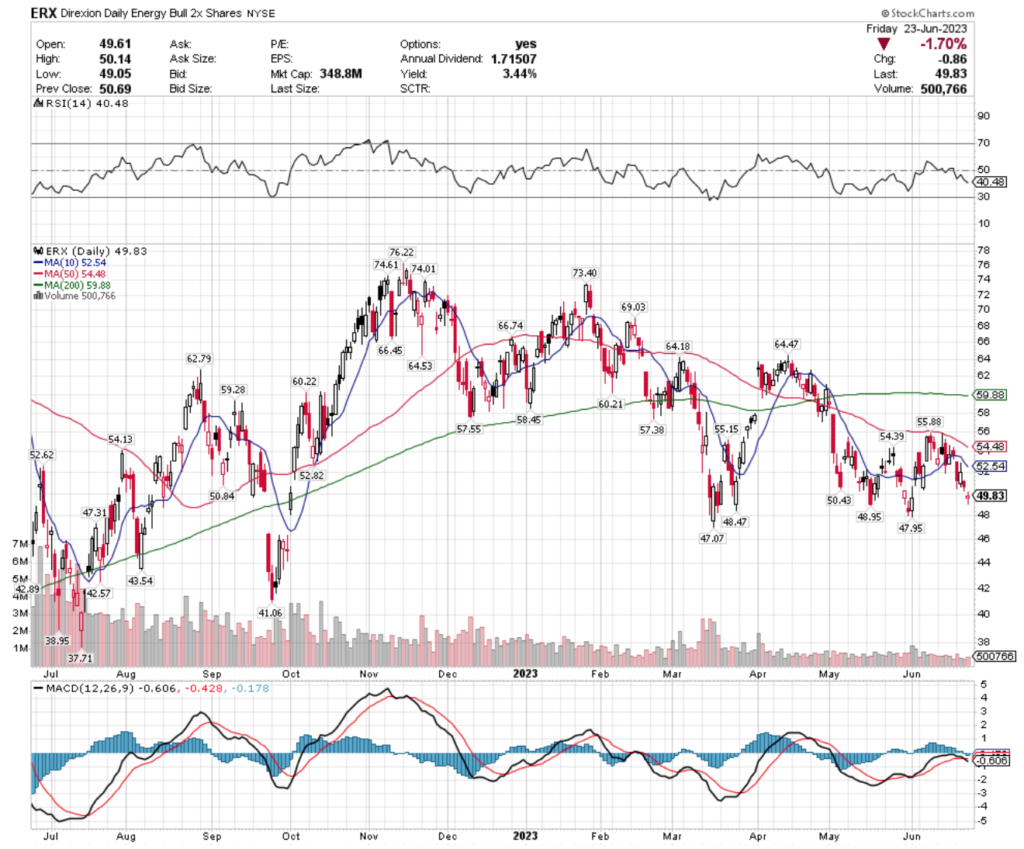
Their RSI is on the oversold end of neutral at 40.48 & their MACD crossed over bearishly last week.
Trading volumes have been well below average for a while now compared to the year prior, signaling investors are not feeling confident in their prospects, with Friday’s -1.7% gap down & spinning top candle further adding to the uncertain/bearish sentiment.
While ERX does offer a 3.44% distribution yield, that is not much protection against downside losses, making it wise to have a form of options strategy in place to protect existing positions from losses while waiting to see how they behave around support levels.
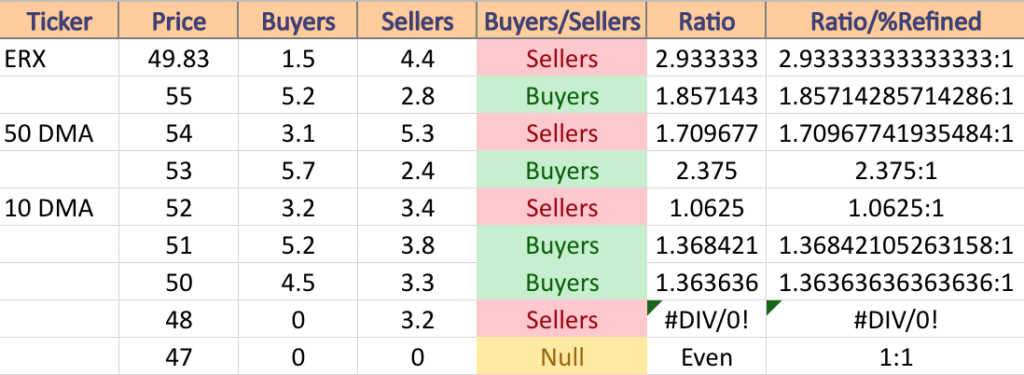
ERX has support at the $48.95 (Volume Sentiment: Sellers, 3.2:0*), $48.47 (Volume Sentiment: Sellers, 3.2:0*), $47.95 (Volume Sentiment: NULL, 0:0) & $47.31/share (Volume Sentiment: NULL, 0:0) price levels, with resistance at the $48.95 (Volume Sentiment: Sellers, 3.2:0*), $50.43 (Volume Sentiment: Buyers, 1.36:1), $50.84 (Volume Sentiment: Buyers, 1.36:1) & $52.54 (10 Day Moving Average; Volume Sentiment: Sellers, 1.06:1) price levels.
MCHI, the iShares MSCI China ETF has declined -16.66% over the past year, losing -22.6% from their 52-week high in June of 2022, while gaining +26.16% since their 52-week low in October of 2022 (ex-distributions).
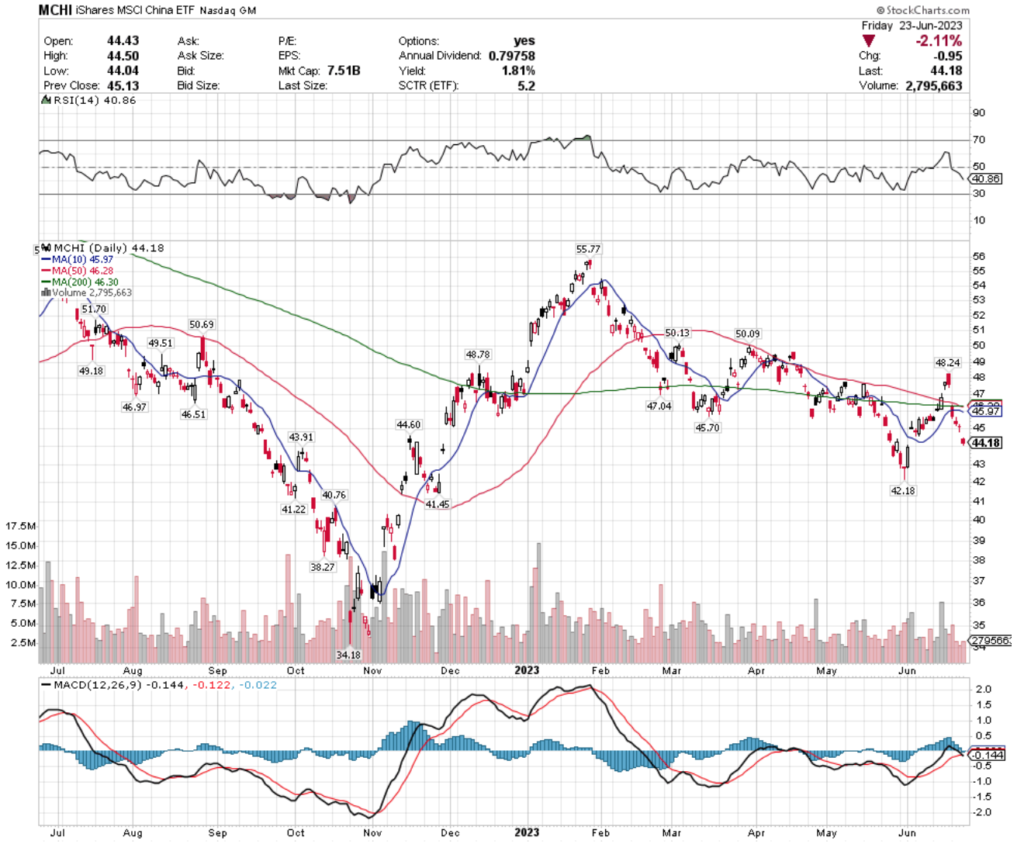
Their RSI is on the oversold end of neutral at 40.86, with their MACD just having crossed over bearishly this past week.
Recent trading volumes have been below average compared to the year prior (with exception to a couple of days in the past 2 weeks), which is further confirmed by last week’s two gap down sessions that cleared below all of their major moving averages & continued downward & include a shooting star & dragonfly doji midweek.
Their 1.81% distribution yield for long-term holders is not very much protection against further downside, making it imperative to have some form of an insurance strategy in place for any open long-positions.
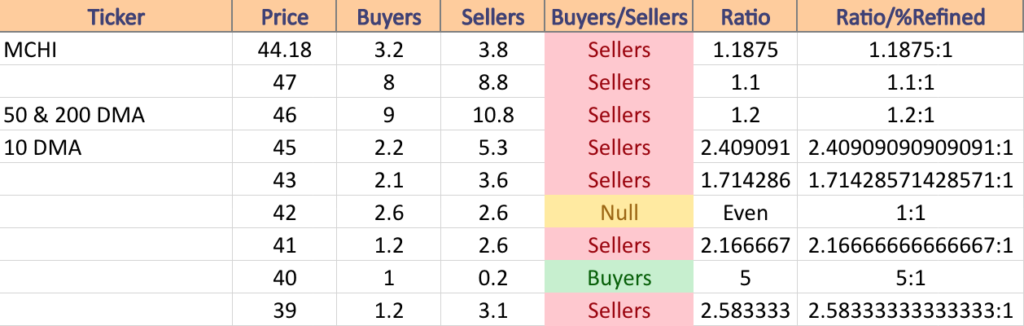
MCHI has support at the $43.91 (Volume Sentiment: Sellers, 1.71:1), $42.18 (Volume Sentiment: Even, 1:1), $41.45 (Volume Sentiment: Sellers, 2.17:1) & $41.22/share (Volume Sentiment: Sellers, 2.17:1) price levels, with resistance at the $44.60 (Volume Sentiment: Sellers, 1.19:1), $45.70 (Volume Sentiment: Sellers, 2.41:1), $45.97 (10 Day Moving Average; Volume Sentiment: Sellers, 2.41:1) & $46.28/share (50 Day Moving Average; Volume Sentiment: Sellers, 1.2:1) price levels.
GNR, the SPDR S&P Global Natural Resources ETF has nudged ahead +6.93% over the past year, declining -15.21% from their 52-week high in January of 2023, but gaining +11.6% from their 52-week low in July of 2022 (ex-distributions).
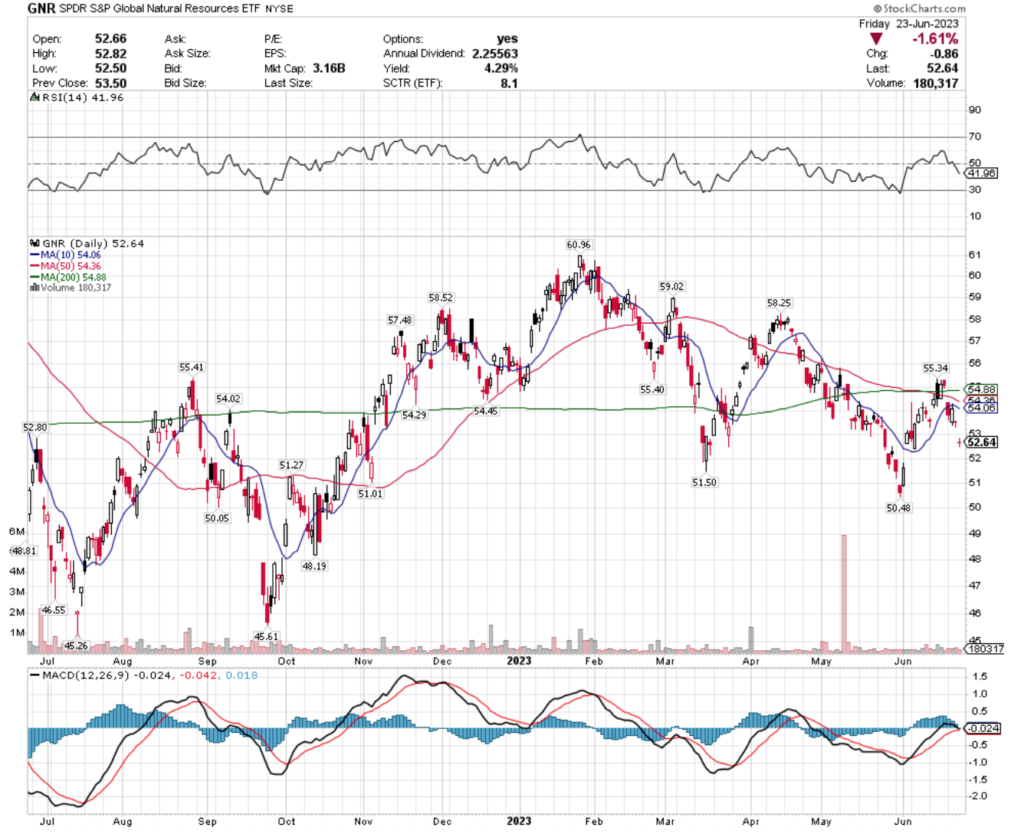
Their RSI is on the oversold end of neutral at 41.96, with their MACD being bearish.
Recent trading volumes have been below average for the year prior, with two gap down sessions last week & a dragonfly doji on Thursday & a -1.61% gap down doji session further confirming near-term uncertainty among investors.
Their 4.29% distribution yield will provide some protection against losses, insurance would be wise to have in the coming weeks against further declines.
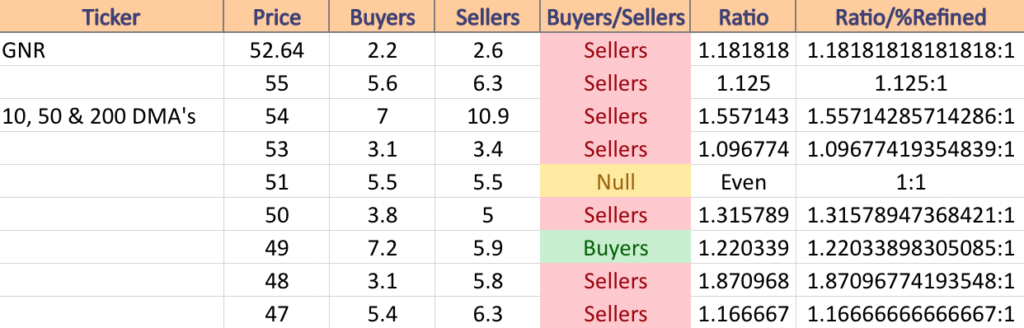
GNR has support at the $51.50 (Volume Sentiment: Even, 1:1), $51.27 (Volume Sentiment: Even, 1:1), $51.01 (Volume Sentiment: Even, 1:1) & $50.48/share (Volume Sentiment: Sellers, 1.32:1) price levels, with resistance at the $52.80 (Volume Sentiment: Sellers, 1.18:1), $54.02 (Volume Sentiment: Sellers, 1.56:1), $54.06 (10 Day Moving Average; Volume Sentiment: Sellers, 1.56:1) & $54.36/share (50 Day Moving Average; Volume Sentiment: Sellers, 1.56:1) price levels.
Tying It All Together
This week starts off on a quiet note, with no major data announcements on Monday, and Carnival reporting earnings.
Tuesday we get Durable-Goods Orders & Durable-Goods Minus Transportation data at 8:30 am, followed by the S&P Case-Schiller Home Price Index (20 Cities) at 9 am, and New Home Sales & Consumer Confidence data at 10 am.
Also on Tuesday, Walgreens Boots Alliance, AeroVironment, Jefferies & Schnitzer Steel will report earnings.
Wednesday kicks off at 8:30 am with Advanced U.S. Trade Balance in Goods, Advanced Retail Inventories & Advanced Wholesale Inventories, followed by Fed Chair Powell speaking at 9:30 am.
BlackBerry, General Mills, H.B. Fuller, Korn/Ferry, Micron Technology, National Beverage & Worthington Industries all report earnings on Wednesday.
Thursday at 2:30 am Fed Chair Powell is set to speak, followed by Initial Jobless Claims data at 8:30 am & Pending Homes Sales data will be reported at 10 am.
Nike, Greenbrier, McCormick, Paychex, Rite Aid, Simply Good Foods are among the earnings reports set for Thursday.
Friday morning will be busy on the data front, beginning at 8:30 am with Personal Income (nominal), Personal Spending (nominal), PCE Index, Core PCE Index, PCE (year-over-year) & Core PCE (year-over-year), followed by the Chicago Business Barometer at 9:45 am & Consumer Sentiment (final) data at 10 am.
Constellation Brands will also report earnings on Friday.
See you back here next week!
*** I DO NOT OWN SHARES OR OPTIONS CONTRACT POSITIONS IN SPY, QQQ, IWM, DIA, ARGT, ITB, ELD, EWP, POTX, ERX, MCHI, or GNR AT THE TIME OF PUBLISHING THIS ARTICLE ***