Oracle Corp. stock has reached new all time highs in 2023 & has climbed +110.79% (ex-dividends) from their 52-week low in September of 2022.
Most of these gains have come from their cloud computing & A.I. products & services.
43.57% of ORCL stock’s outstanding share float is owned by institutional investors & they are a major holding in many ETFs, including IGV (8.81%), IETC (7.25%), TDIV (3.07%) & many more.
The Price:Volume analysis seeks to display the volume at specific share-price levels from over the past one-to-two years & is intended to serve as a reference point for how investors viewed ORCL stock’s value at each level.
It also includes a list of moving averages, as well as support & resistance levels, which will be marked in bold.
Oracle Corp. ORCL Stock’s Price:Volume Sentiment Broken Down
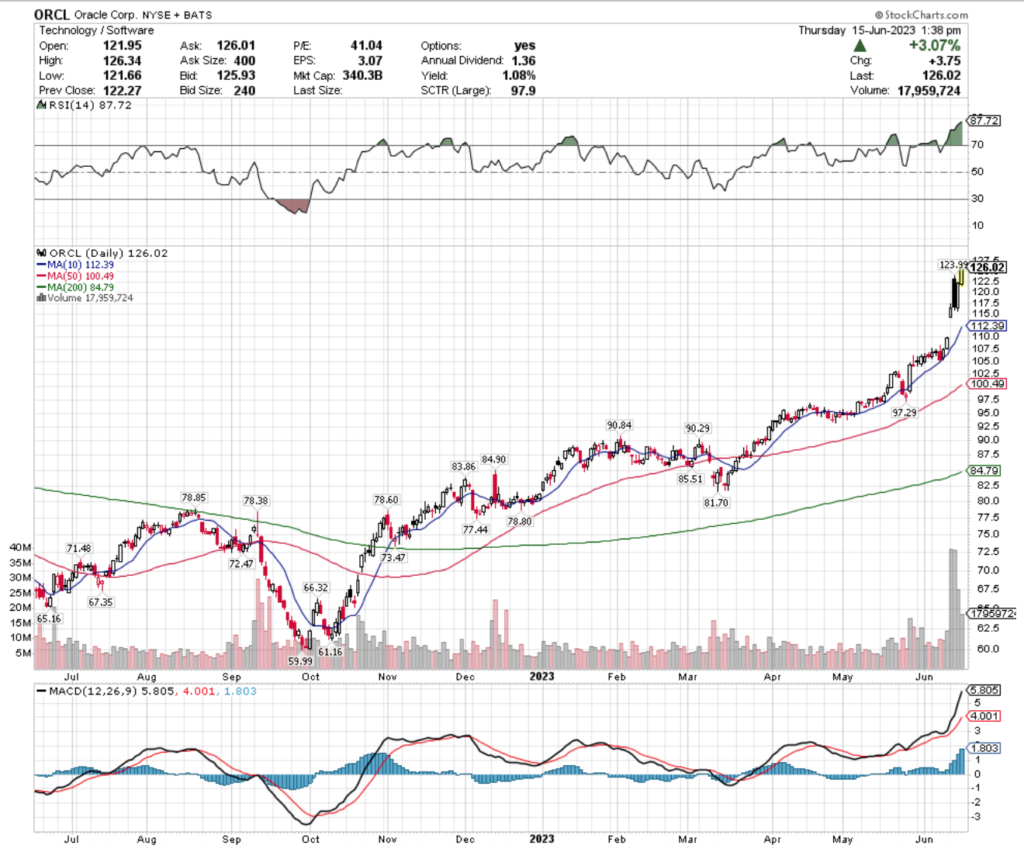
Their RSI is very overbought at 87.72, mostly due to Monday’s gap up occurring while their RSI was already in overbought territory.
Their MACD is also very bullish right now, with recent volumes being well above average showing enthusiasm among investors & traders.
As they are at an all-time high, it is important to understand how investors have behaved over time at various price levels, which is what is outlined below.
The bold prices on the image below denote the moving average levels just listed & the bold entries in the list form of the analysis under the images include other levels of support (there is no data for their resistance levels as they are at an all time high).
Each corresponding price level using a ratio of Buyers:Sellers (or Sellers:Buyers), NULL values denote that there was not enough data, so the ratio would’ve been 0:0.
Ratios with a 0 for the denominator/constant are denoted with an *, but are reported as is, as we are accounting for volume/sentiment.
Also, as there is such a wide spread between many price levels having activity data, many of the levels are marked NULL, as there was limited volume data for them, and they were not included in the long list below unless they were relevant to support/resistance levels.
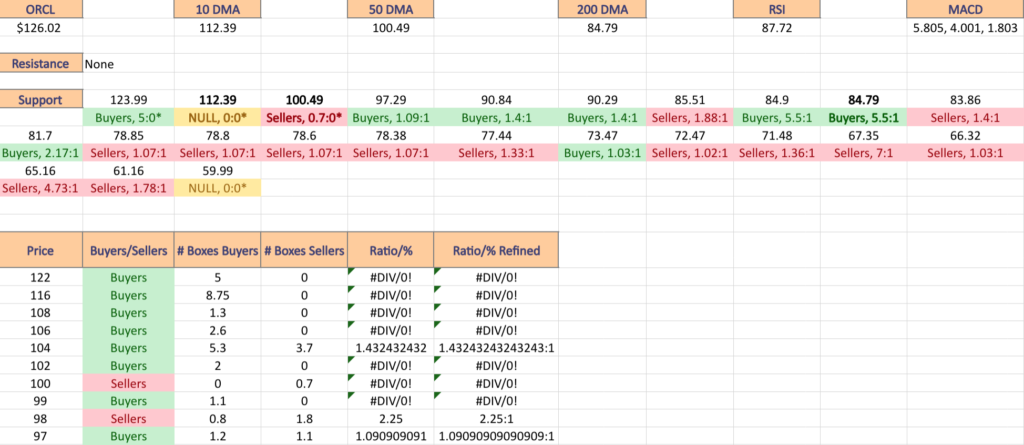
Oracle Corp. ORCL Stock’s Volume By Price Level
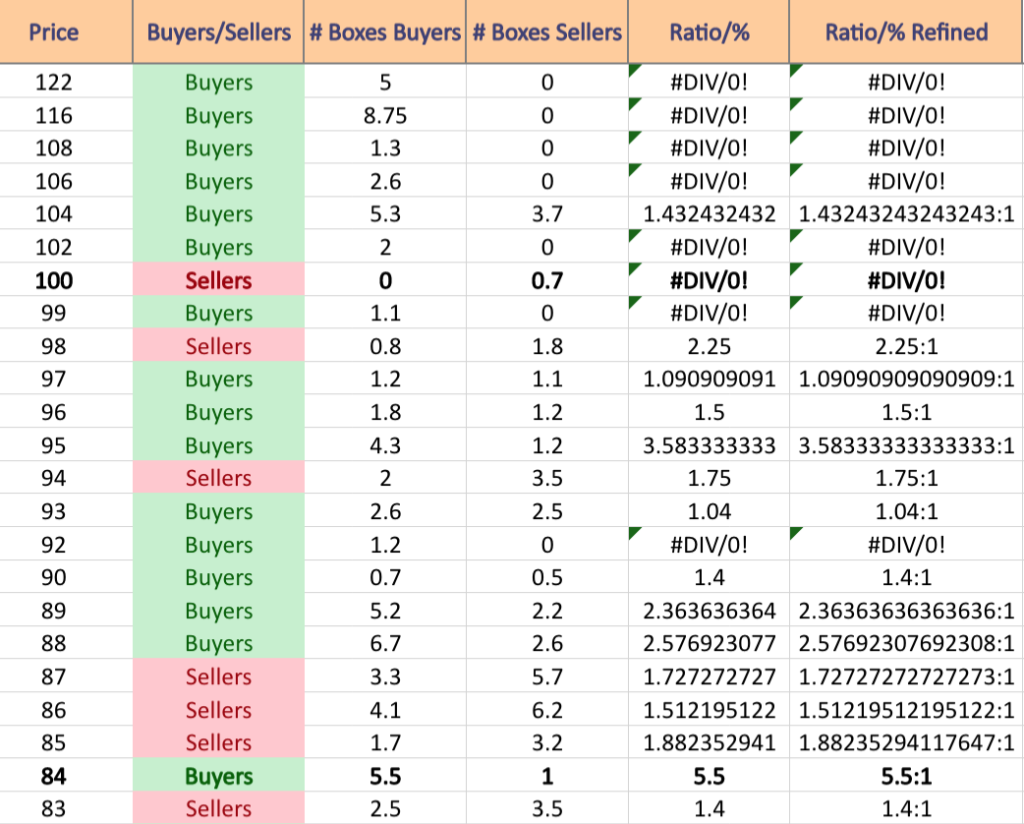
$122 – Buyers – 5:0*
$116 – Buyers – 8.75:0*
$108 – Buyers – 1.3:0*
$106 – Buyers – 2.6:0*
$104 – Buyers – 1.43:1
$102 – Buyers – 2:0*
$100 – Sellers – 0.7:0* – 50 Day Moving Average
$99 – Buyers – 1.1:0*
$98 – Sellers – 2.25:1
$97 – Buyers – 1.09:1
$96 – Buyers – 1.5:1
$95 – Buyers – 3.58:1
$94 – Sellers – 1.75:1
$93 – Buyers – 1.04:1
$92 – Buyers – 1.2:0*
$90 – Buyers – 1.4:1
$89 – Buyers – 2.36:1
$88 – Buyers – 2.58:1
$87 – Sellers – 1.73:1
$86 – Sellers – 1.51:1
$85 – Sellers – 1.88:1
$84 – Buyers – 5.5:1 – 200 Day Moving Average
$83 – Sellers – 1.4:1
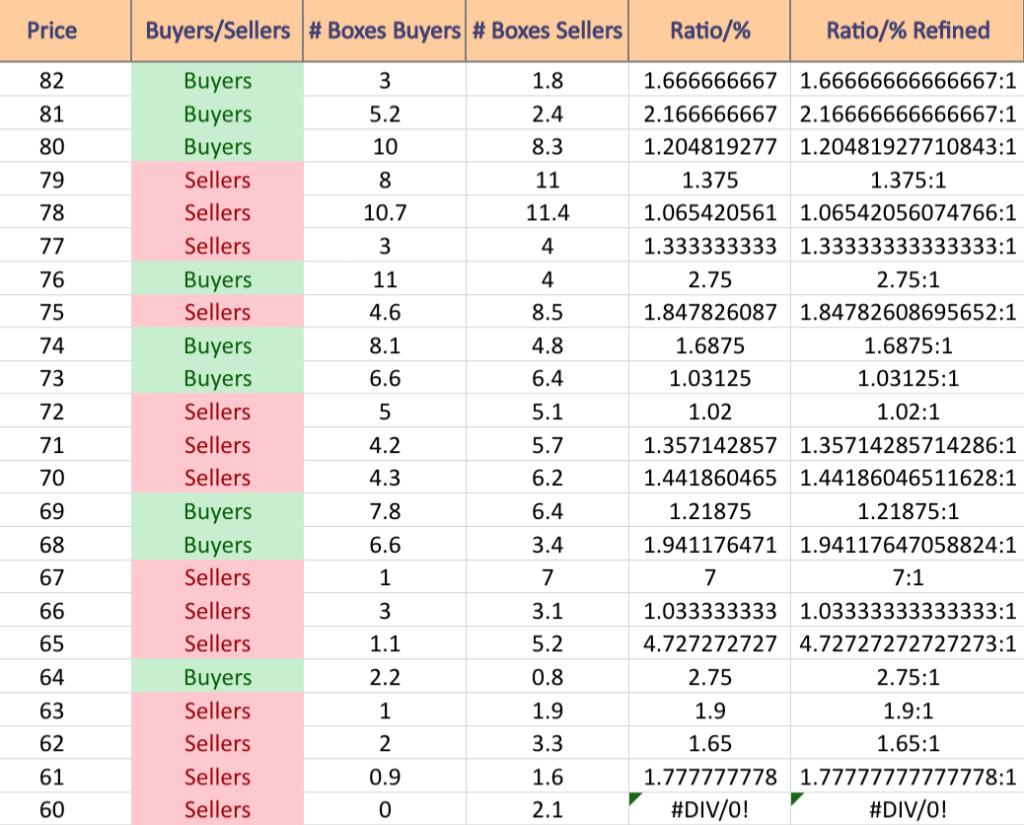
$82 – Buyers – 1.67:1
$81 – Buyers – 2.17:1
$80 – Buyers – 1.20:1
$79 – Sellers – 1.38:1
$78 – Sellers – 1.07:1
$77 – Sellers – 1.33:1
$76 – Buyers – 2.75:1
$75 – Sellers – 1.85:1
$74 – Buyers – 1.69:1
$73 – Buyers – 1.03:1
$72 – Sellers – 1.02:1
$71 – Sellers – 1.36:1
$70 – Sellers – 1.44:1
$69 – Buyers – 1.22:1
$68 – Buyers – 1.94:1
$67 – Sellers – 7:1
$66 – Sellers – 1.03:1
$65 – Sellers – 4.73:1
$64 – Buyers – 2.75:1
$63 – Sellers – 1.9:1
$62 – Sellers – 1.65:1
$61 – Sellers – 1.78:1
$60 – Sellers – 2.1:0*
Tying It All Together
The list & image above paint the picture as to how investors & traders have behaved at various price levels that ORCL has been at over the past one-to-two years.
It is not meant to serve as investment/trading advice, and is simply a way to visualize what investor/trader sentiment has been like at each of the price levels mentioned, as well as what it was at levels of support & resistance that are denoted in the image & list.
As always, do your own due diligence before making investing/trading decisions.
For more on the methodology on how the data was collected & put together, please refer to our original Price:Volume analysis.
*** I DO NOT OWN SHARES OR OPTIONS CONTRACT POSITIONS IN ORCL AT THE TIME OF PUBLISHING THIS ARTICLE ***