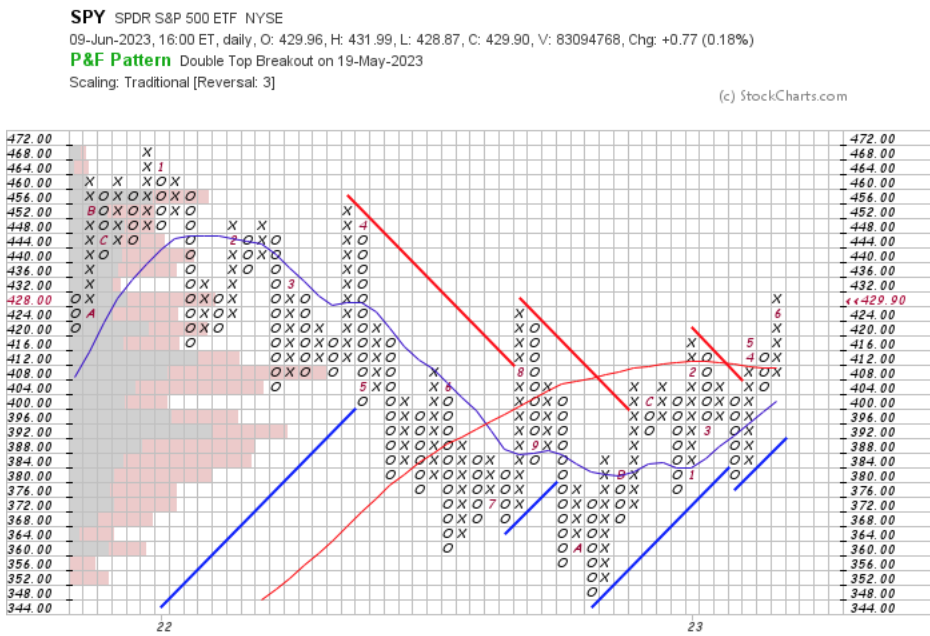
SPY, the SPDR S&P 500 ETF added +0.46% last week, with stocks remaining relatively flat in the index all week, prior to Thursday’s session & Friday’s +0.18% gap up day on a gravestone doji candlestick (we will jump into that in a moment).
Their RSI is approaching overbought levels at 66.68 (per Friday’s close), with volumes being average at best during the week compared to the year prior, as this week’s data & rates announcements are high on investors’ minds.
SPY’s MACD is still showing bullishness, but their candlesticks are signaling a bit of uncertainty amongst investors.
Monday through Thursday, their candles look like a shelf of books, all tightly tied to the closing price of the previous Friday’s session (which also happened to be a gap up).
The gravestone doji is a major showing of uncertainty, if not bearishness, as the day’s session had enough range of prices to create the shadows of the candlestick, but the opening & closing price were near identical, and on the lower end of the day’s overall trading range.
Clearly, there are some concerns about the near-term future performance about the S&P 500, which the CPI, PPI & Fed interest rate announcement are causing.
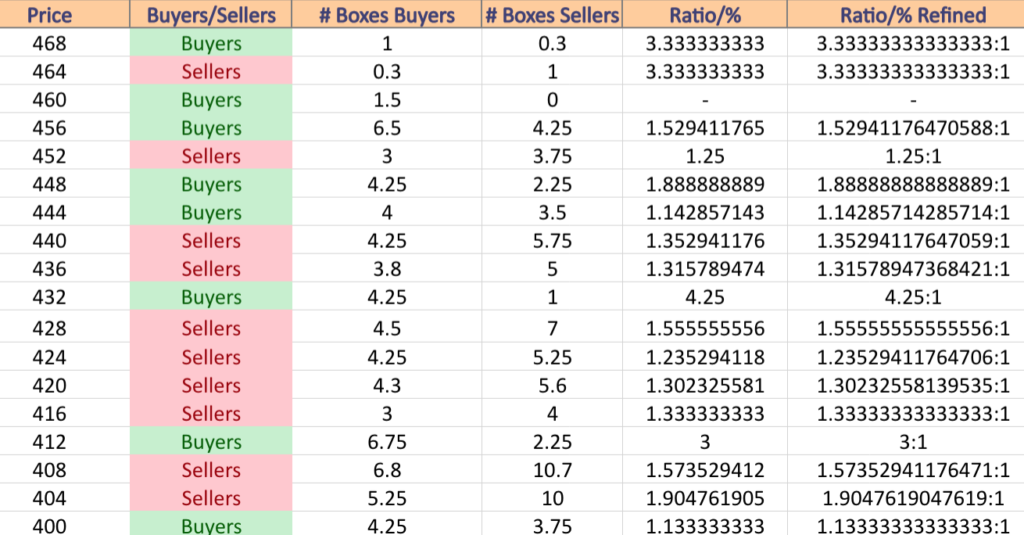
SPY has support at the $426.37 (Volume Sentiment: Sellers, 1.56:1), $424.85 (10 Day Moving Average; Volume Sentiment: Sellers, 1.56:1) , $416.72 (Volume Sentiment: Sellers, 1.33:1) & $414.13/share (50 Day Moving Average; Volume Sentiment: Buyers, 3:1) price levels, with resistance at the $438.53 (Volume Sentiment: Sellers, 1.32:1), $442.12 (Volume Sentiment: Sellers, 1.35:1), $449.09 (Volume Sentiment: Buyers, 1.89:1) & $454.37/share (Volume Sentiment: Sellers, 1.25:1) price levels.
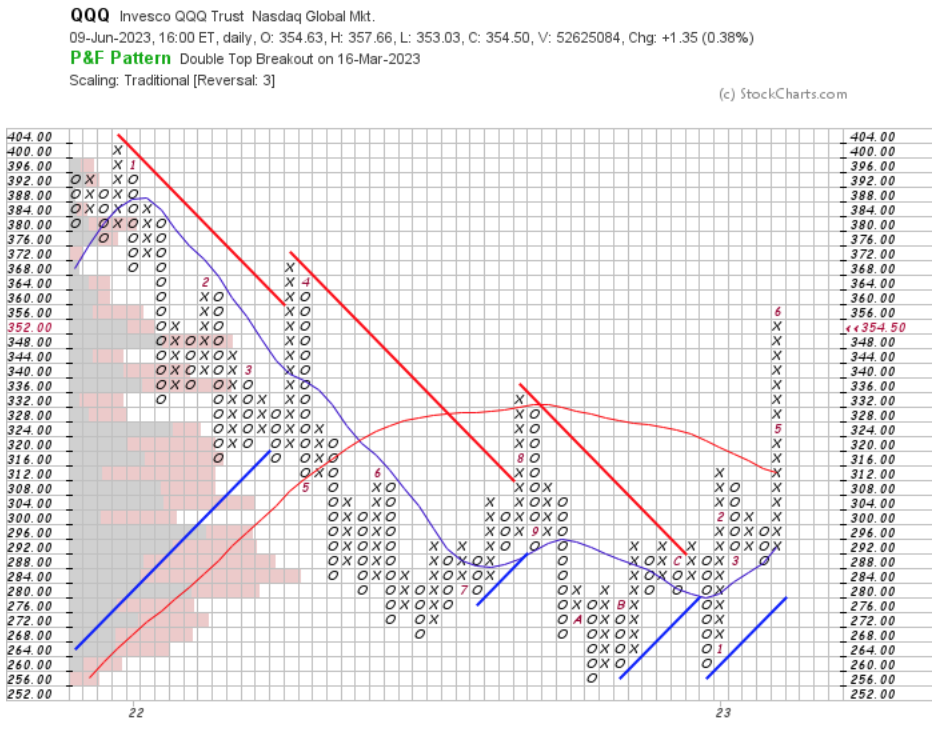
QQQ, the Invesco QQQ Trust ETF took a modest -0.04% decline last week, in a slightly more bearish, but similar appearing week to the S&P 500.
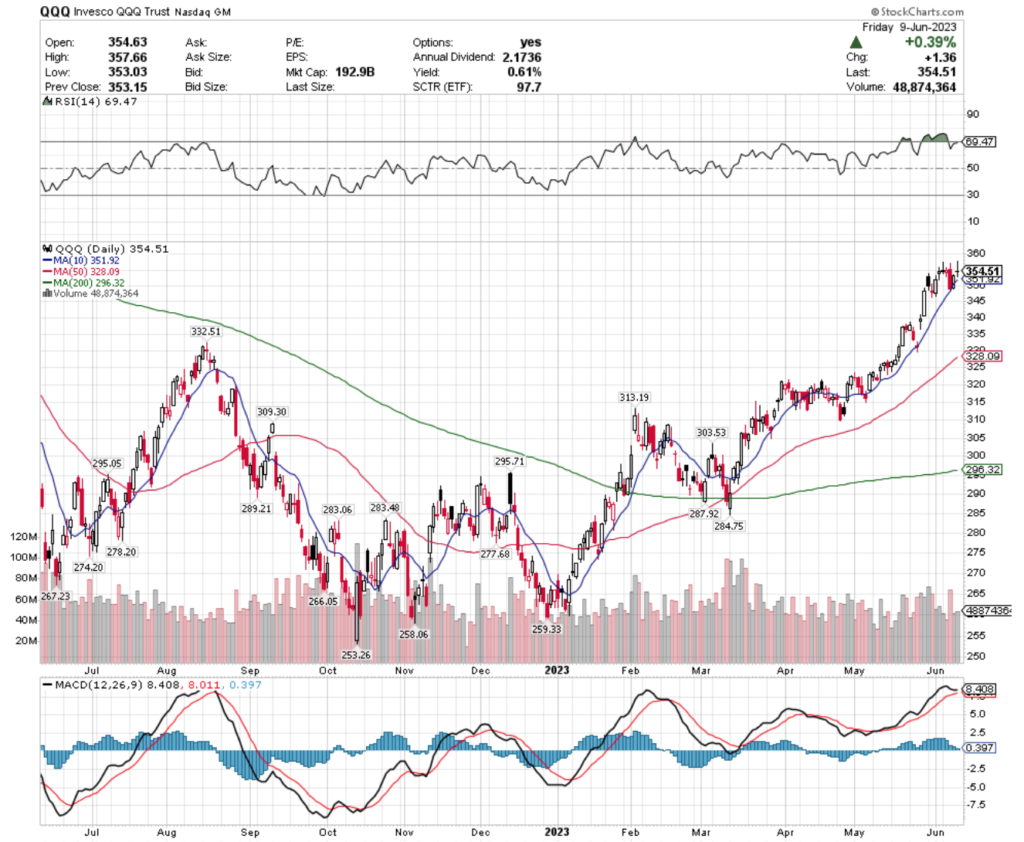
Their RSI looks set to cross back into overbought territory after closing on Friday at 69.47, but trading volumes all week were nothing spectacular & their MACD looks ready to make a bearish crossover in the coming days’ sessions.
QQQ’s Monday through Thursday candlesticks also behaved as an extension of the range that the previous Friday’s gap up created, with a similar gravestone doji candlestick on Friday’s +0.39% gap up session.
It goes without saying that this would be the case for the tech heavy NASDAQ index, who would be more adversely impacted by further interest rate hikes, whether one happens on Wednesday, or one becomes evident in the coming months based on the data being reported Tuesday & Wednesday before the announcement.
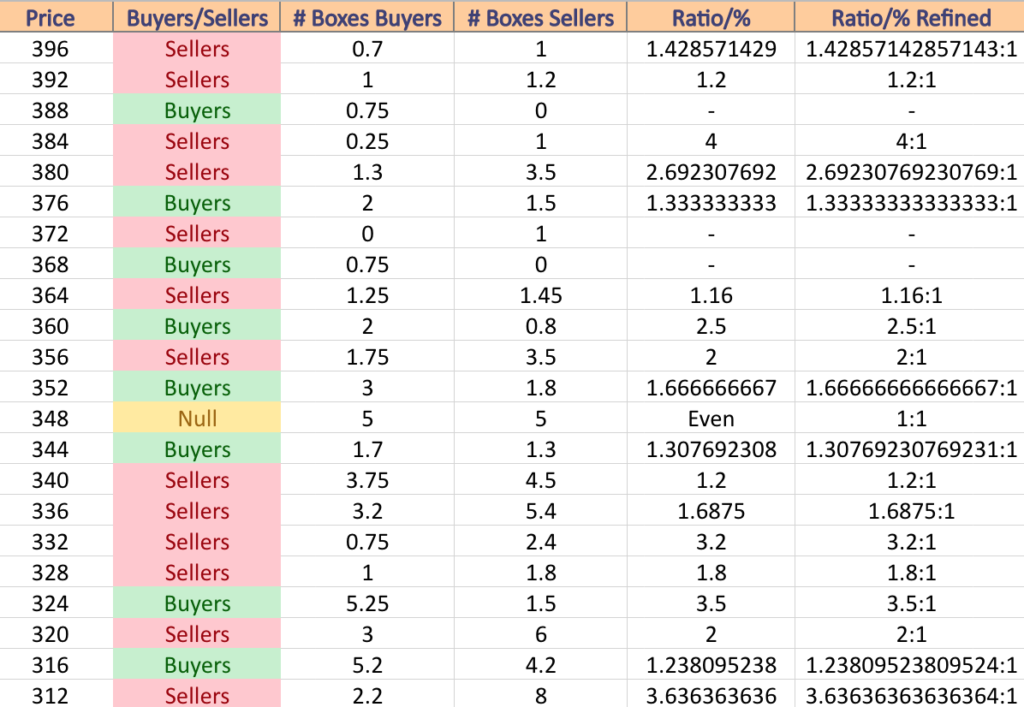
QQQ has support at the $351.92 (10 Day Moving Average; Volume Sentiment: Even, 1:1), $332.51 (Volume Sentiment: Sellers, 3.2:1), $328.09 (50 Day Moving Average; Volume Sentiment: Sellers, 1.8:1) & $313.19 (Volume Sentiment: Sellers, 3.64:1), with resistance a the $368.99 (Volume Sentiment: Buyers, 0.75:0*), $375.07 (Volume Sentiment: Sellers, 1:0*) , $378.49 (Volume Sentiment: Buyers, 1.33:1) & $401/share (Volume Sentiment: Even, 0:0*).
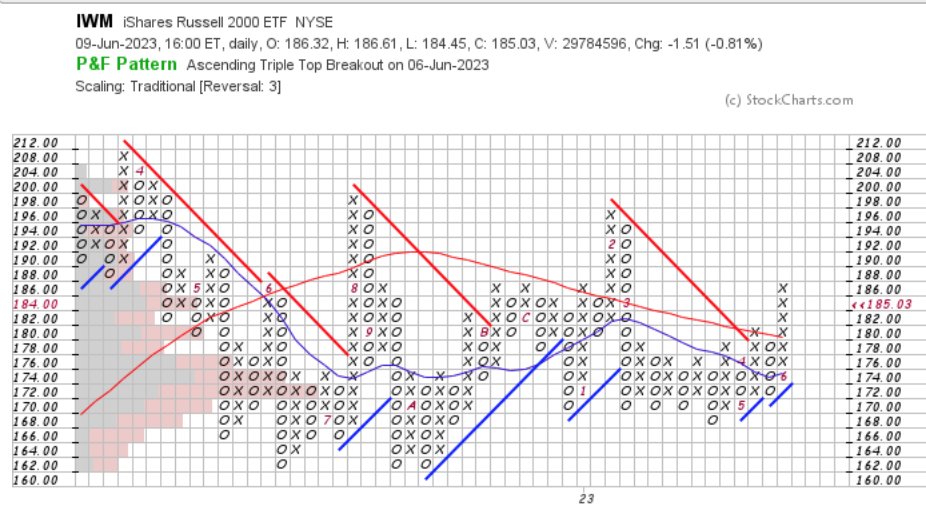
IWM, the iShares Russell 2000 ETF gained +1.93% last week, as investors retreated to safety in small cap stocks in anticipation of further uncertainty.
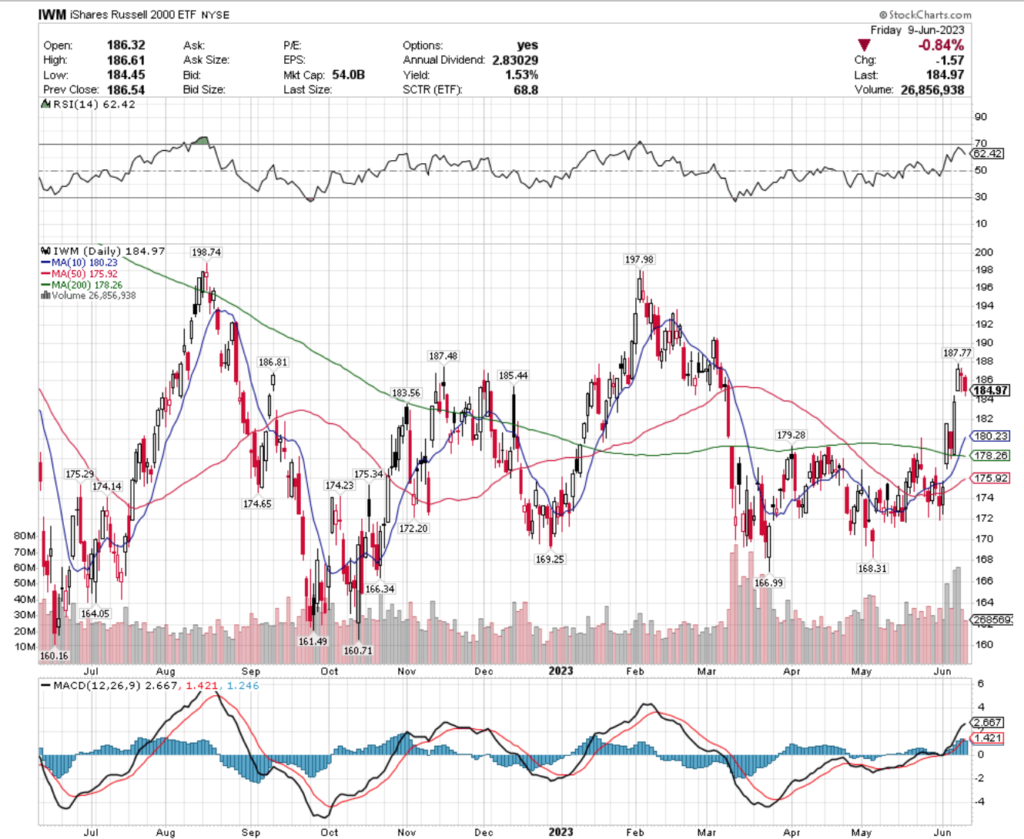
To no surprise, the small cap oriented Russell 2000’s chart offers a different view than the S&P 500 & NASDAQ’s, with IWM’s RSI being at 62.42 & with the week’s overall volume being above average compared to the year prior.
Their MACD has been in a steep bullish incline, but is beginning to show signs of faltering in the near-term.
Friday’s session confirmed that even the investors who flocked into the small cap names are still on edge & nervous, as Wednesday’s gap up was followed by a down session with a spinning top & then a -0.84% Friday session.
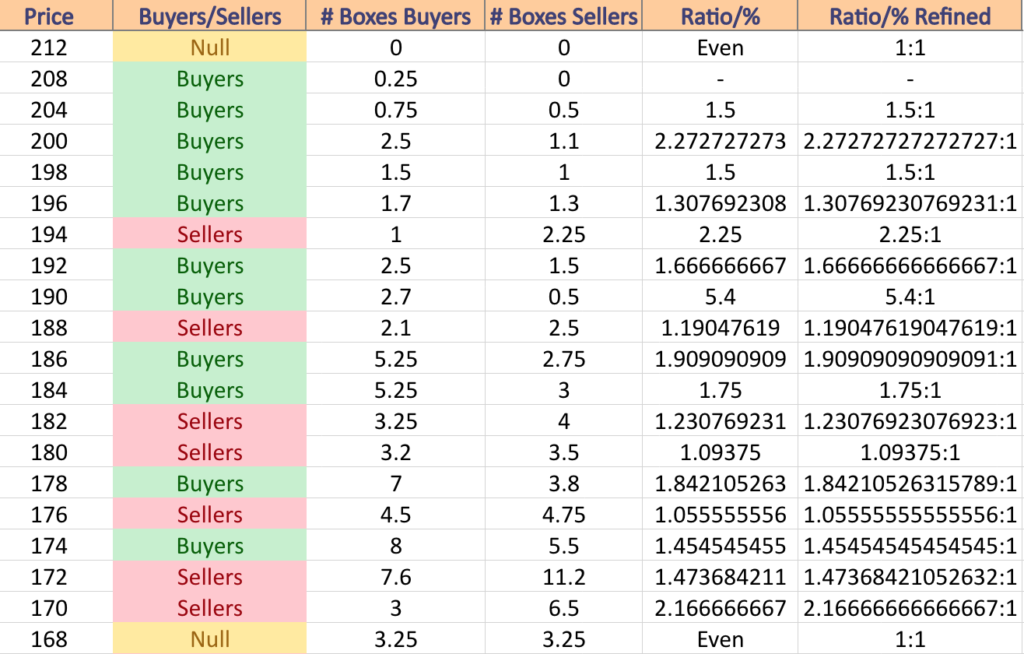
IWM has support at the $183.56 (Volume Sentiment: Sellers, 1.23:1), $180.23 (10 Day Moving Average; Volume Sentiment: Sellers, 1.1:1), $179.28 (Volume Sentiment: Buyers, 1.84:1) & $178.26/share (200 Day Moving Average; Volume Sentiment: Buyers, 1.84:1) , with resistance at the $185.44 (Volume Sentiment: Buyers, 1.84:1) , $186.81 (Volume Sentiment: Buyers, 1.91:1), $187.48 (Volume Sentiment: Buyers, 1.91:1) & $187.77/share (Volume Sentiment: Buyers, 1.91:1) price levels.
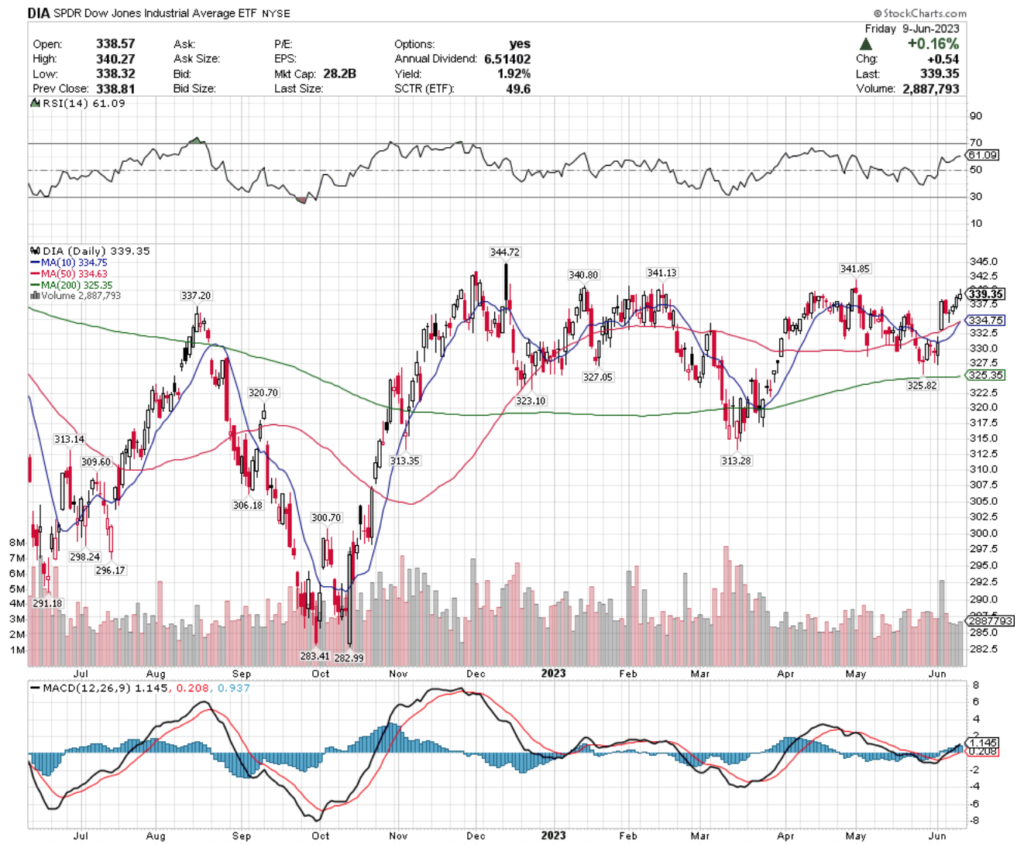
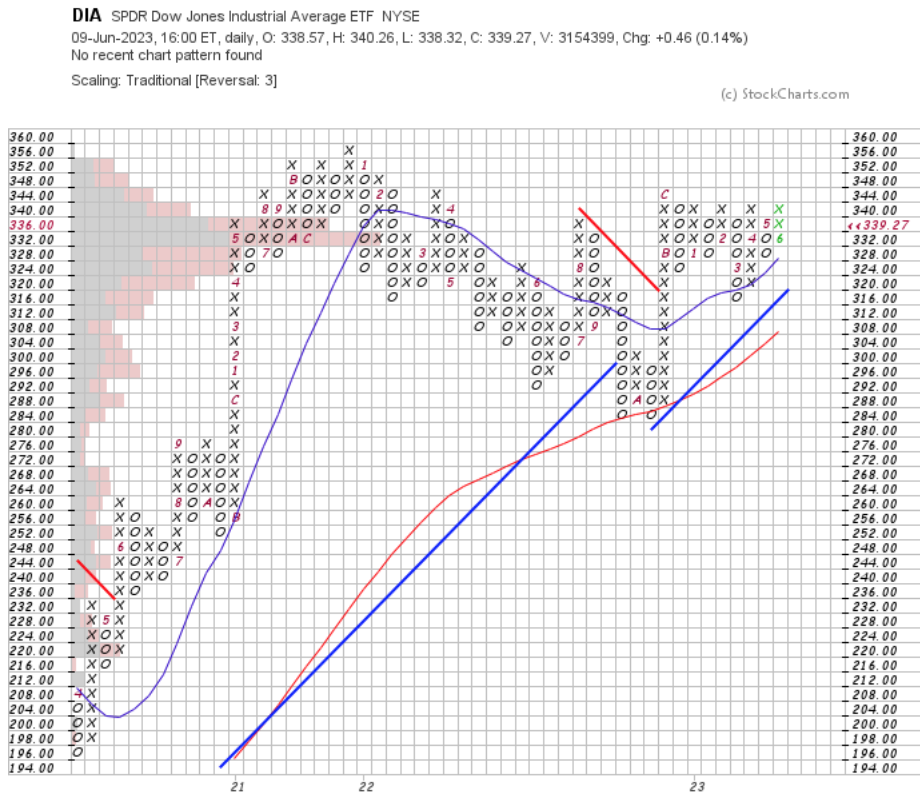
DIA, the SPDR Dow Jones Industrial Average ETF added +0.35% last week, started the week off on a down day, but managed to scrape together a decent week overall.

Their RSI is trending towards overbought, but remains at 61.09, but the week’s volumes were subdued compared to the year prior.
Their MACD is still bullish, but beginning to show signals of weakening sentiment.
Tuesday’s dragonfly doji prompted the rally into the end of the week after Monday’s losses, but their upcoming resistance tests pose some difficulty for the index.
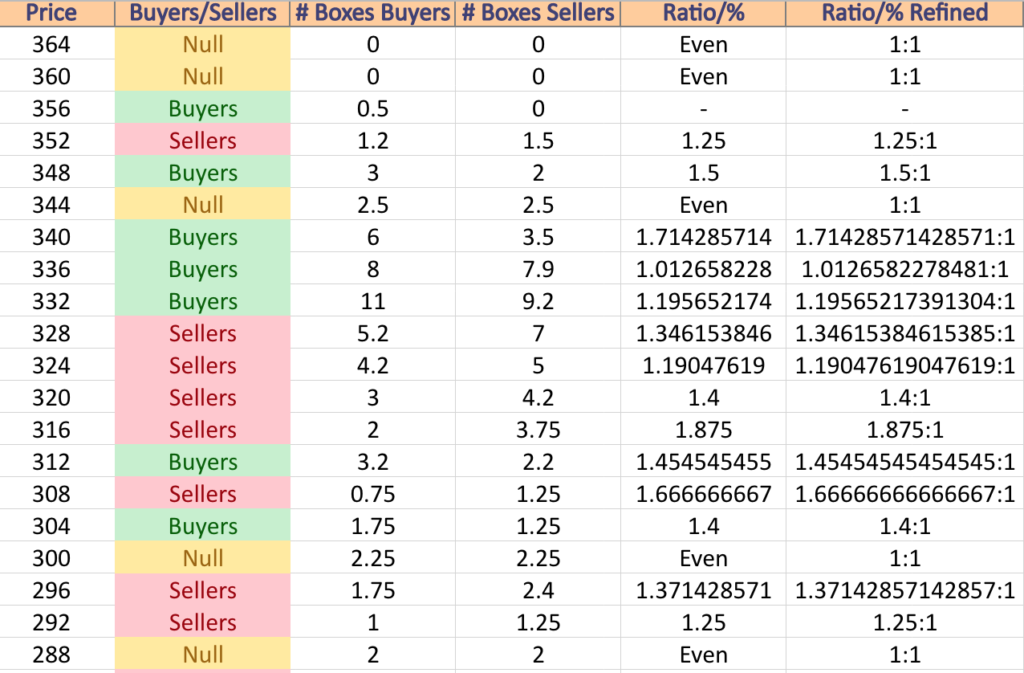
DIA has support at the $337.20 (Volume Sentiment: Buyers, 1.01:1), $334.75 (10 Day Moving Average; Volume Sentiment: Buyers, 1.20:1), $334.63 (50 Day Moving Average; Volume Sentiment: Buyers, 1.20:1) & $327.05/share (Volume Sentiment: Sellers, 1.19:1) & resistance at the $340.80 (Volume Sentiment: Buyers, 1.71:1) , $341.13 (Volume Sentiment: Buyers, 1.71:1) , $341.85 (Volume Sentiment: Buyers, 1.71:1) & $344.72/share (Volume Sentiment: Even 1:1) price levels.
Semiconductors (SOXL), Brazil (BRZU), Latin America 40 (ILF) & Housing (HOMZ) Have All Been Bullishly Leading The Market
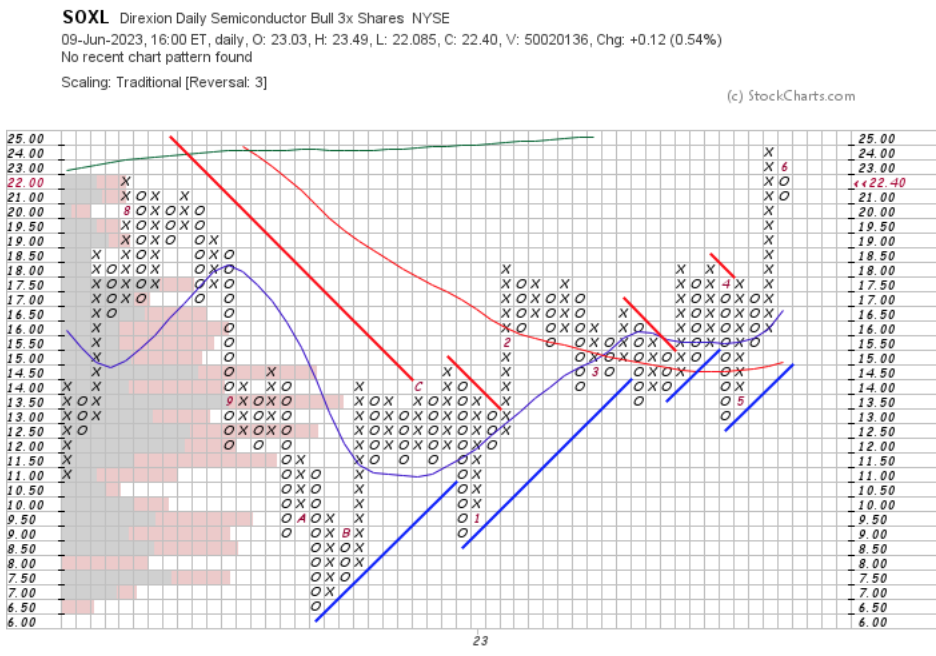
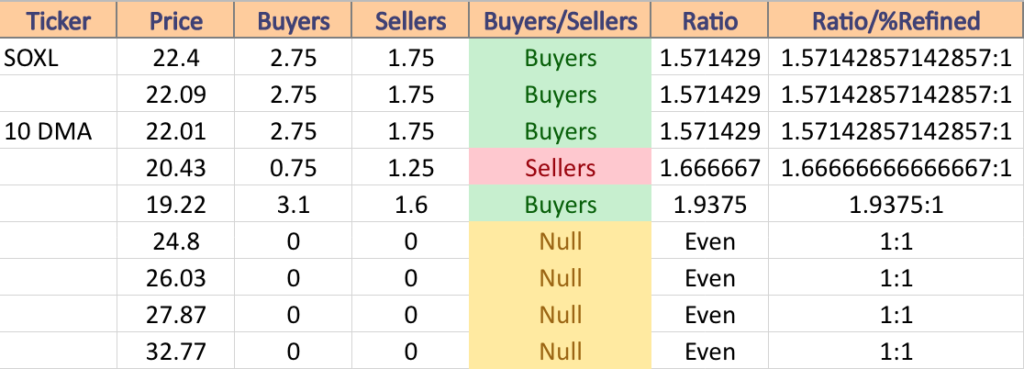
SOXL, the Direxion Daily Semiconductors Bull 3x Shares ETF has gained +45.44% over the past year, gaining an impressive +260.71% since its 52-week low in October of 2022 (ex-distributions), to close at $22.40/share (Volume Sentiment: Buyers, 1.57:1).
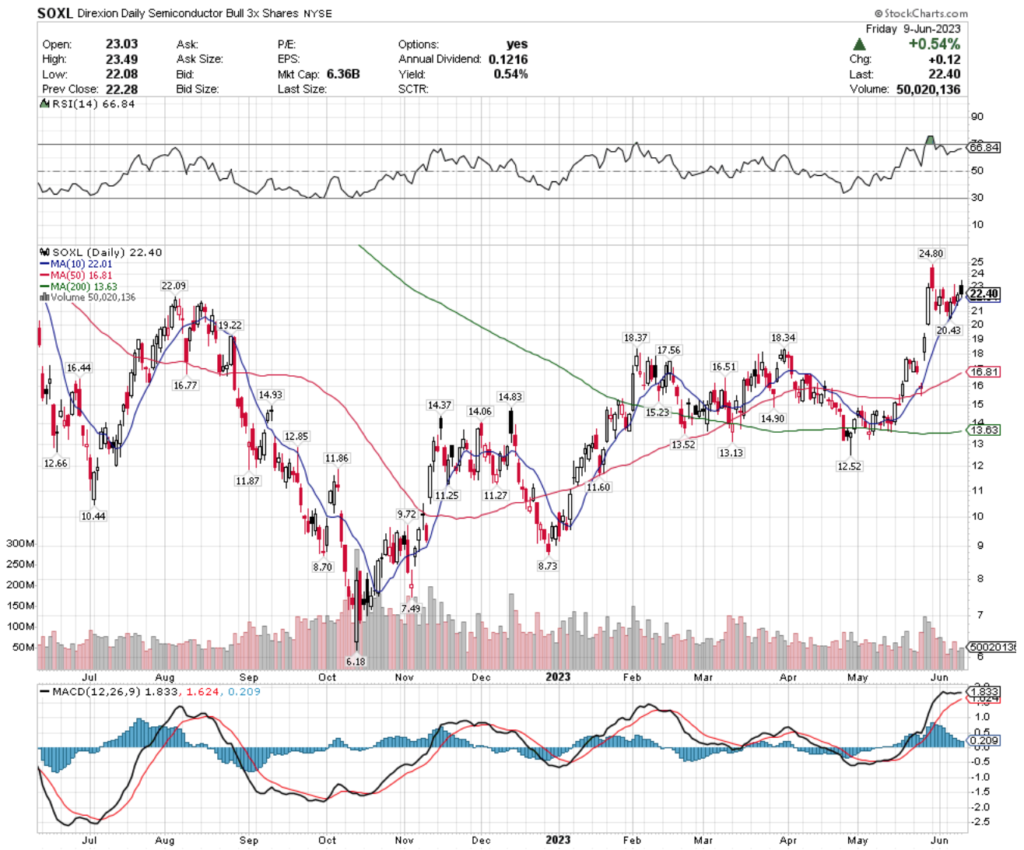
Their RSI is approaching overbought territory (at 66.84 at Friday’s close), but their MACD is beginning to signal a bearish crossover in the coming week.
Weaker than average volumes last week compared to the week prior confirm investors are feeling on the fence with SOXL & their sentiment is a signal of impending weakness.
Last week’s candlesticks’ opening & closing levels being tied tightly to a $22-range also confirm that investors are feeling on the fence at the moment.
Their 0.54% distribution yield does not provide much of a cushion to protect against losses.
Shareholders who are not looking to trim positions should have an insurance policy (selling calls, buying puts) & non-shareholders should be eyeing how they behave around their support levels in the near-term to find where they might like to enter a position when an uptrend has been established.
SOXL has support at the $22.09 (Volume Sentiment: Buyers, 1.57:1), $22.01 (10 Day Moving Average; Volume Sentiment: Buyers, 1.57:1), $20.43 (Volume Sentiment: & $19.22 (Volume Sentiment: Buyers, 1.94:1) , with resistance at the $24.80 (Volume Sentiment: NULL, 0:0*), $26.03 (Volume Sentiment: NULL, 0:0*), $27.87 (Volume Sentiment: NULL, 0:0*) & $32.77/share (Volume Sentiment: NULL, 0:0*) price levels.
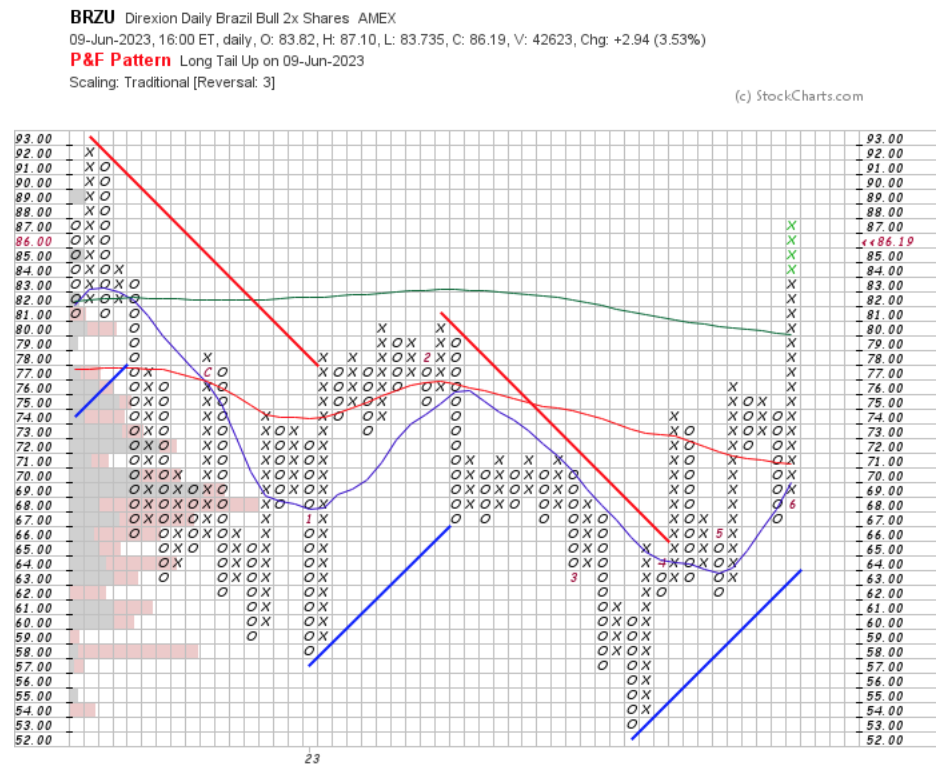
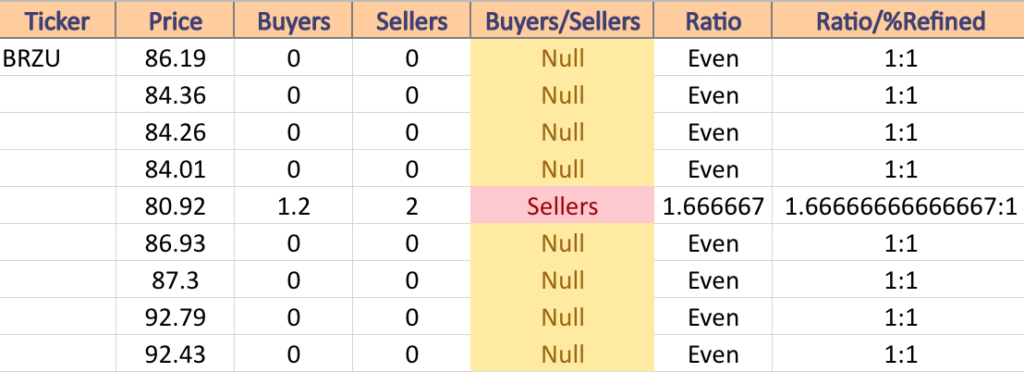
BRZU, the Direxion Daily Brazil Bull 2x Shares ETF has climbed +22.47% over the past year, posting a +62.7% gain since their 52-week low in February of 2023 (ex-distributions) to close at $86.19/share on Friday (Volume Sentiment: Even, 0:0*).
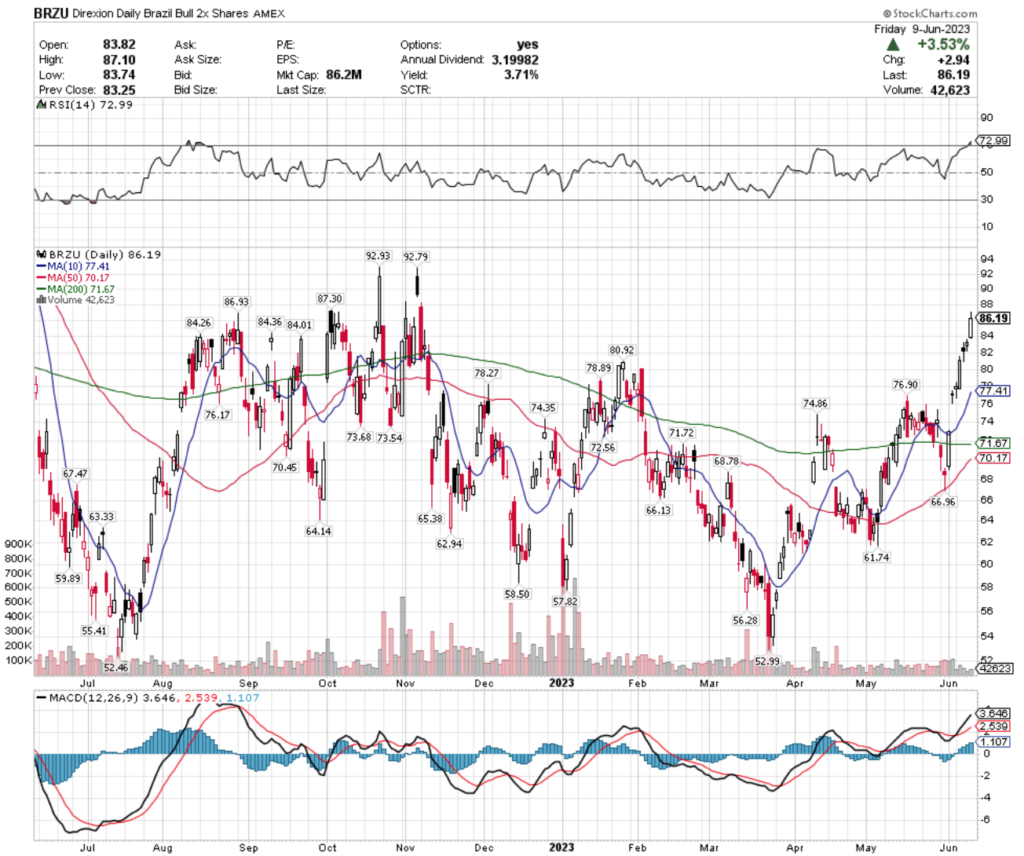
Their RSI is overbought at 72.99 (per Friday’s close), after the prior Friday’s gap up spurred an +11.67% climb last week.
While their MACD is still bullish, volumes have been lighter than the year prior’s average, signaling uncertainty, which is confirmed by the many spinning top candlesticks of last week & Friday’s candle’s open & close occupying the bottom of the candle, with an upper shadow but no lower shadow.
BRZU pays a 3.71% distribution yield, which offers some protection for investors against losses, but an additional insurance policy through an options strategy would be wise in the near-term, while watching their behavior at support levels.
BRZU has support at the $84.36 (Volume Sentiment: NULL, 0:0*), $84.26 (Volume Sentiment: NULL, 0:0*), $84.01 (Volume Sentiment: NULL, 0:0*) & $80.92/share (Volume Sentiment: Sellers, 1.67:1) price levels, with resistance at the $86.93 (Volume Sentiment: NULL, 0:0*), $87.30 (Volume Sentiment: NULL, 0:0*), $92.79 (Volume Sentiment: NULL, 0:0*) & $92.93/share (Volume Sentiment: NULL, 0:0*) price levels, with resistance at the $86.93 (Volume Sentiment: NULL, 0:0*), $87.30 (Volume Sentiment: NULL, 0:0*), $92.79 (Volume Sentiment: NULL, 0:0*) & $92.93/share (Volume Sentiment: NULL, 0:0*) price levels.
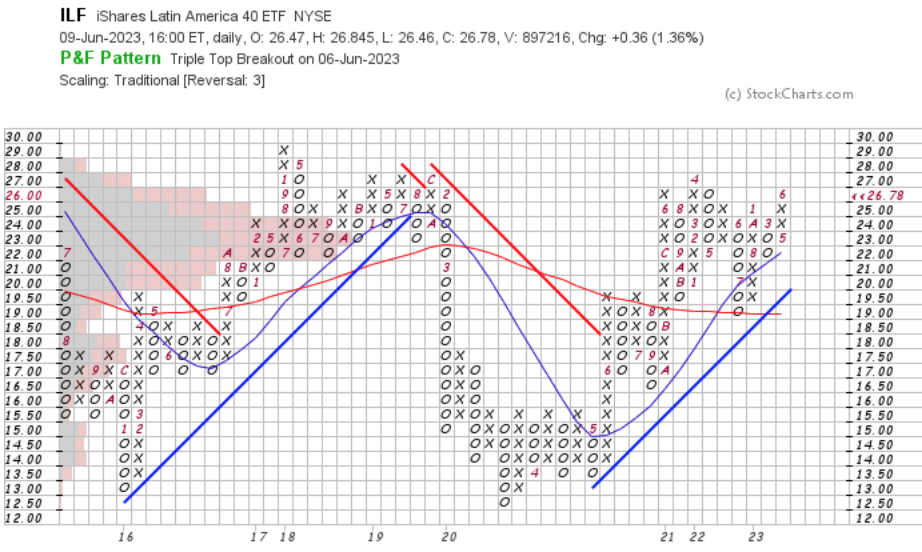
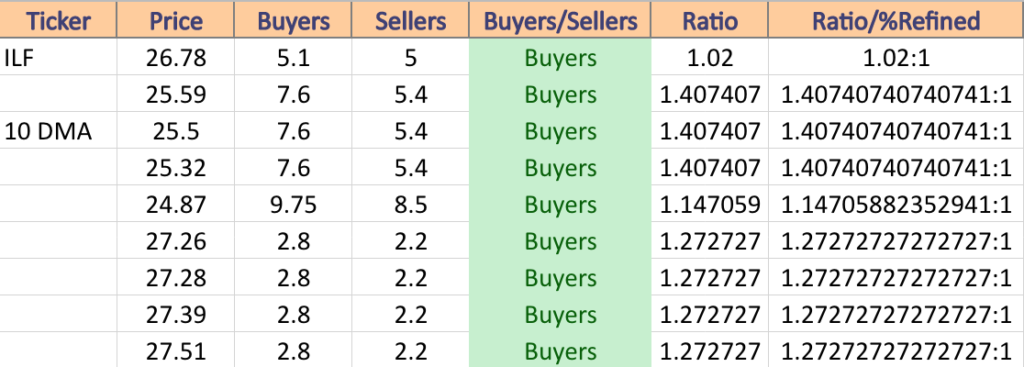
ILF, iShares Latin America 40 ETF has risen +23.77% over the past year, notching +29.1% since their 52-week low of July in 2022 (ex-distributions) to close at $26.78/share (Volume Sentiment: Buyers, 1.02:1).
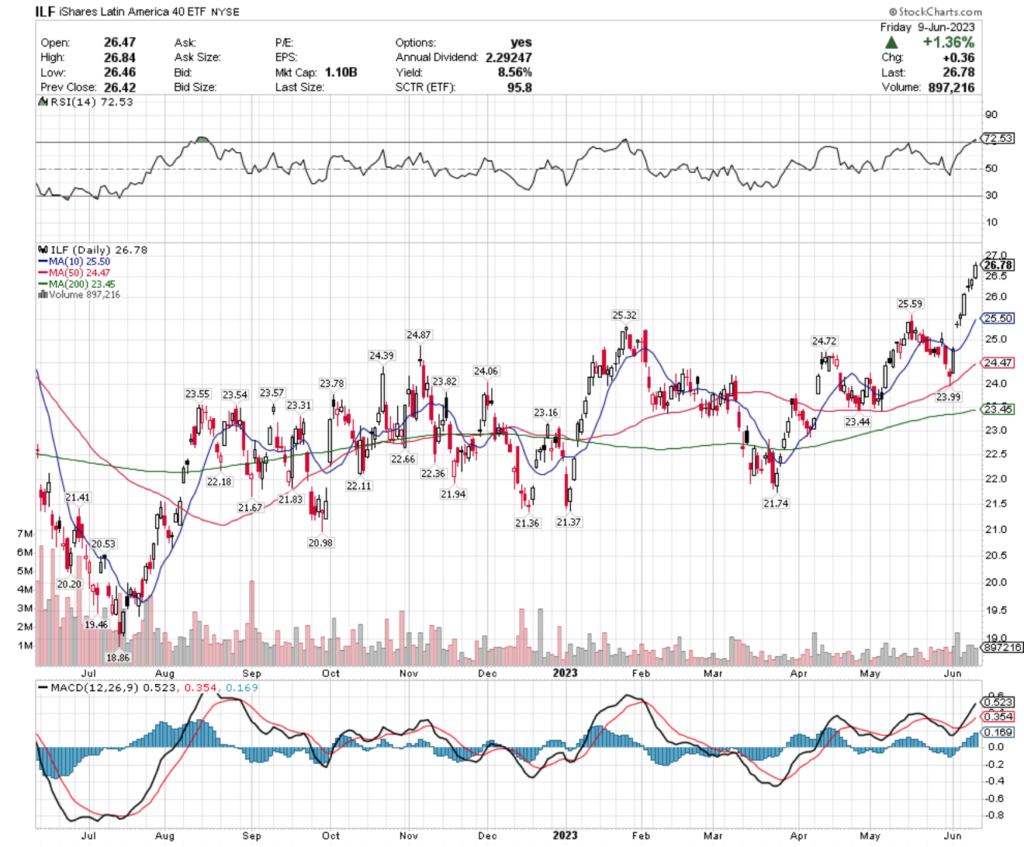
Their RSI is overbought at 72.53 & their MACD is bullish, after last week’s rally continued the jump of the previous Friday’s gap up session.
Last week’s volumes were below average compared to the week prior, which when combined with the candlesticks of the week signal that investors are beginning to feel nervous in the near-term & a consolidation is imminent.
ILF offers an 8.56% distribution yield, which will provide some protection against declines, but shareholders should be looking for an insurance play to protect themselves in the near-term, while watching their behavior at support levels.
ILF has support at the $25.59 (Volume Sentiment: Buyers, 1.41:1), $25.50 (10 Day Moving Average; Volume Sentiment: Buyers, 1.41:1), $25.32 (Volume Sentiment: Buyers, 1.41:1) & $24.87/share (Volume Sentiment: Buyers, 1.15:1) price levels, with resistance at the $27.26 (Volume Sentiment: Buyers, 1.27:1), $27.28 (Volume Sentiment: Buyers, 1.27:1), $27.39 (Volume Sentiment: Buyers, 1.27:1) & $27.51/share (Volume Sentiment: Buyers, 1.27:1) price levels.
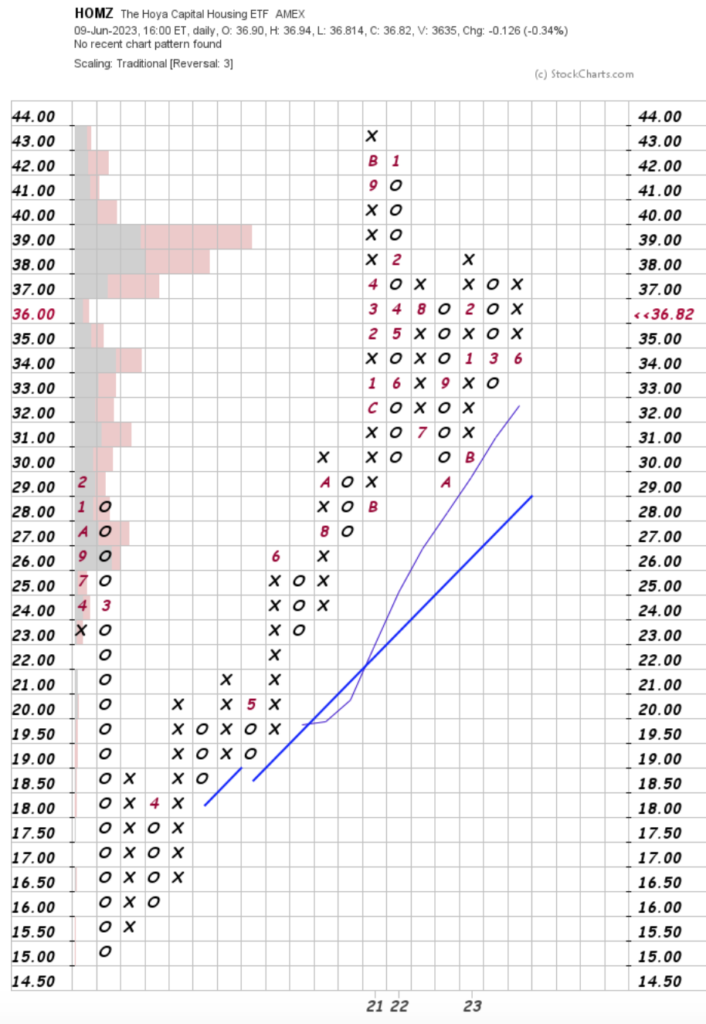
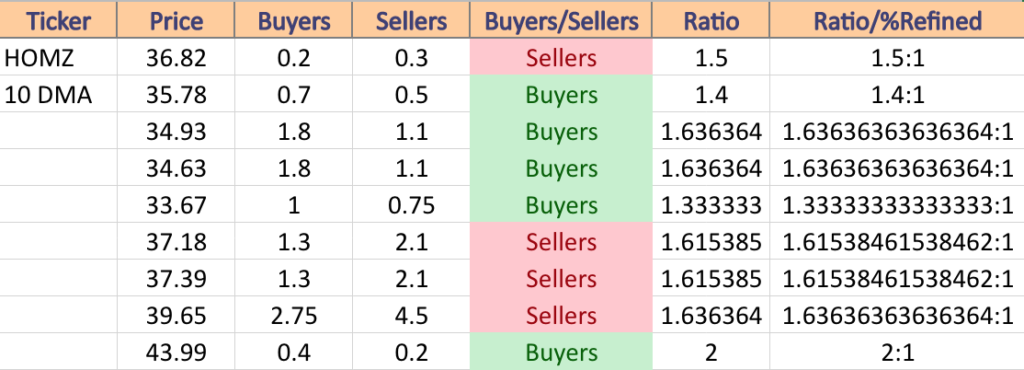
HOMZ, the Hoya Capital Housing ETF has posted +17.42% gains over the past year, climbing +27.1% from their 52-week low in October of 2022 (ex-distributions) to close at $36.82/share (Volume Sentiment: Sellers, 1.15:1).
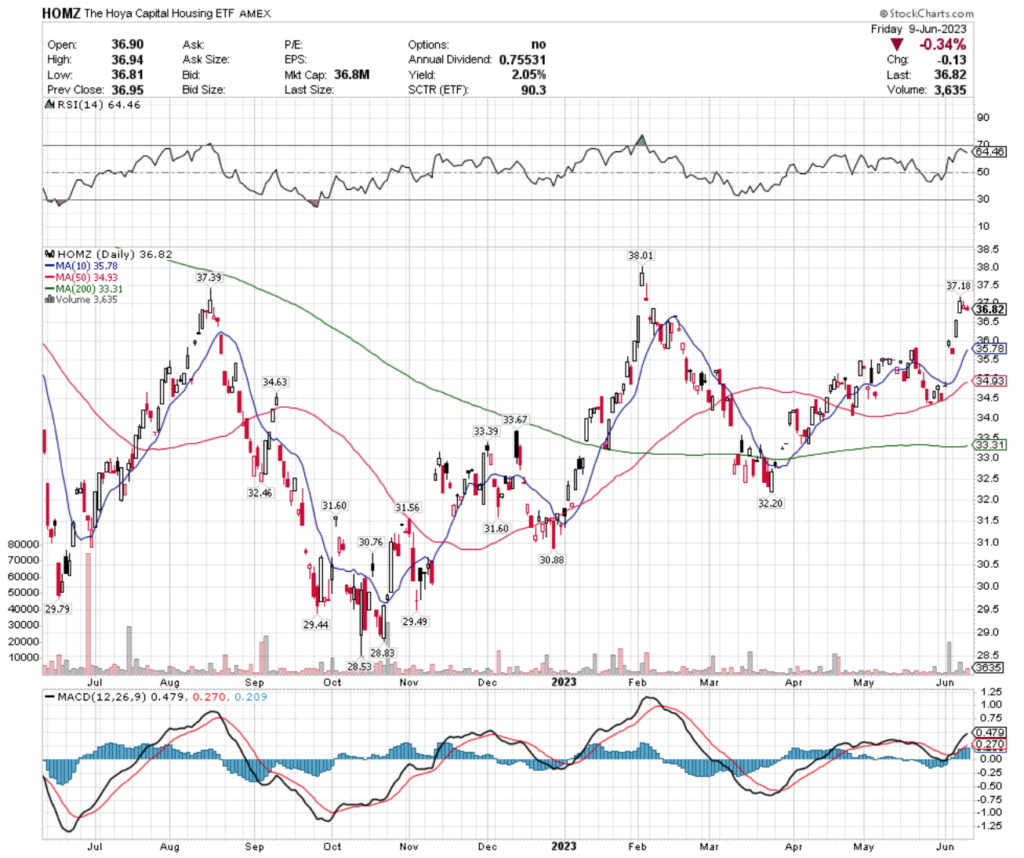
Their RSI is returning towards neutral, but still close to overbought at 64.46 & their MACD looks primed to roll over bearish in the near-term.
Wednesday’s gap up session was followed by two days whose price action was entirely contained within the range of Wednesday’s candle, showing that investors are somewhat unsure as to which way to go.
While they offer a 2.05% distribution yield as a cushion, caution should be exercised in regards to opening a new position until seeing how their support levels hold up in the near-term, and trading an insurance style options strategy in the meantime will provide portfolio protection until a stronger uptrend emerges.
HOMZ has support at the $35.78 (10 Day Moving Average; Volume Sentiment: Buyers, 1.4:1), $34.93 (50 Day Moving Average; Volume Sentiment: Buyers, 1.64:1), $34.63 (Volume Sentiment: Buyers, 1.64:1) & $33.67/share (Volume Sentiment: Buyers, 1.33:1) price levels, with resistance at the $37.18 (Volume Sentiment: Sellers, 1.62:1), $37.39 (Volume Sentiment: Sellers, 1.62:1), $39.65 (Volume Sentiment: Sellers, 1.64:1) & $43.99/share (Volume Sentiment: Buyers, 2:1).
Utilities (UTSL), Malaysia (EWM), Energy (PXI) & Zero Coupon 25+ U.S. Treasury (ZROZ) Have All Been Bearishly Lagging The Market
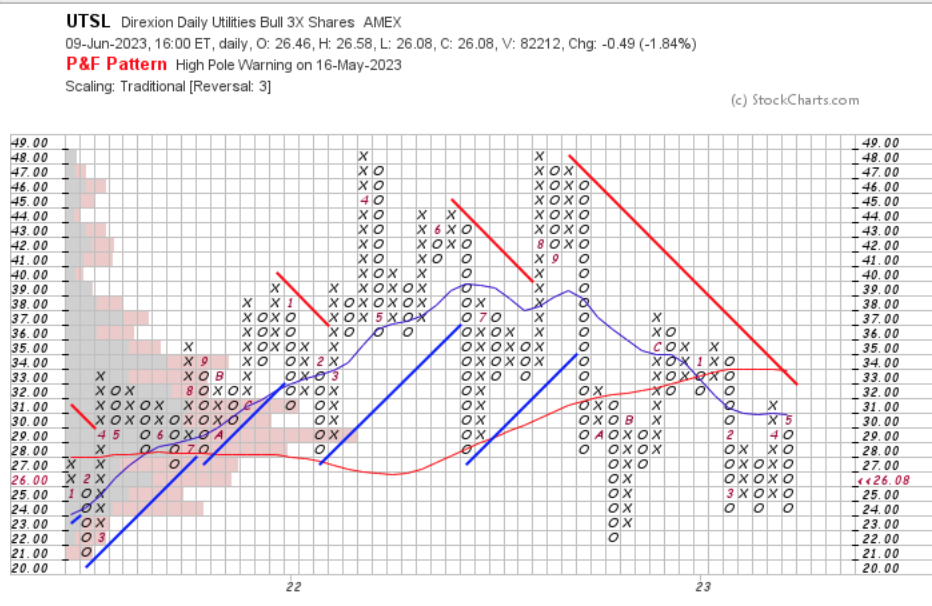
UTSL, the Direxion Daily Utilities Bull 3x Shares ETF has fallen -19.09% over the past year, losing -46.6% from their 52-week high in August of 2022, but reclaiming +19.03% from their 52-week low in October of 2022 (ex-distributions), to close at $26.08/share (Volume Sentiment: Buyers, 1.13:1).
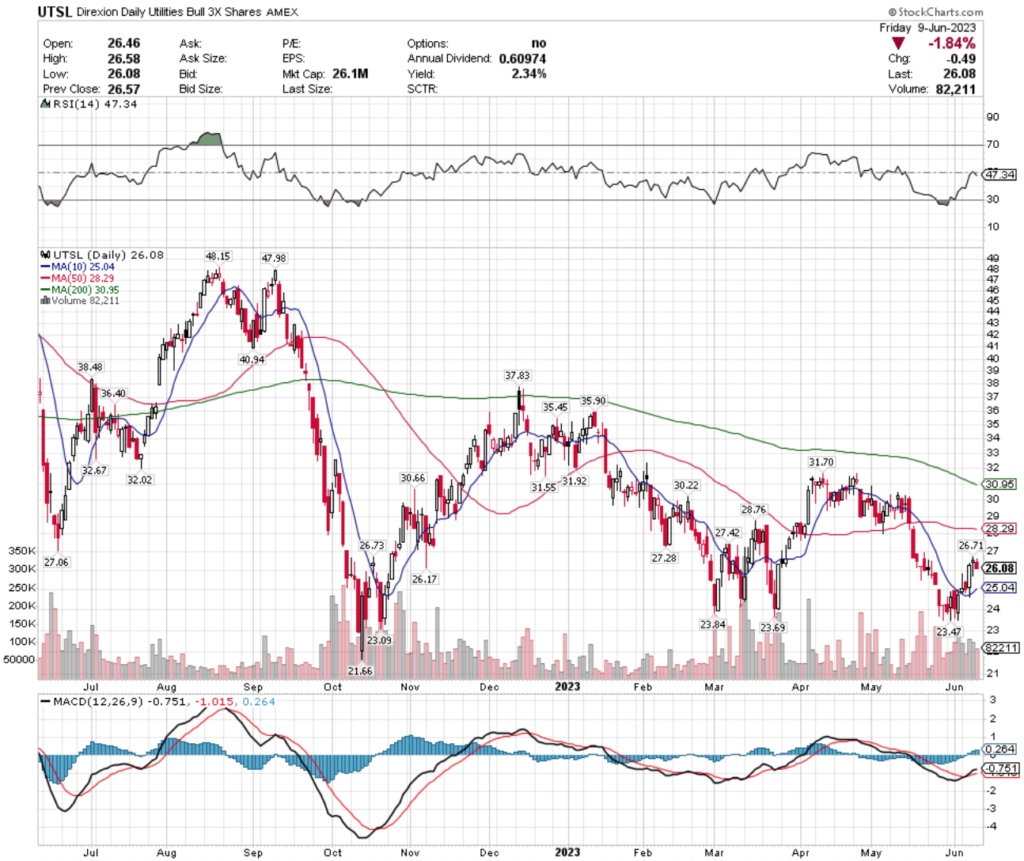
Their RSI is on the oversold end of neutral at 47.34, with last week’s volume being above average compared to the year prior.
However, their MACD is signaling further near-term weakness, with a bearish crossover on the horizon.
While their 2.34% distribution yield offers some form of protection against losses, unless trading an insurance strategy with options, it will be best to watch how their support levels hold up in the coming weeks before entering or adding to a position.
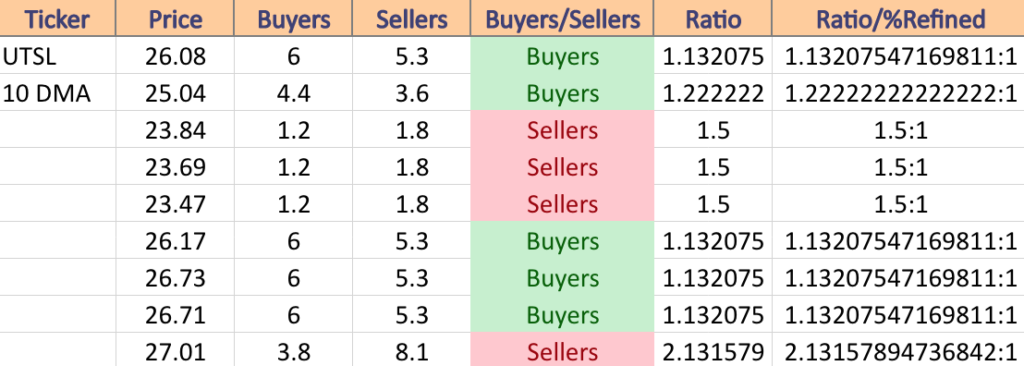
UTSL has support at the $25.04 (10 Day Moving Average; Volume Sentiment: Buyers, 1.22:1), $23.84 (Volume Sentiment: Sellers, 1.5:1), $23.69 (Volume Sentiment: Sellers, 1.5:1) & $23.47/share (Volume Sentiment: Sellers, 1.5:1) price levels, with resistance at the $26.17 (Volume Sentiment: Buyers, 1.13:1), $26.71 (Volume Sentiment: Buyers, 1.13:1) , $26.73 (Volume Sentiment: Buyers, 1.13:1) & $27.01/share (Volume Sentiment: Sellers, 2.13:1) price levels.
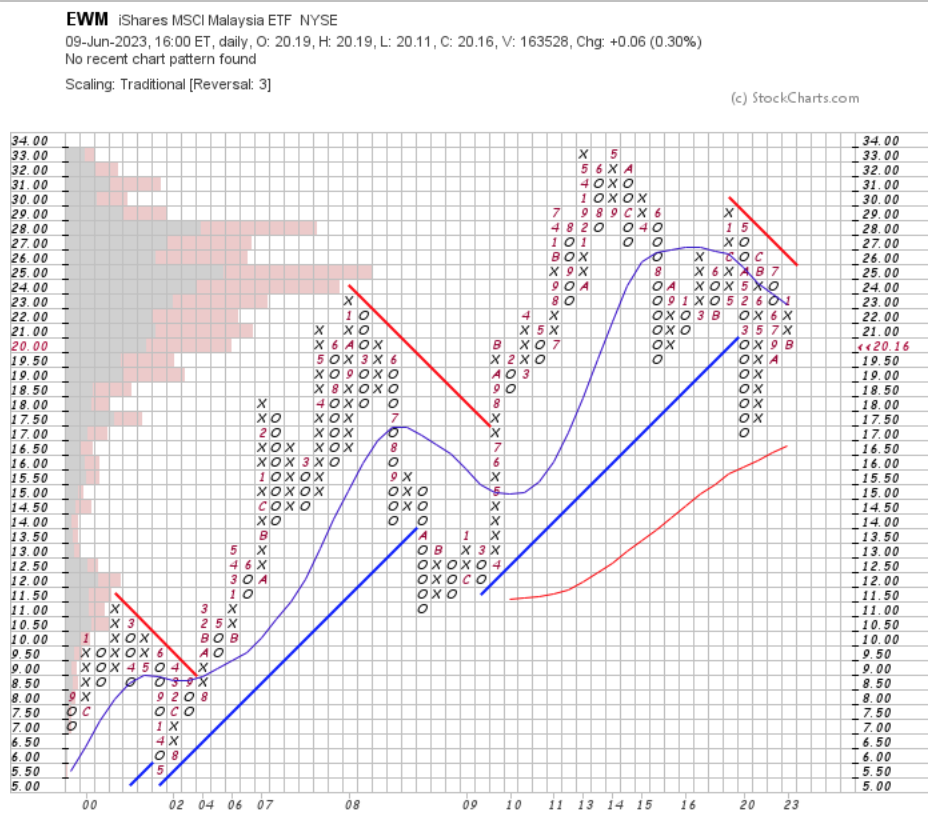
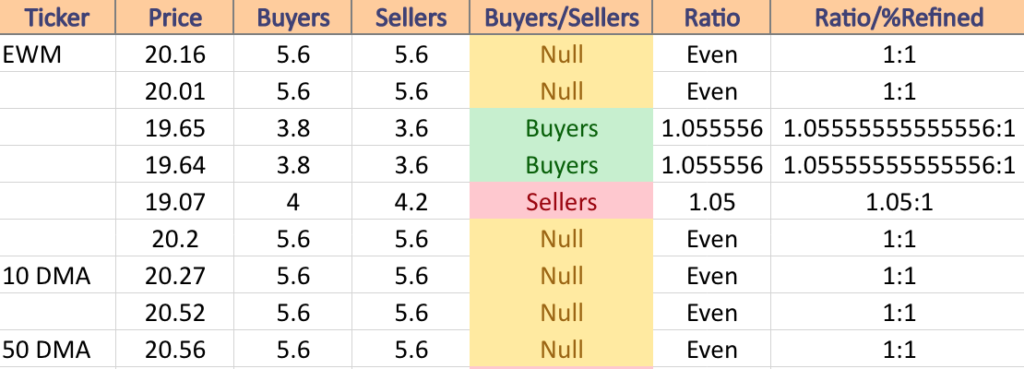
EWM, the iShares MSCI Malaysia ETF has lost -5.84% over the past year, losing -16.42% from their 52-week high in January of 2023, but has recovered +2.86% since their 52-week low in October of 2022 (ex-distributions), to close at $20.16/share (Volume Sentiment: Even, 1:1).
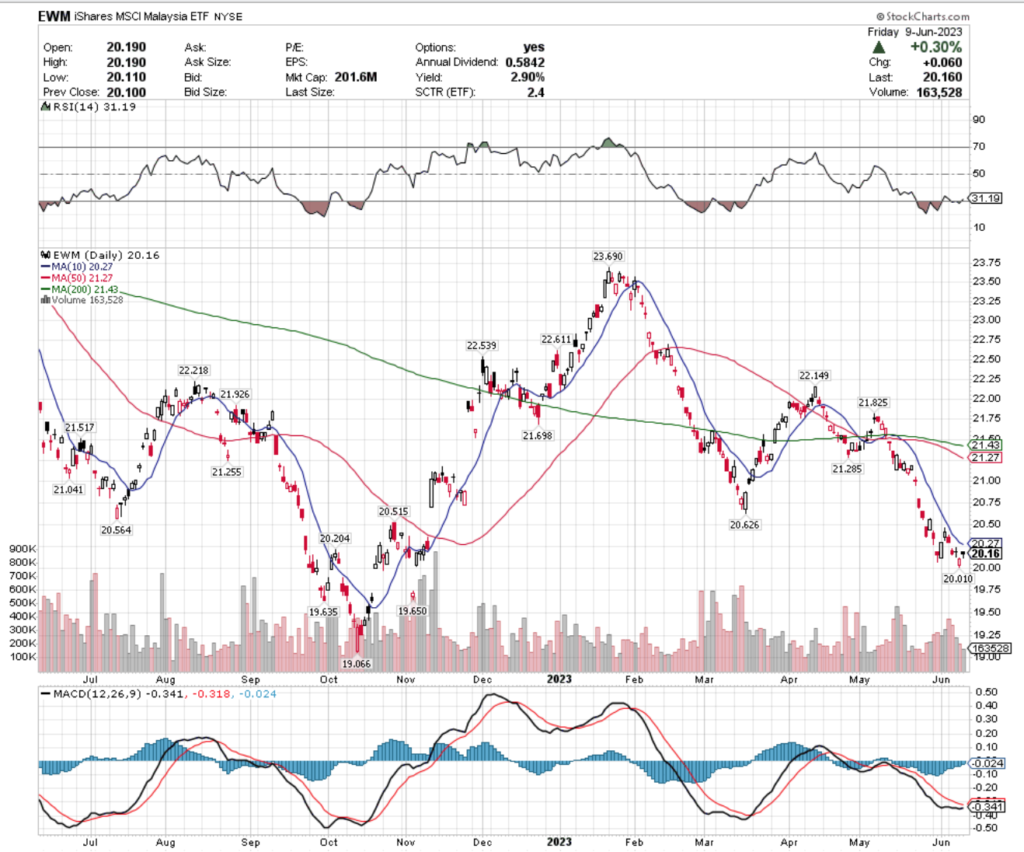
Their RSI is approaching oversold levels at 31.19, with last week’s volumes falling relatively in line with the year prior’s average.
Their MACD is about to cross over bullishly, which may help them break free of the range that their candlesticks were trading in on Tuesday, Wednesday & Friday.
Friday’s hanging man candle is a cause for concern among investors thought, and their distribution yield only provides 2.9% of protection against losses for longterm holders.
EWM has support at the $20.01 (Volume Sentiment: Even, 1:1), $19.65 (Volume Sentiment: Buyers, 1.06:1), $19.64 (Volume Sentiment: Buyers, 1.06:1) & $19.07/share (Volume Sentiment: Sellers, 1.05:1) & resistance at the $20.20 (Volume Sentiment: Even, 1:1), $20.27 (50 Day Moving Average; Volume Sentiment: Even, 1:1) , $20.52 (Volume Sentiment: Even, 1:1) & $20.56/share (Volume Sentiment: Even, 1:1) price levels.
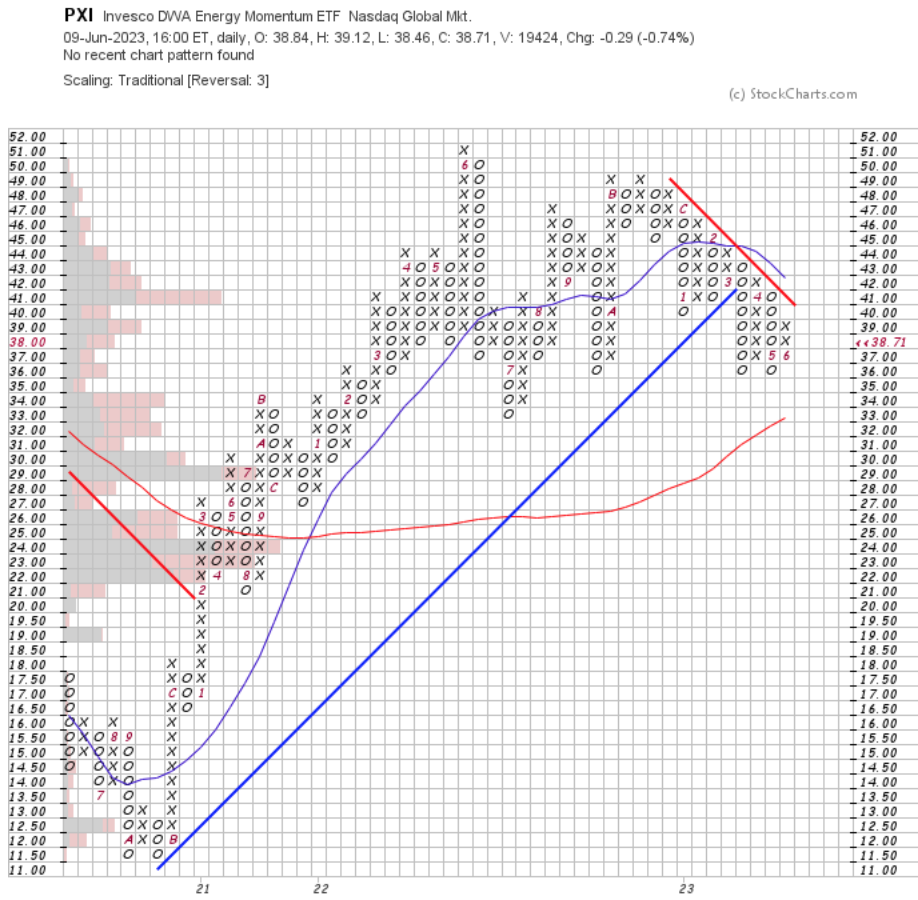
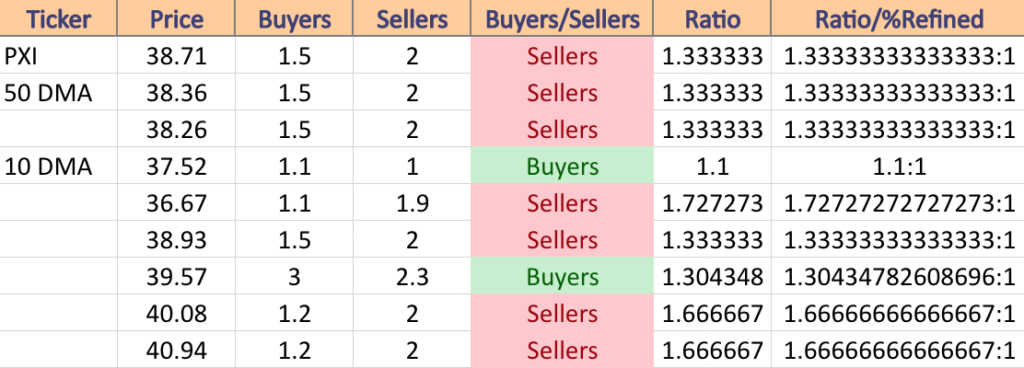
PXI, the Invesco DWA Energy Momentum Fund ETF has fallen -14.57% over the past year, declining -23.17% from their 52-week high in November of 2022, but has reclaimed +15.04% since their 52-week low in July of 2022 (ex-distributions), to close at $38.71/share (Volume Sentiment: Sellers, 1.33:1).
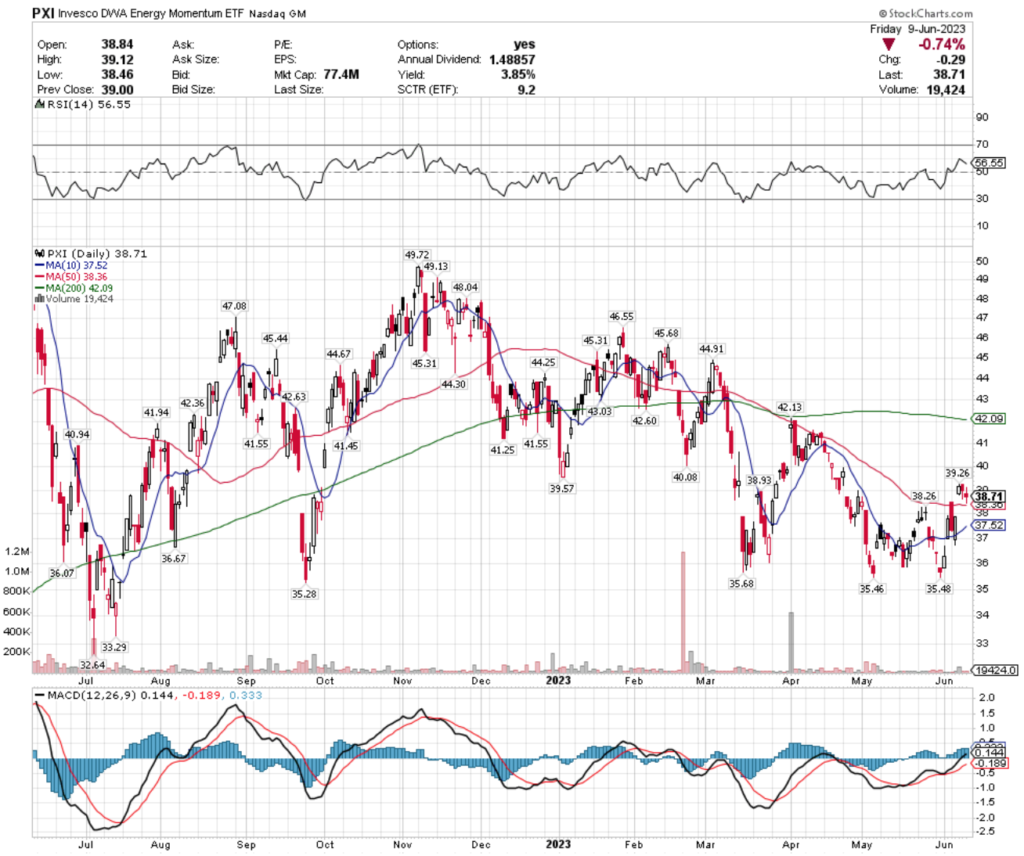
Their RSI is on the overbought end of neutral at 56.55, while their MACD is still bullish.
Volumes were below average last week, signaling uncertainty by investors, and it will be interesting to see if their 50 day moving average can provide enough support to keep them from filling the gap from Wednesday’s session.
They offer a 3.85% distribution yield for long-term holders, which can provide some protection against losses, but an insurance strategy would be beneficial to have in the near-term.
PXI has support at the $38.36 (50 Day Moving Average; Volume Sentiment: Sellers, 1.33:1), $38.26 (Volume Sentiment: Sellers, 1.33:1), $37.52 (10 Day Moving Average; Volume Sentiment: Buyers, 1.1:1) & $36.67 (Volume Sentiment: Sellers, 1.73:1), with resistance at the $38.93 (Volume Sentiment: Sellers, 1.33:1), $39.57 (Volume Sentiment: Buyers, 1.30:1), $40.08 (Volume Sentiment: Sellers, 1.67:1) & $40.94/share (Volume Sentiment: Sellers, 1.67:1) price levels.
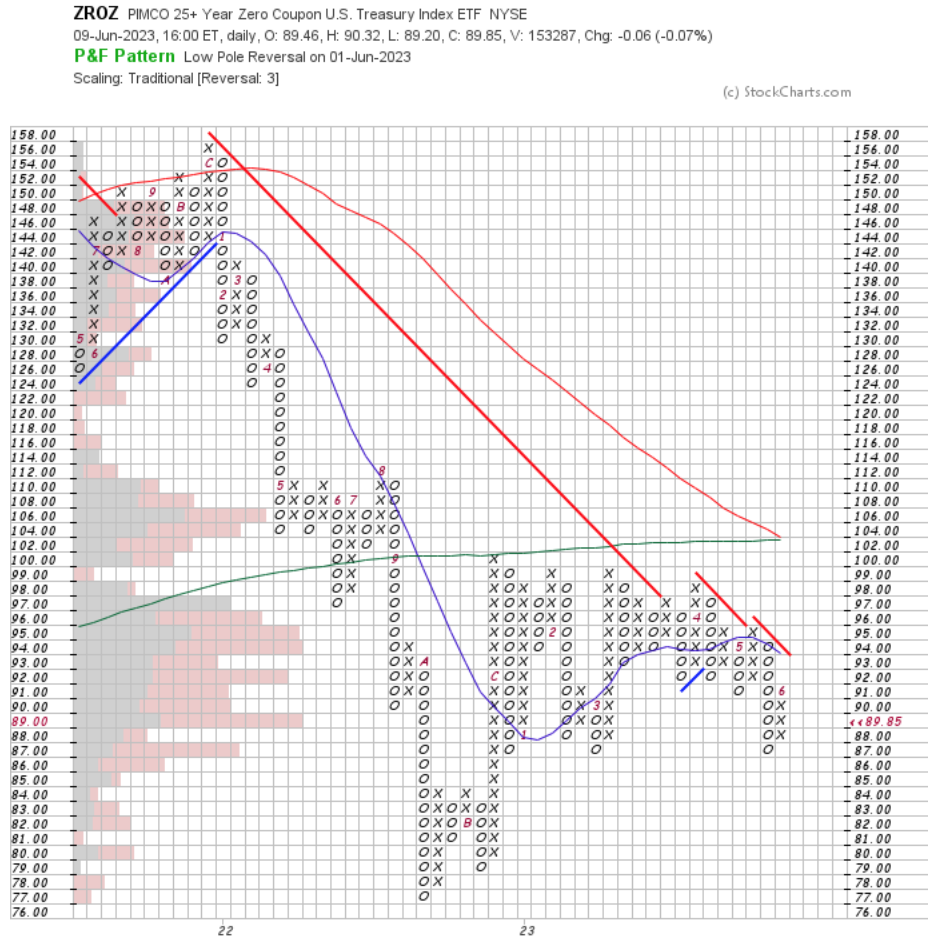
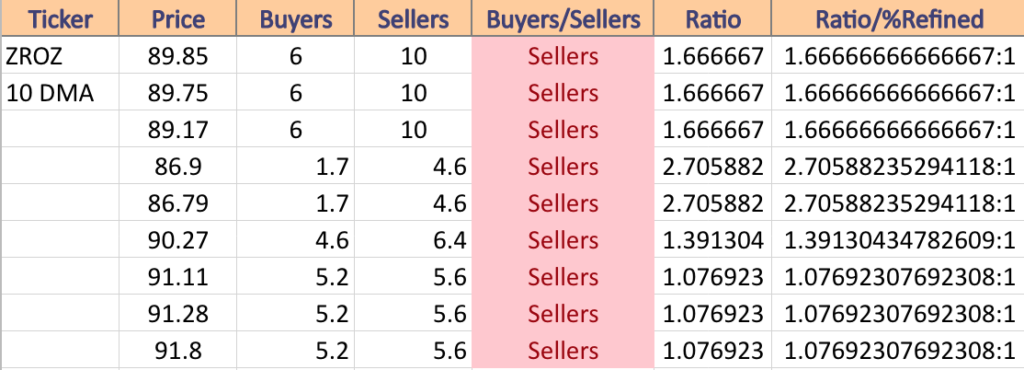
ZROZ, the PIMCO 25+ Year Zero Coupon U.S. Treasury ETF has lost -10.37% over the past year, falling -21.87% from their 52-week high in August of 2022, but has gained +15.92% since their 52-week low in October of 2022 (ex-distributions), to close at $89.85/share (Volume Sentiment: Sellers, 1.67:1).
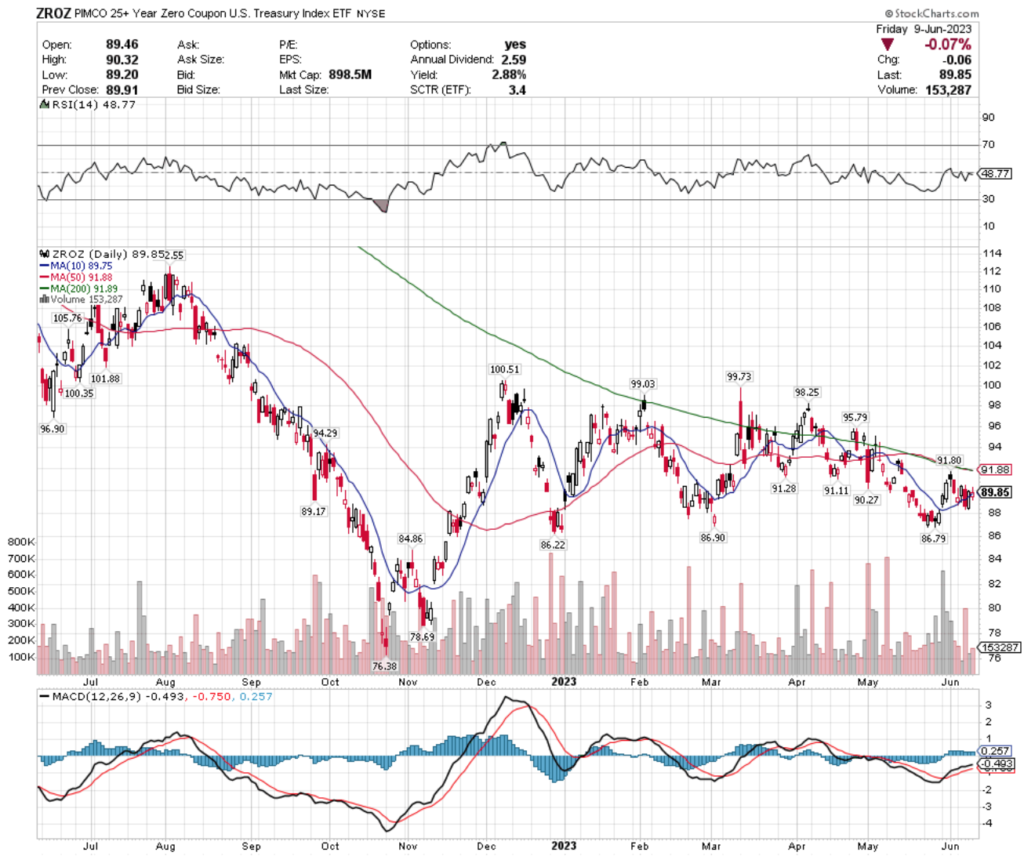
Their RSI is on the oversold end of neutral at 48.77, with their MACD signaling a bearish crossover in the coming days.
Volumes were below average last week compared to the year prior, as their price consolidated, signaling uncertainty among investors.
Their 2.88% distribution yield will provide some relief against potential losses, but watching to see how their support levels hold up in the coming week will be important before deciding on where to enter a position.
ZROZ has support at the $89.75 (10 Day Moving Average; Volume Sentiment: Sellers, 1.67:1), $89.17 (Volume Sentiment: Sellers, 1.67:1), $86.90 (Volume Sentiment: Sellers, 2.71:1) & $86.79/share (Volume Sentiment: Sellers, 2.71:1), with resistance at the $90.27 (Volume Sentiment: Sellers, 1.39:1), $91.11 (Volume Sentiment: Sellers, 1.08:1), $91.28 (Volume Sentiment: Sellers, 1.08:1) & $91.80/share (Volume Sentiment: Sellers, 1.08:1) price levels.
Tying It All Together & The Week Ahead
Monday looks to be quiet on the data being reported front next week, with Oracle’s earnings report being the most anticipated data for the day.
Tuesday heats up with the NFIB Optimism Index at 6 am, followed by the Consumer Price Index, Core CPI, CPI Year-over-Year & Core CPI Year-over-Year being reported at 8:30 am, with no noteworthy earnings reports on tap.
Wednesday kicks off at 8:30 am with the Producer Price Index, Core PPI, PPI Year-over-Year & Core PPI Year-over-Year being reported at 8:30 am, with the biggest news of the week coming at 2 pm when the Fed Decision on Interest-Rate Policy is announced & Chairman Powell gives his press conference at 2:30 pm.
Lennar will also be reporting earnings on Wednesday.
Thursday will have a busy day on the data reporting front, with the morning kicking off at 8:30 am for Initial Jobless Claims, U.S. Retail Sales, Retail Sales minus Autos, Import Price Index, Import Price minus Fuel, the Empire State Manufacturing Survey & Philadelphia Fed Manufacturing Survey data, followed by Industrial Production & Capacity Utilization at 9:15 am & Business Inventories data at 10 am.
Thursday’s earnings reports include Adobe & Kroger, along with some others.
The week winds down quietly on Friday, with Consumer Sentiment reported at 10 am & no noteworthy earnings calls on schedule.
See you back here next week!
*** I DO NOT OWN SHARES OR OPTIONS CONTRACT POSITIONS IN SPY, QQQ, IWM, DIA, SOXL, BRZU, ILF, HOMZ, UTSL, EWM, PXI, or ZROZ AT THE TIME OF PUBLISHING THIS ARTICLE ***