Booking Holdings Inc. stock trades under the ticker BKNG & has steadily climbed +100.73% from their 52-week low in October of 2022.
Yesterday they closed at their 52-week high of $3,245.55/share & their oscillators are signaling that there is going to be an impending cool-down, which makes it imperative for market participants to have an understanding of how buyers & sellers behaved at different price points in recent history.
The Price:Volume analysis below seeks to display the volume at specific share-price levels from over the past two-to-three years & is intended to serve as a reference point for how investors viewed BKNG stock’s value at each level.
It also includes a list of moving averages, as well as support & resistance levels, which will be marked in bold.
Booking Holdings Inc. BKNG Stock’s Price:Volume Sentiment Broken Down
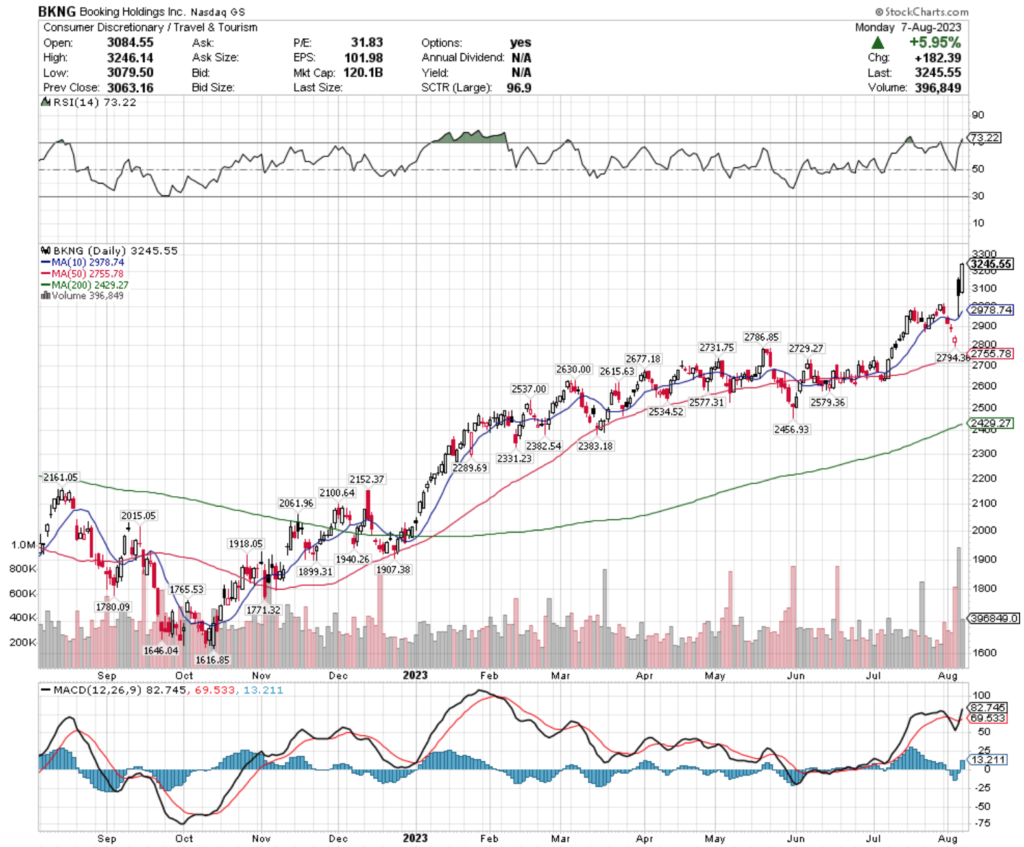
Their RSI is overbought at 73.22, with a bullish MACD following Friday’s gap up session.
Trading volumes over the past week (ex-today) have been +59.73% higher than the average volumes that they have traded at over the past year (546,160 vs. 341,934).
The largest concentration of the past week’s volume came on Friday’s gap up, followed by Thursday’s gap down that Friday’s session recovered from, with Monday’s bullish session having the third highest volume.
With that in mind, market participants should beware of near-term profit taking & be prepared for its impact on BKNG’s price, especially as yesterday’s session reached a 52-week high for the stock.
Last week featured two spinning top candlesticks during BKNG’s decline, with Friday’s candlestick resembling a hanging man, but its body is too long, which indicates a wide day’s trading range, as well as a wide spread between the open & close.
Investors should also note that on Friday, they gapped up, retraced much of the movement & still closed below where they opened for the day’s session, which indicates that there is still uncertainty about their proper valuation & investors are becoming nervous.
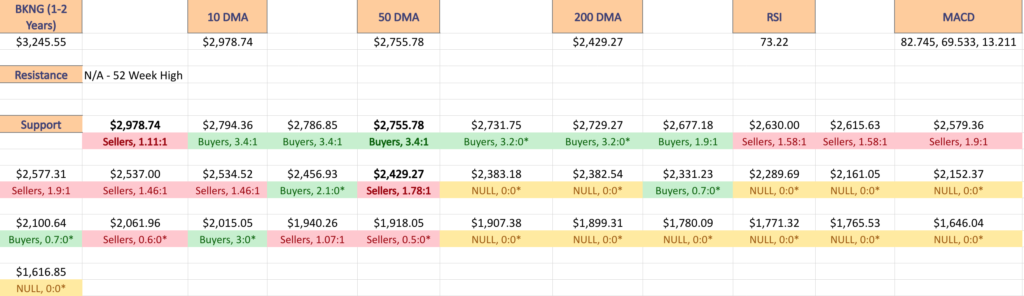
As BKNG is near its 52-week high, it is important to understand how market participants have behaved at the various price levels that they’ve traded at over the past 1-2 years, in order to better understand how support levels will hold up for them in the future.
The bold prices on the image below denote the moving average levels just listed & the bold entries in the list form of the analysis under the images include other levels of support.
Each corresponding price level using a ratio of Buyers:Sellers (or Sellers:Buyers), NULL values denote that there was not enough data, so the ratio would’ve been 0:0.
Ratios with a 0 for the denominator/constant are denoted with an *, but are reported as is, as we are accounting for volume/sentiment.
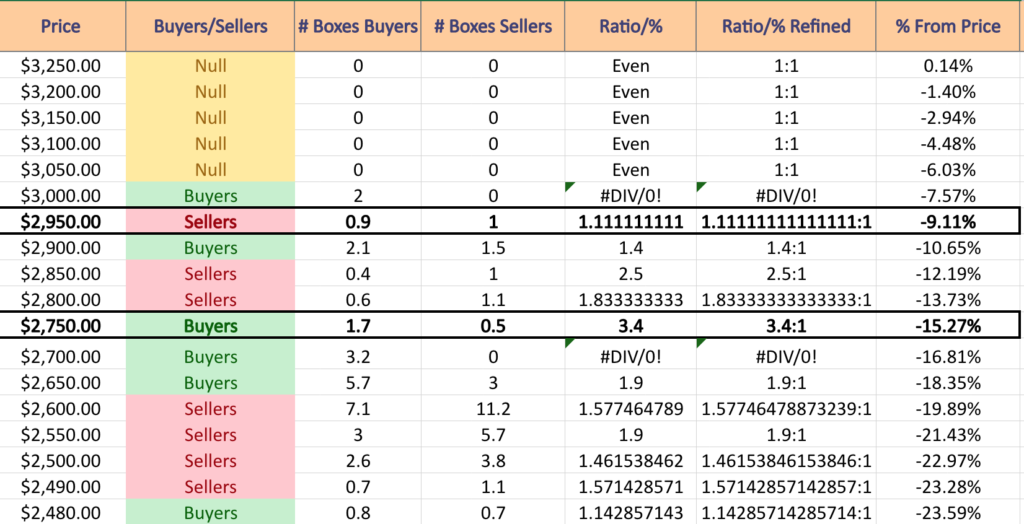
Booking Holdings Inc. BKNG Stock’s Volume By Price Level
$3,250 – NULL – 0:0*, +0.14% From Current Price Level
$3,200 – NULL – 0:0*, -1.4% From Current Price Level
$3,150 – NULL – 0:0*, -2.94% From Current Price Level
$3,100 – NULL – 0:0*, -4.48% From Current Price Level
$3,050 – NULL – 0:0*, -6.03% From Current Price Level
$3,000 – Buyers – 2:0*, -7.57% From Current Price Level
$2,950 – Sellers – 1.11:1, -9.11% From Current Price Level – 10 Day Moving Average
$2,900 – Buyers – 1.4:1, -10.65% From Current Price Level
$2,850 – Sellers – 2.5:1, -12.19% From Current Price Level
$2,800 – Sellers – 1.83:1, -13.73% From Current Price Level
$2,750 – Buyers – 3.4:1, -15.27% From Current Price Level – 50 Day Moving Average
$2,700 – Buyers – 3.2:0*, -16.81% From Current Price Level
$2,650 – Buyers – 1.9:1, -18.35% From Current Price Level
$2,600 – Sellers – 1.58:1, -19.89% From Current Price Level
$2,550 – Sellers – 1.9:1, -21.43% From Current Price Level
$2,500 – Sellers – 1.46:1, -22.97% From Current Price Level
$2,490 – Sellers – 1.57:1, -23.28% From Current Price Level
$2,480 – Buyers – 1.14:1, -23.59% From Current Price Level
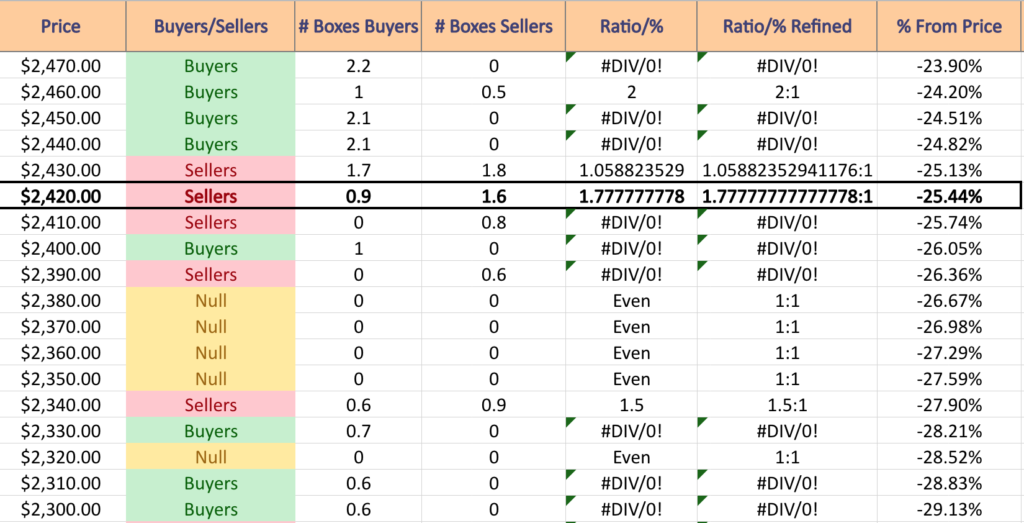
$2,470 – Buyers – 2.2:0*, -23.9% From Current Price Level
$2,460 – Buyers – 2:1, -24.2% From Current Price Level
$2,450 – Buyers – 2.1:0*, -24.51% From Current Price Level
$2,440 – Buyers – 2.1:0*, -24.82% From Current Price Level
$2,430 – Sellers – 1.06:1, -25.13% From Current Price Level
$2,420 – Sellers – 1.78:1, -25.44% From Current Price Level – 200 Day Moving Average
$2,410 – Sellers – 0.8:0*, -25.74% From Current Price Level
$2,400 – Buyers – 1:0*, -26.05% From Current Price Level
$2,390 – Sellers – 0.6:0*, -26.36% From Current Price Level
$2,380 – NULL – 0:0*, -26.67% From Current Price Level
$2,370 – NULL – 0:0*, -26.98% From Current Price Level
$2,360 – NULL – 0:0*. -27.29% From Current Price Level
$2,350 – NULL – 0:0*, -27.59% From Current Price Level
$2,340 – Sellers – 1.5:1, -27.9% From Current Price Level
$2,330 – Buyers – 0.7:0*, -28.21% From Current Price Level
$2,320 – NULL – 0:0*, -28.52% From Current Price Level
$2,310 – Buyers – 0.6:0*, -28.83% From Current Price Level
$2,300 – Buyers – 0.6:0*, -29.13% From Current Price Level
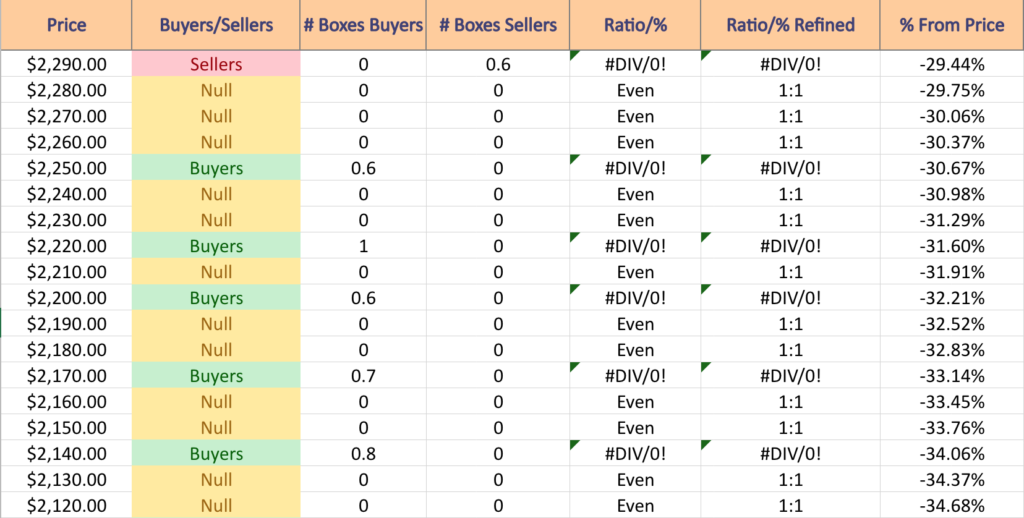
$2,290 – Sellers – 0.6:0*, -29.44% From Current Price Level
$2,280 – NULL – 0:0*, -29.75% From Current Price Level
$2,270 – NULL – 0:0*, -30.06% From Current Price Level
$2,260 – NULL – 0:0*, -30.37% From Current Price Level
$2,250 – Buyers – 0.6:0*, -30.67% From Current Price Level
$2,240 – NULL – 0:0*, -30.98% From Current Price Level
$2,230 – NULL – 0:0*, -31.29% From Current Price Level
$2,220 – Buyers – 1:0*, -31.6% From Current Price Level
$2,210 – NULL – 0:0*, -31.91% From Current Price Level
$2,200 – Buyers – 0.6:0*, -32.21% From Current Price Level
$2,190 – NULL – 0:0*, -32.52% From Current Price Level
$2,180 – NULL – 0:0*, -32.83% From Current Price Level
$2,170 – Buyers – 0.7:0*, -33.14% From Current Price Level
$2,160 – NULL – 0:0*, -33.45% From Current Price Level
$2,150 – NULL – 0:0*, -33.76% From Current Price Level
$2,140 – Buyers – 0.8:0*, -34.06% From Current Price Level
$2,130 – NULL – 0:0*, -34.37% From Current Price Level
$2,120 – NULL – 0:0*, -34.68% From Current Price Level
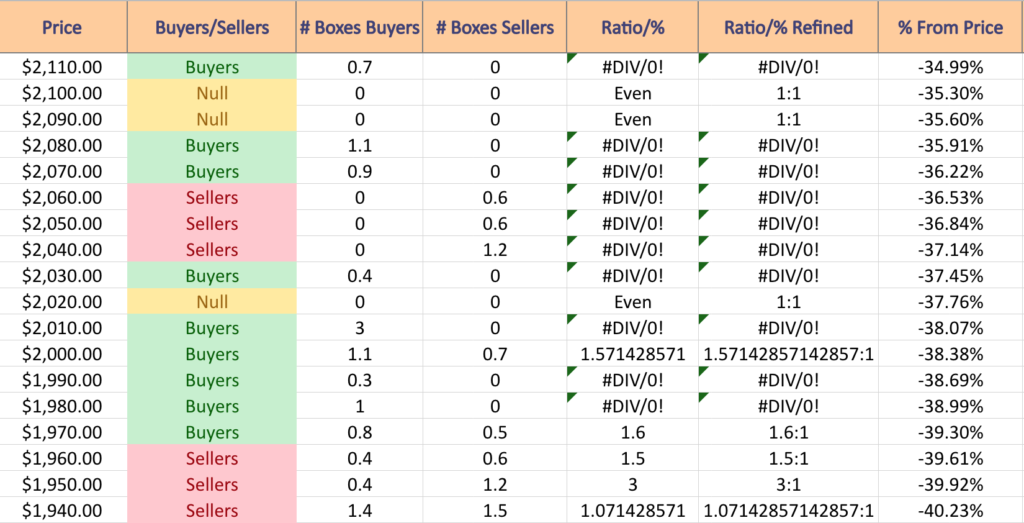
$2,110 – Buyers – 0.7:0*, -34.99% From Current Price Level
$2,100 – NULL – 0:0*, -35.3% From Current Price Level
$2,090 – NULL – 0:0*, -35.6% From Current Price Level
$2,080 – Buyers – 1.1:0*, -35.91% From Current Price Level
$2,070 – Buyers – 0.9:0*, -36.22% From Current Price Level
$2,060 – Sellers – 0.6:0*, 36.53% From Current Price Level
$2.050 – Sellers – 0.6:0*, -36.84% From Current Price Level
$2,040 – Sellers – 1.2:0*, -37.14% From Current Price Level
$2,030 – Buyers – 0.4:0*, -37.45% From Current Price Level
$2,020 – NULL – 0:0*, -37.76% From Current Price Level
$2,010 – Buyers – 3:0*, -38.07% From Current Price Level
$2,000 – Buyers – 1.57:1, -38.38% From Current Price Level
$1,990 – Buyers – 0.3:0*, -38.69% From Current Price Level
$1,980 – Buyers – 1:0*, -38.99% From Current Price Level
$1,970 – Buyers – 1.6:1, -39.3% From Current Price Level
$1,960 – Sellers – 1.5:1, -39.61% From Current Price Level
$1,950 – Sellers – 3:1, -39.92% From Current Price Level
$1,940 – Sellers – 1.07:1, -40.23% From Current Price Level
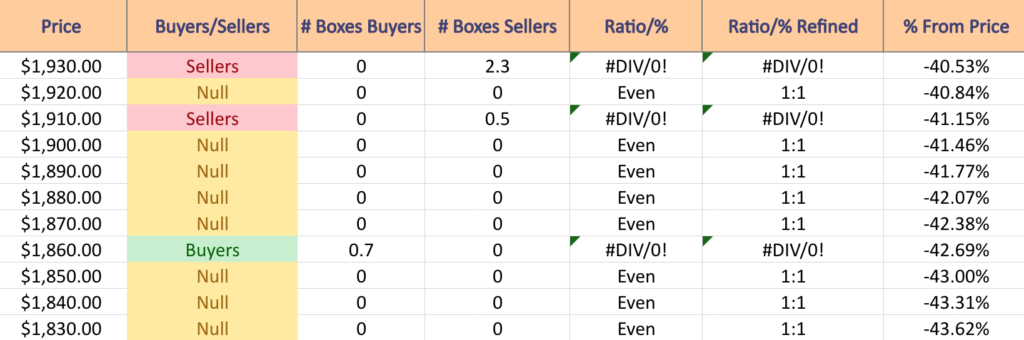
$1,930 – Sellers – 2.3:0*, -40.53% From Current Price Level
$1,920 – NULL – 0:0*, -40.84% From Current Price Level
$1,910 – Sellers – 0.5:0*, -41.15% From Current Price Level
$1,900 – NULL – 0:0*, -41.46% From Current Price Level
$1,890 – NULL – 0:0*, -41.77% From Current Price Level
$1,880 – NULL – 0:0*, -42.07% From Current Price Level
$1,870 – NULL – 0:0*, -42.38% From Current Price Level
$1,860 – Buyers – 0.7:0, -42.69% From Current Price Level
$1,850 – NULL – 0:0*, -43% From Current Price Level
$1,840 – NULL – 0:0*, -43.31% From Current Price Level
$1,830 – NULL – 0:0*, -43.62% From Current Price Level
Tying It All Together
The list & image above paint the picture as to how investors & traders have behaved at various price levels that BKNG has been at over the past one-to-two years.
It is not meant to serve as investment/trading advice, and is simply a way to visualize what investor/trader sentiment has been like at each of the price levels mentioned, as well as what it was at levels of support & resistance that are denoted in the image & list.
As always, do your own due diligence before making investing/trading decisions.
For more on the methodology on how the data was collected & put together, please refer to our original Price:Volume analysis.
*** I DO NOT OWN SHARES OR OPTIONS CONTRACT POSITIONS IN BKNG AT THE TIME OF PUBLISHING THIS ARTICLE ***