SPY, the SPDR S&P 500 ETF declined -0.26% last week in a week of steady decline for the S&P 500.
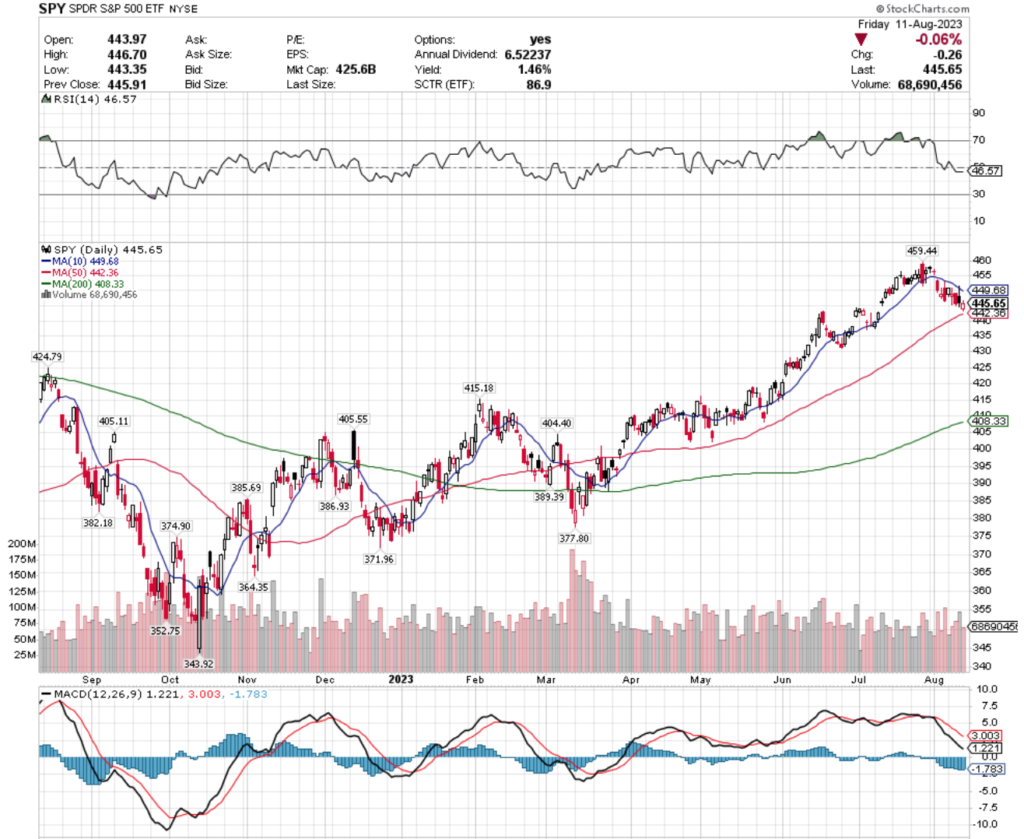
Their RSI is just below neutral at 46.57, but their MACD is in bearish decline.
Volumes were -6.86% below average last week compared to the average for the year prior (78,371,800 vs. 84,142,598) as investors waited to learn more from companies’ earnings reports while taking a breather after hitting a 52-week high a couple of weeks ago.
There were 3 spinning top candlesticks last week, signaling indecision by market participants & this week will be interesting to watch how the 10 & 50 day moving average create pressure on prices, with the 10 DMA applying downward pressure, while the 50 DMA continues to apply upward pressure on SPY’s price.
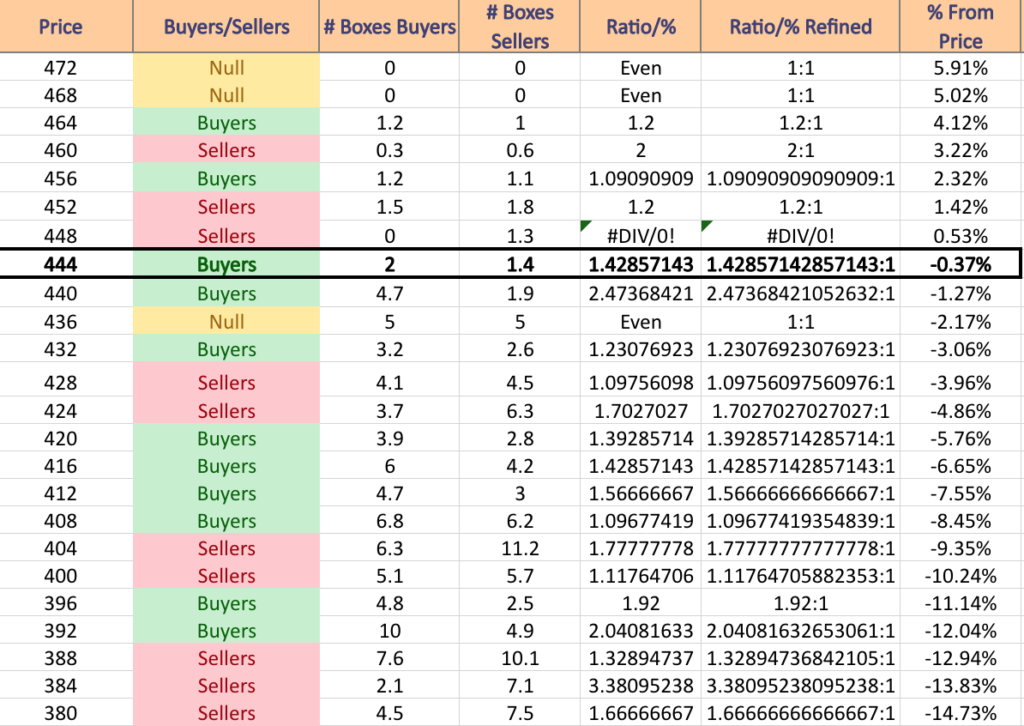
Another key area to watch in the coming weeks is SPY’s support levels, as aside from their 50 day moving average, the closest support level is a -4.68% decline away, making it important to have an idea as to how their price has behaved at various levels in recent history.
SPY has support at the $442.36 (50 Day Moving Average; Volume Sentiment: Buyers, 2.47:1), $424.79 (Volume Sentiment: Sellers, 1.70:1), $415.18 (Volume Sentiment: Buyers, 1.57:1) & $408.33/share (200 Day Moving Average; Volume Sentiment: Buyers, 1.10:1) price levels, with resistance at the $449.68 (10 Day Moving Average; Volume Sentiment: Sellers, 1.3:0*) & $459.44/share (52-Week High; Volume Sentiment: Buyers, 1.09:1) price levels.
QQQ, the Invesco QQQ Trust ETF lost -1.56% last week, settling below their 50 day moving average by Friday’s close.
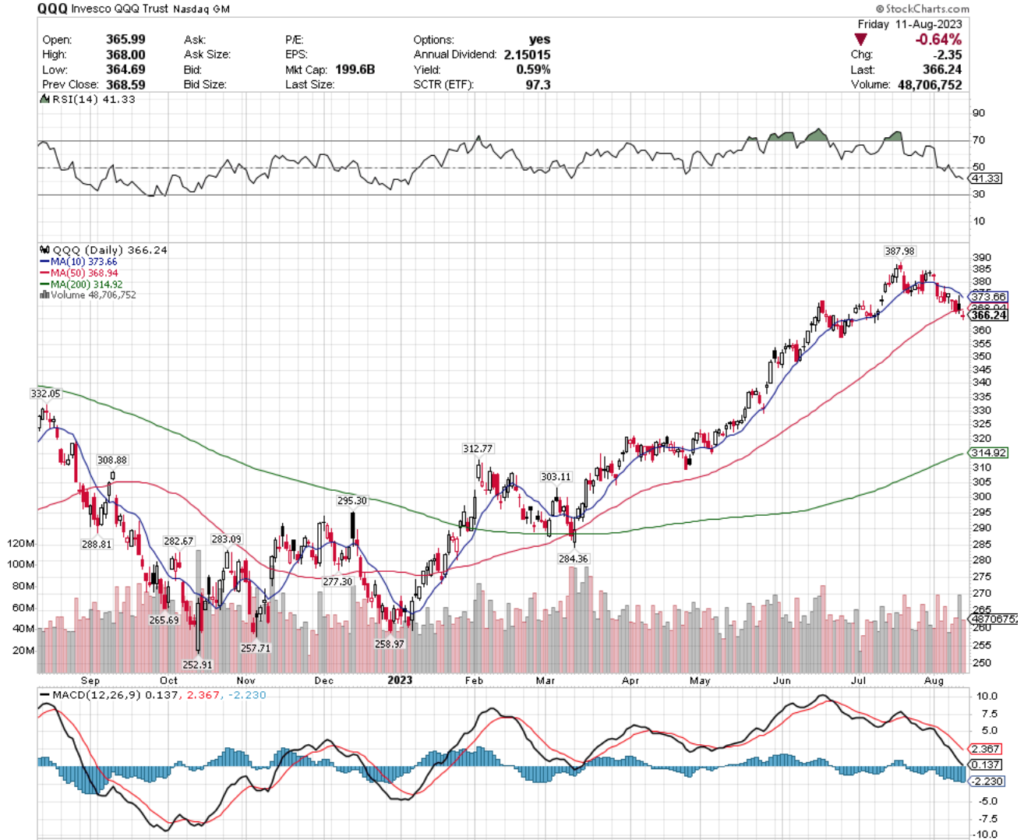
Their RSI is trending towards oversold & is currently at 41.33, with their MACD is bearish freefall.
Volumes were -5.57% below average last week compared to the year prior’s average (52,578,850 vs. 55,681,019), as market participants sought to take profits after the ascent of spring & early summer.
Monday’s hanging man candlestick set the tone for the rest of the week’s price range for QQQ, which preceded Tuesday’s hanging man candle.
The week ended on a spinning top candle that closed beneath the 10 & 50 day moving averages, meaning that investors are still not convinced that they need to be buying QQQ & that there is going to be further downside pressure being applied by the moving averages in the near-term.
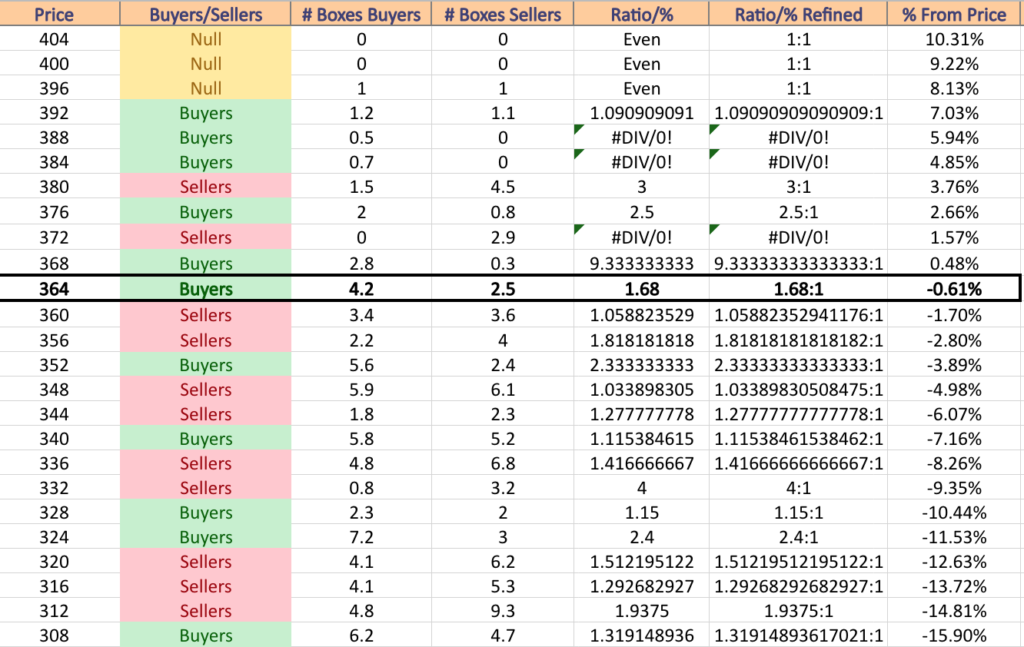
Much like SPY, QQQ also has a bit of space between its current price & its next support level, with currently a -9.34% space with no support from their current price to the next level beneath it, which investors should be conscientious of.
QQQ has support at the $332.05 (Volume Sentiment: Sellers, 4:1), $314.92 (200 Day Moving Average; Volume Sentiment: Sellers, 1.94:1), $312.77 (Volume Sentiment: Sellers, 1.94:1) & $308.88/share (Volume Sentiment: Buyers, 1.32:1) price levels, with resistance at the $368.94 (50 Day Moving Average; Volume Sentiment: Buyers, 9.33:1), $373.66 (10 Day Moving Average; Volume Sentiment: Sellers, 2.9:0*) & $387.98/share (52-Week High; Volume Sentiment: Buyers, 0.7:0*) price levels.
IWM, the iShares Russell 2000 ETF declined -1.64% last week, as small cap stocks fared the worst out of the major indexes.
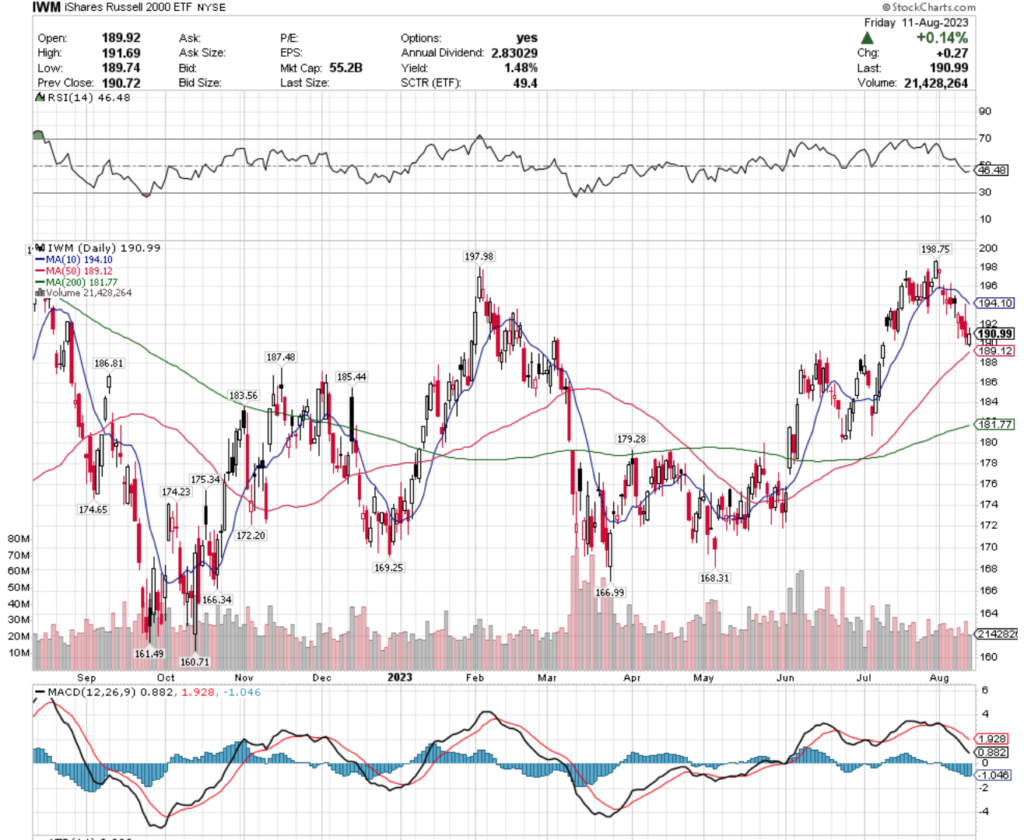
Their RSI is trending downward & recently crossed below neutral to 46.48, with their MACD in bearish decline.
Last week’s volume was -14.33% lower than the average volume for the year prior (24,026,883 vs. 28,047,249), which shows hesitancy on the part of market participants & a lack of confidence in IWM.
Monday’s hanging man candlestick began the week’s decline, closing lower than it opened, but opening above Friday’s close.
IWM is going to have support coming from their 50 day moving average while the 10 day moving average is applying downwards pressure against their price in the coming week.
Their chart has less risk of price:support level distance than the other indexes as they have traded much more rangebound over the past year than SPY or QQQ.
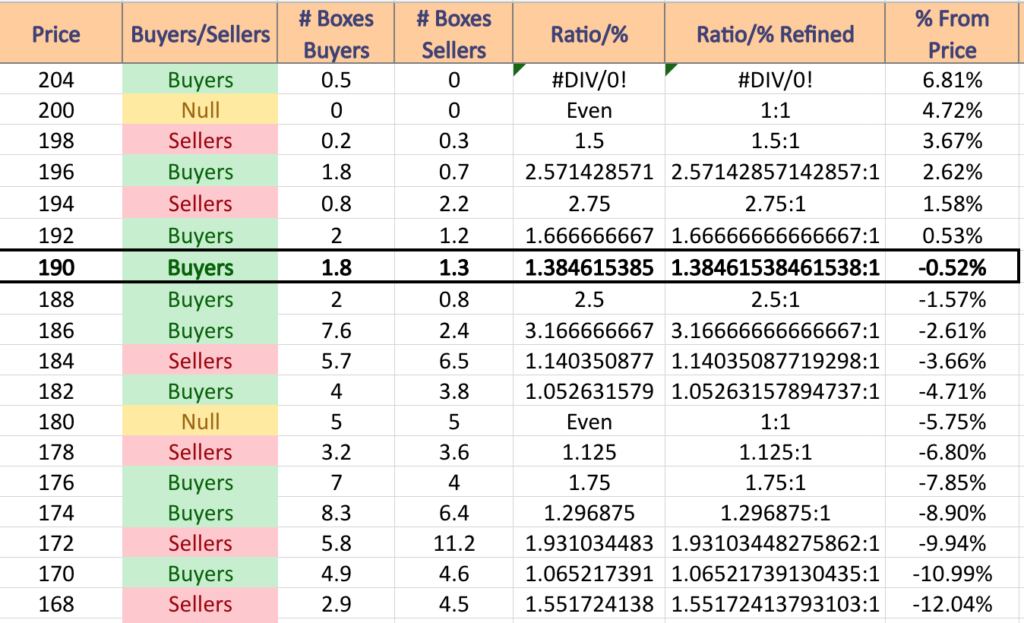
IWM has support at the $189.12 (50 Day Moving Average; Volume Sentiment: Buyers, 2.5:1), $187.48 (Volume Sentiment: Buyers, 3.17:1), $186.81 (Volume Sentiment: Buyers, 3.17:1) & $185.44/share (Volume Sentiment: Sellers, 1.14:1) price levels, with resistance at the $194.10 (10 Day Moving Average; Volume Sentiment: Sellers, 2.75:1), $197.98 (Volume Sentiment: Buyers, 2.57:1), $198.74 (Volume Sentiment: Sellers, 1.5:1) & $198.75/share (52-Week High; Volume Sentiment: Sellers, 1.5:1) price levels.
DIA, the SPDR Dow Jones Industrial Average ETF was the sole index to advance last week, adding +0.67% for the week.
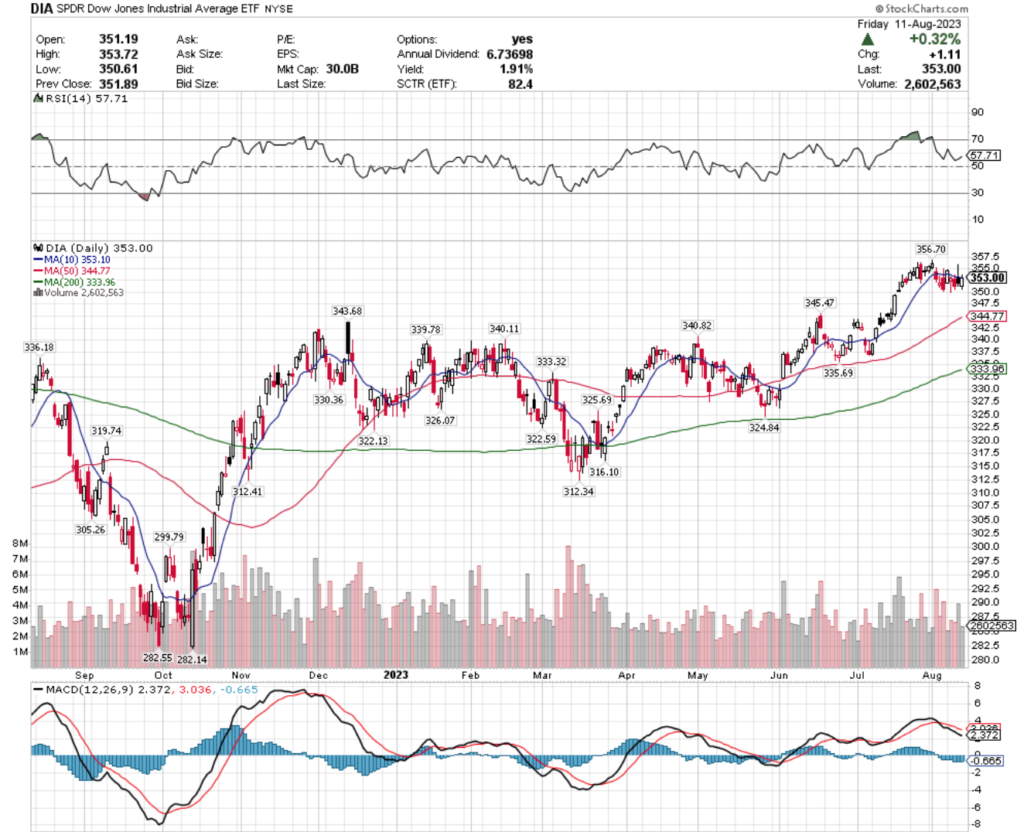
Their RSI is trending up towards overbought levels, as investors sought the safety of larger cap stocks & is currently at 57.71, but their MACD is bearish after the consolidation of the past 3-4 weeks.
Last week’s volume was -11.61% lower than the average volume for the year prior (3,216,900 vs. 3,639,508), signaling that investors are beginning to show signs of fatigue & are not as enthusiastic about adding risk to their portfolios at this time vs. in the past.
Last week’s candlesticks all traded in a relatively tight range, and the 10 day moving average is going to begin applying downward pressure to prices this week.
Like IWM, DIA has traded much more in ranges this past year compared to SPY & QQQ, so there will be support levels closer to the price level than for the first two ETFs in this article.
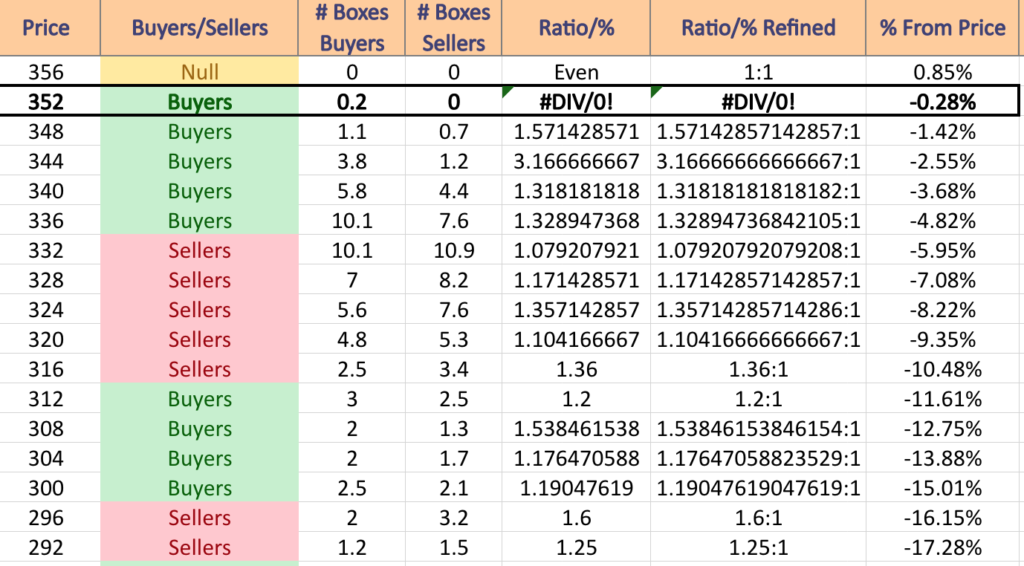
DIA has support at the $345.47 (Volume Sentiment: Buyers, 3.17:1), $344.77 (50 Day Moving Average; Volume Sentiment: Buyers, 3.17:1), $343.68 (Volume Sentiment: Buyers, 1.32:1) & $340.82/share (Volume Sentiment: Buyers, 1.32:1) price levels, with resistance at the $353.10 (10 Day Moving Average; Volume Sentiment: Buyers, 0.2:0*) & $356.70/share (52-Week High; Volume Sentiment: NULL, 0:0*) price levels.
Energy (ERX), Japan (DXJ), Emerging Market Dividend Stocks (EDIV) & U.S. Cash Cows (COWZ) Are All Bullishly Leading The Market
ERX, the Direxion Daily Energy Bull 2x Shares ETF has gained +29.08% over the past year, adding 58.01% since their 52-week low in September of 2022 (ex-distributions).
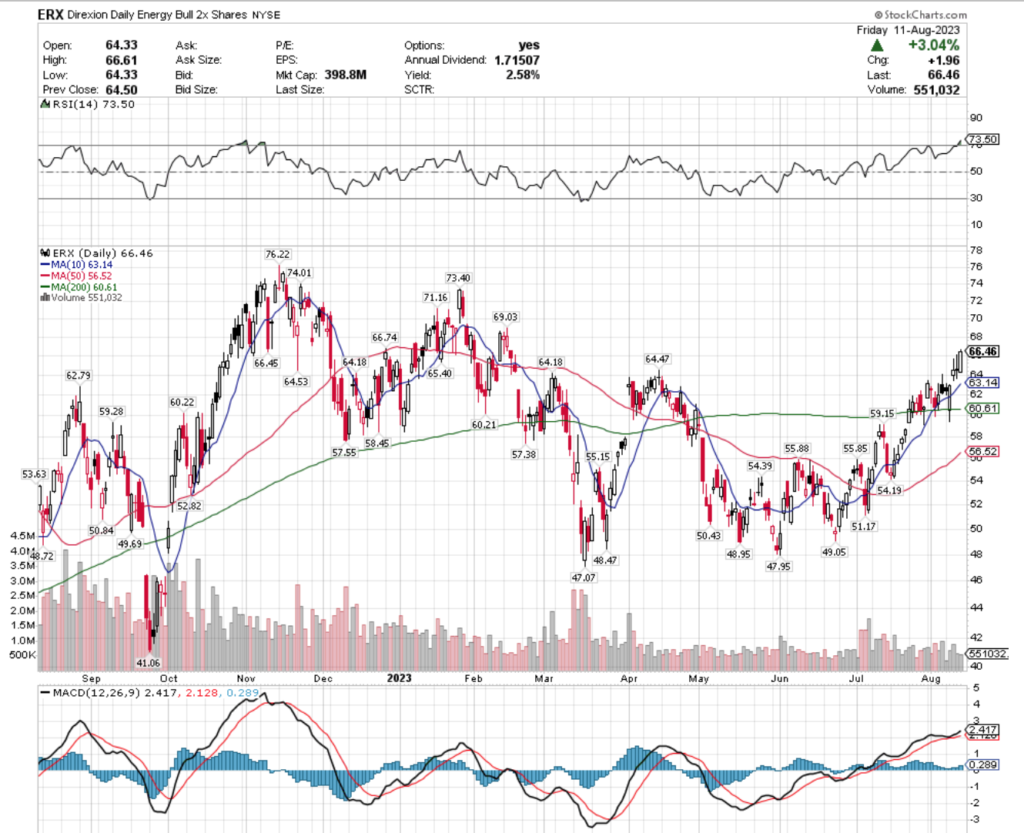
Their RSI is overbought currently at 73.5, with their MACD still advancing bullishly following the gap up during Wednesday’s session.
Last week’s trading volume was unusually light, coming in at -53.86% below average compared to the year prior (603,380 vs. 1,307,763), which shows reluctance on the part of investors & a more cautious attitude at this price level.
Last week’s chart kicked off with a spinning top, before Tuesday’s session tested the 200 day moving average to the downside & closed higher, before Wednesday’s gap up on a spinning top, followed Thursday by a doji, signaling that there is indeed caution on the part of investors currently.
With a 2.58% distribution yield, there is some cushion for long-term shareholders, however it would be wise to have a hedging strategy in place in the coming weeks for when ERX declines from profit taking after their recent growth.
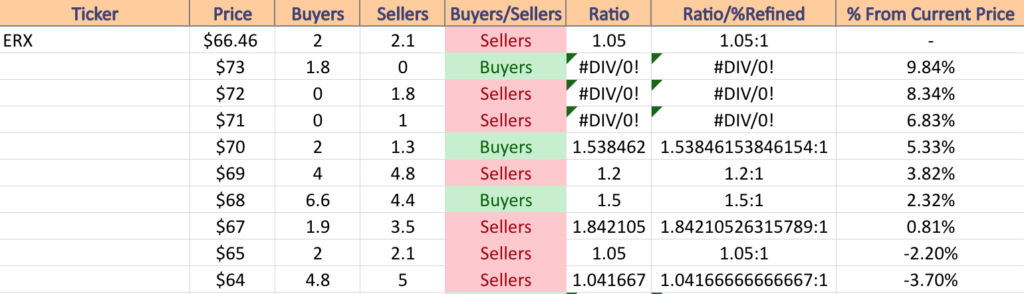
ERX has support at the $66.45 (Volume Sentiment: Sellers, 1.05:1), $65.40 (Volume Sentiment: Sellers, 1.05:1), $64.53 (Volume Sentiment: Sellers, 1.04:1) & $64.47/share (Volume Sentiment: Sellers, 1.04:1) price levels, with resistance at the $66.74 (Volume Sentiment: Sellers, 1.05:1), $69.03 (Volume Sentiment: Sellers, 1.2:1), $71.16 (Volume Sentiment: Sellers, 1:0*) & $73.40/share (Volume Sentiment: Buyers, 1.8:0*) price levels.
DXJ, the WisdomTree Japan Hedged Equity Fund ETF has advanced +34.21% over the past year, climbing +37.78% since their 52-week low in September of 2022 (ex-distributions).
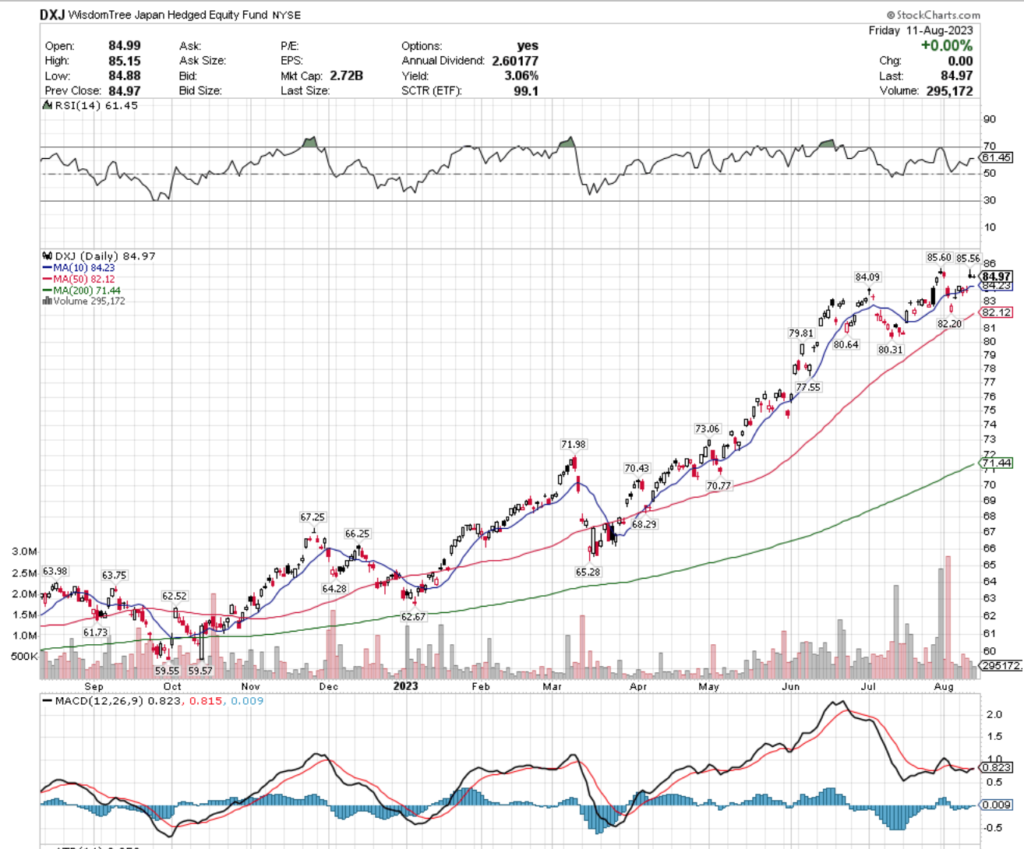
Their RSI is trending towards overbought conditions currently at 61.45 (70 = overbought), with their MACD looking relatively flat & like it may bearishly crossover in the coming days.
Last week’s volume was -5.87% below average compared to the year prior (420,240 vs. 446,451), following the days of heavier than average volume of the past two weeks as the price sits near its 52-week high.
Tuesday & Wednesday featured some profit taking by investors, with Thursday’s session resulting in a gap up off of their 10 day moving average.
It is worth noting that Wednesday’s session resulted in a doji, Thursday’s session resulted in a spinning top & Friday’s session also closed as a doji, signaling a high degree of uncertainty & caution among market participants.
DXJ’s 10 day moving average will be a key area to keep an eye on in the coming week to see how it supports the current price levels, as you can begin to see it is rolling over bearishly.
DXJ offers a 3.06% distribution yield for long-term holders which provides some cushion against losses, however a hedging strategy in the near-term would be a wise idea as they sit near their 52-week highs while waiting to see how their support levels hold up.
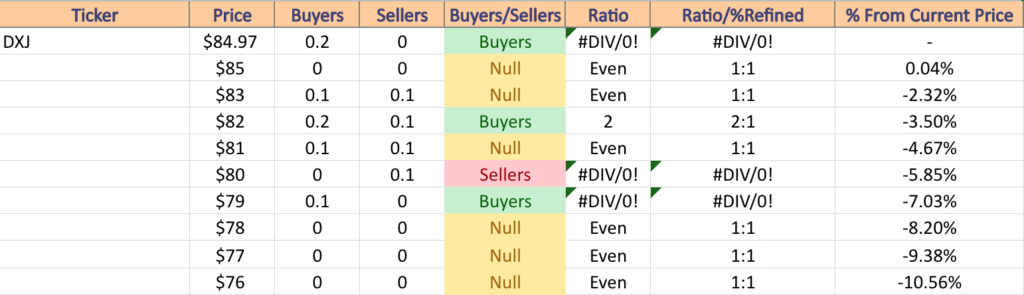
They have support at the $84.23 (10 Day Moving Average; Volume Sentiment: Buyers, 0.2:0*), $84.09 (Volume Sentiment: Buyers, 0.2:0*), $82.20 (Volume Sentiment: Buyers, 2:1) & $82.12/share (50 Day Moving Average; Volume Sentiment: Buyers, 2:1) price levels, with resistance at the $85.56 (Volume Sentiment: NULL, 0:0*) & $85.60/share (Volume Sentiment: NULL, 0:0*) price levels.
EDIV, the SPDR S&P Emerging Market Dividend ETF has notched +19.82% gains over the past year, adding +38.43% from their 52-week low in November of 2022 (ex-distributions).
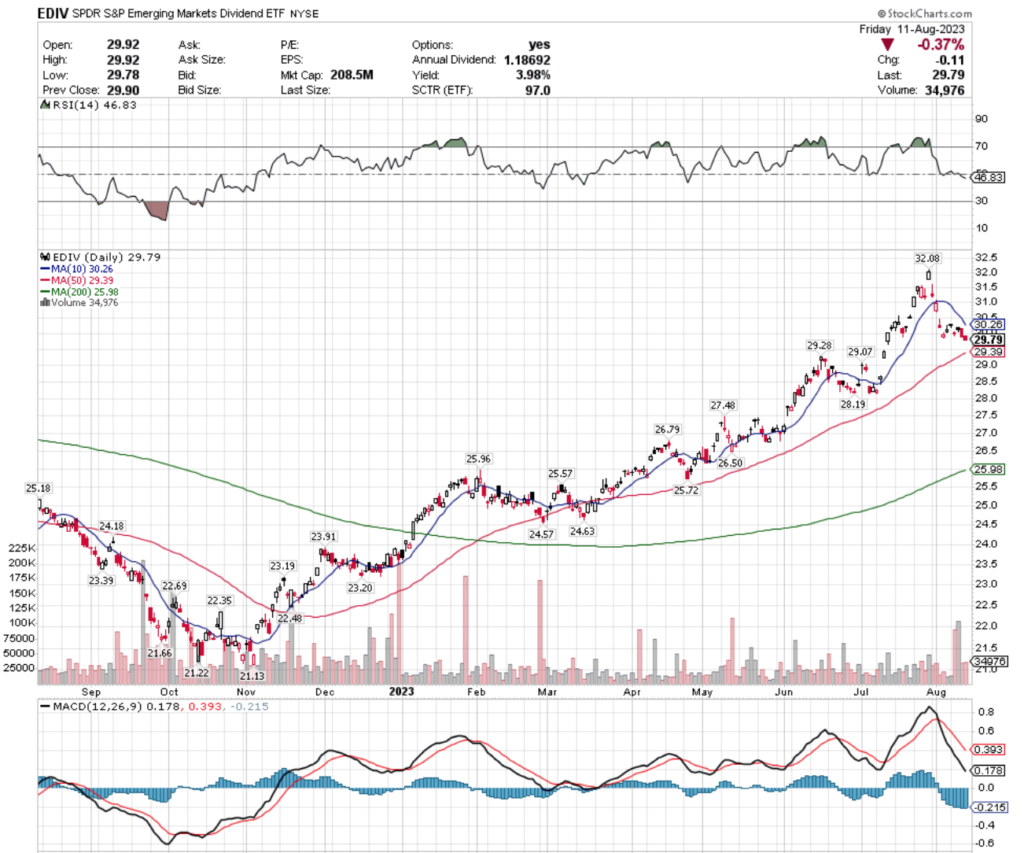
Their RSI is trending lower & recently just passed through the neutral level after the declines of the past two weeks (currently 46.83), with their MACD in bearish decline.
Volume was +52.39% above average this past week compared to the year prior (50,500 vs. 33,138) as investors were eager to enter back in after some profit taking activity took place near their 52-week high.
Their outlook also looks uncertain in the near-term however, with Monday & Wednesday of last week resulting in hanging man candlesticks, Tuesday being a doji & Thursday & Friday being declining days.
They pay a 3.98% distribution yield for long-term holders, which will provide some cushion against losses, but investors should remain vigilant in the coming week, especially as the 10 & 50 day moving averages move in on either side of the current share price.
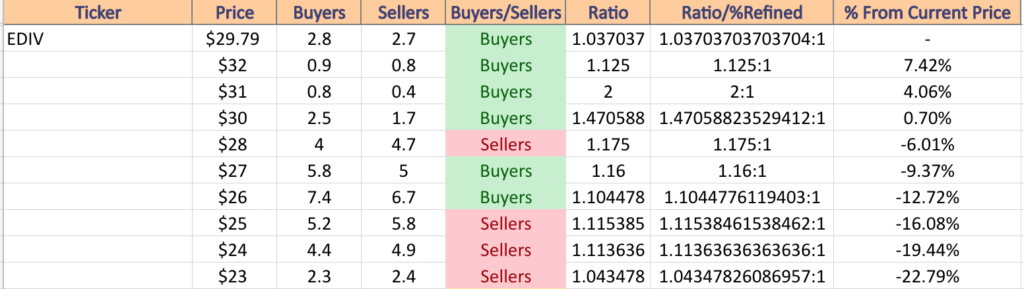
EDIV has support at the $29.39 (50 Day Moving Average; Volume Sentiment: Buyers, 1.04:1), $29.28 (Volume Sentiment: Buyers, 1.04:1), $29.07 (Volume Sentiment: Buyers, 1.04:1) & $28.19/share (Volume Sentiment: Sellers, 1.18:1) price levels, with resistance overhead at the $30.26 (10 Day Moving Average; Volume Sentiment: Buyers, 1.47:1) & $32.08/share (52 Week High; Volume Sentiment: Buyers, 1.13:1) price levels.
COWZ, the Pacer U.S. Cash Cows 100 ETF has risen +9.71% over the past year, advancing 29.29% from their 52-week low in September of 2022 (ex-distributions).
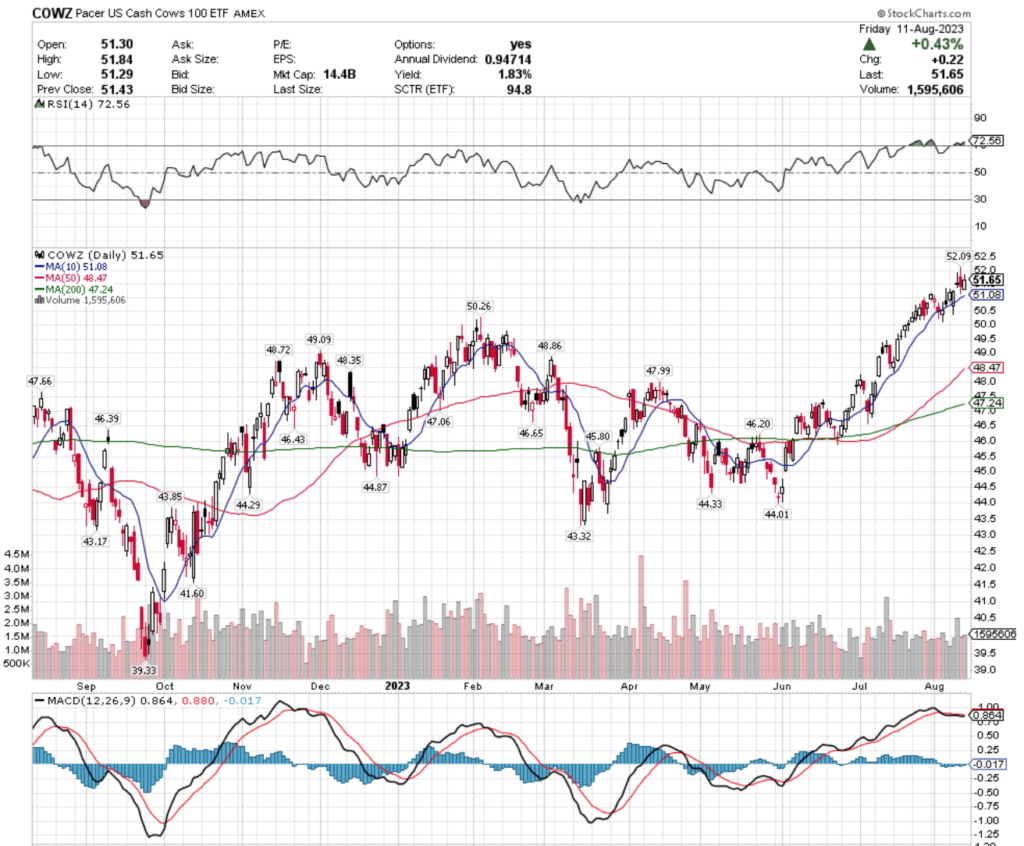
Their RSI is currently overbought at 72.56 after a strong July, with their MACD bearish but relatively flat.
Last week’s volume was -8.76% below average compared to the year prior (1,595,160 vs. 1,748,296), as investors have become nervous now that the price level is near their 52-week high.
Wednesday’s session resulted in a gravestone doji, which sends a foreboding message into the coming weeks when combined with Thursday’s candle to create a bearish engulfing pattern, which tends to signal further declines are on the horizon.
COWZ pays a 1.83% distribution yield to long-term holders, which does not provide much protection against a downside movement, making it important to have a hedging strategy or to take some profits now while they are at these high levels.
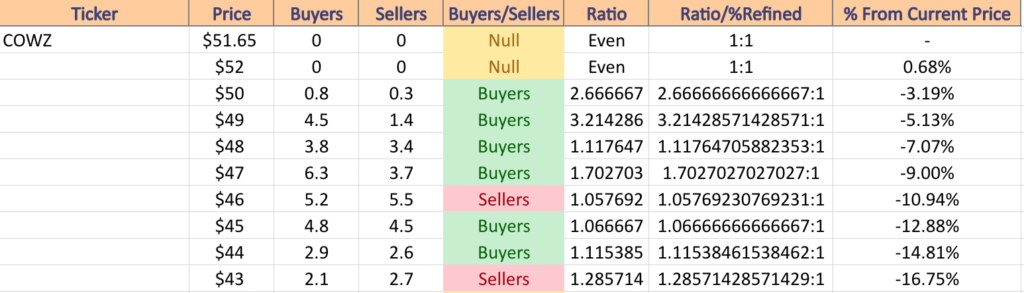
They have support at the $51.08 (10 Day Moving Average; Volume Sentiment: NULL, 0:0*), $50.26 (Volume Sentiment: Buyers, 2.67:1), $49.09 (Volume Sentiment: Buyers, 3.21:1) & $48.86/share (Volume Sentiment: Buyers, 1.12:1) price levels, with resistance at the $52.09/share (52-Week High; Volume Sentiment: NULL, 0;0*) price level.
20+ Year Treasuries (UBT), Clean Energy (ACES), China (CNYA) & Gold Miners (GDX) Are All Bearishly Lagging The Market
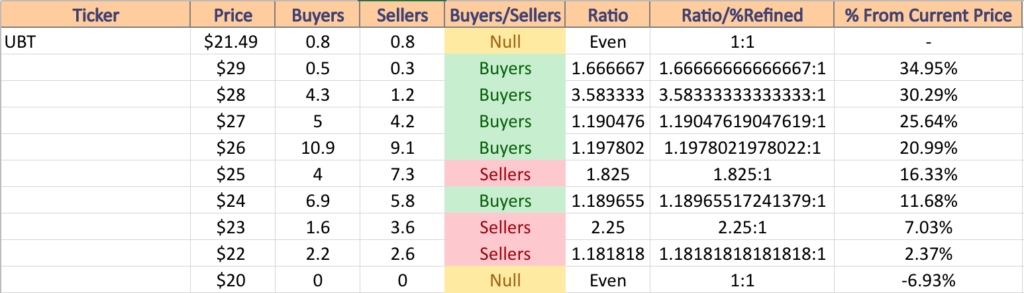
UBT, the ProShares Ultra 20+ Year Treasury ETF has fallen -33.65% over the past year, losing -36.16% from their 52-week high in August of 2022, but has inched forward +3.77% from their 52-week low in October of 2022 (ex-distributions).
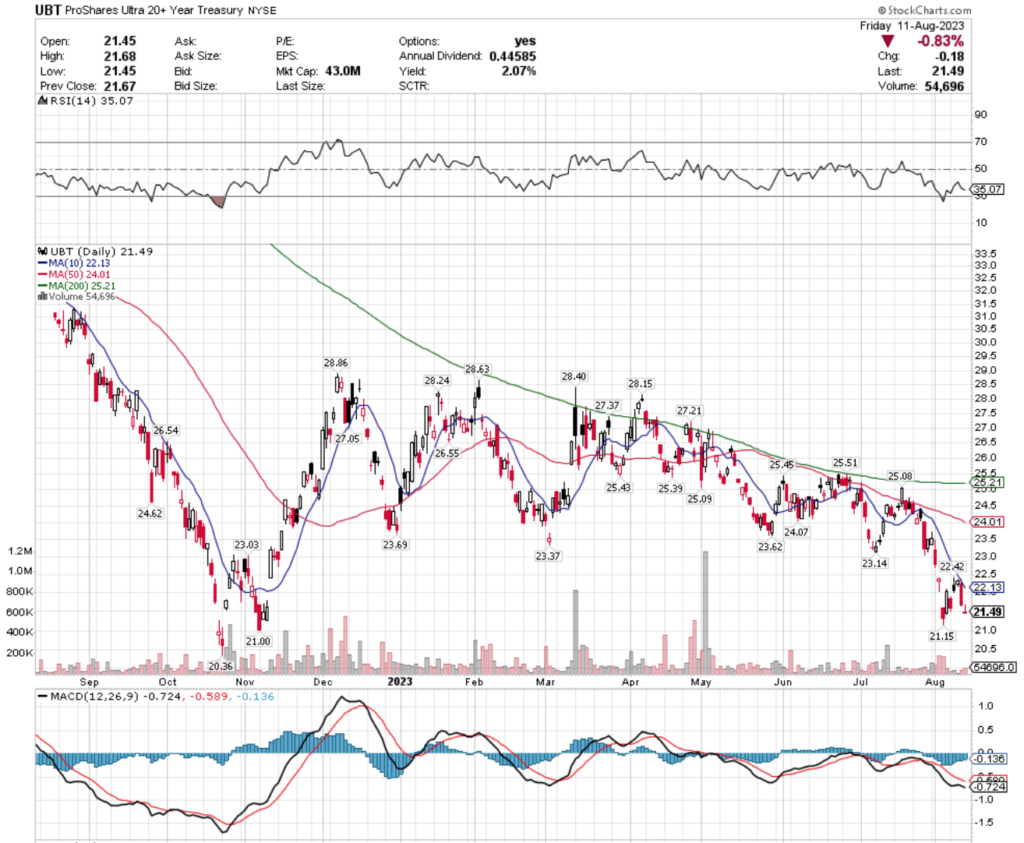
Their RSI is trending towards oversold, with their MACD in bearish decline following the losses they began incurring in mid-July.
Last week’s volumes were -69.35% below average compared to the year prior (33,100 vs. 108,005), as there was limited enthusiasm amongst investors as their share price began to approach their 52-week low.
While Friday’s session ended in an inverted hammer candlestick which is often a signal of an impending bullish reversal, when paired with the low volume it would be best to wait & see how their current support levels & resistance levels hold up before entering into a position.
Pair that with the 2.07% distribution yield that they offer to long-term holders & there is limited upside to entering into a new position here at these levels until they establish a more steady footing.
UBT has support at the $21.15 (Volume Sentiment: Even, 1:1), $21.00 (Volume Sentiment: Even, 1:1) & $20.36/share (52-Week Low; Volume Sentiment: NULL, 0:0*) price levels, with resistance at the $22.13 (10 Day Moving Average; Volume Sentiment: Sellers, 1.18:1), $22.42 (Volume Sentiment: Sellers, 1.18:1), $23.03 (Volume Sentiment: Sellers, 2.25:1) & $23.14/share (Volume Sentiment: Sellers, 2.25:1) price levels.
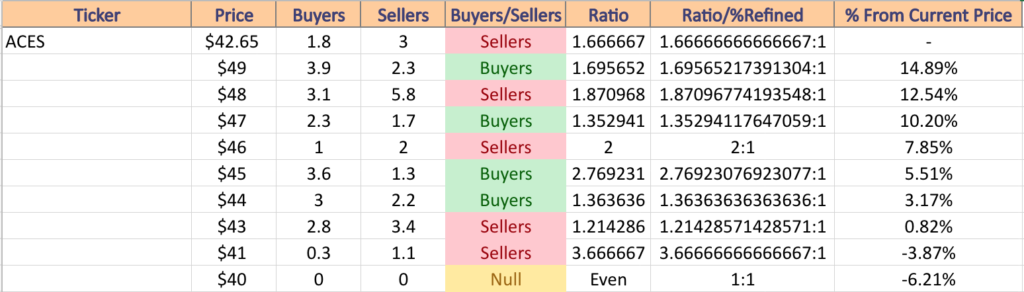
ACES, the ALPS Clean Energy ETF has declined -35.99% over the past year, shedding -37.21% since their 52-week high in August of 2022, but has rebounded +6.25% from their 52-week low in May of 2023 (ex-distributions).
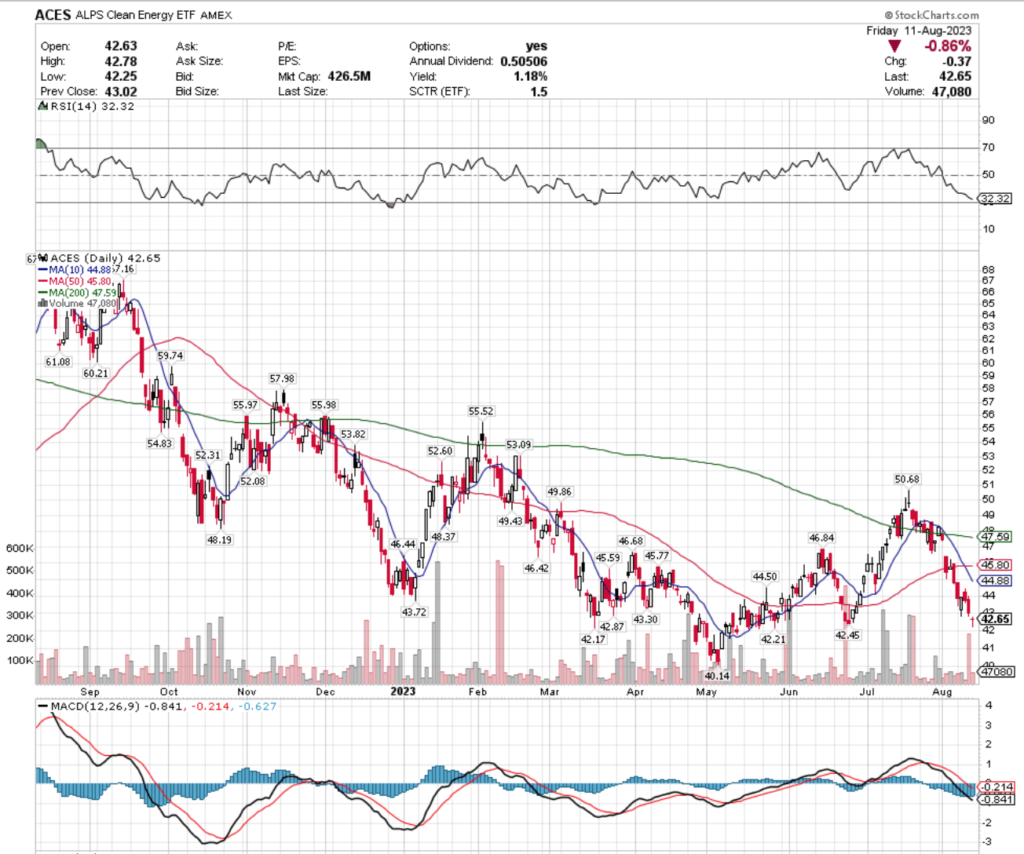
Their RSI is trending toward oversold, with their MACD currently in a bearish decline.
Last week’s volumes were -9.08% below the year prior’s average trading volumes (75,020 vs. 82,509), as investors watched to see how their support levels held up as they moved down towards their 52-week low.
Friday’s dragonfly doji candle gives a glimmer of hope to a near-term reversal, but market participants would be wise to wait to see more concrete evidence of an uptrend before entering into a position.
Their meager 1.18% distribution yield will also not provide much protection against any further moves to the downside, making it essential to have some form of a hedge up for any current or new positions in ACES.
ACES has support at the $42.45 (Volume Sentiment: Sellers, 1.67:1), $42.21 (Volume Sentiment: Sellers, 1.67:1), $42.17 (Volume Sentiment: Sellers, 1.67:1) & $40.14/share (52-Week Low; Volume Sentiment: NULL, 0:0*) price levels, with resistance at the $42.87 (Volume Sentiment: Sellers, 1.67:1), $43.30 (Volume Sentiment: Sellers, 1.21:1), $43.72 (Volume Sentiment: Sellers, 1.21:1) & $44.50/share (Volume Sentiment: Buyers, 1.36:1) price levels.
CNYA, the iShares MSCI China ETF has lost -14.55% over the past year, declining -17.62% from their 52-week high in August of 2022, while recovering +6.36% from their 52-week low in October of 2022 (ex-distributions).
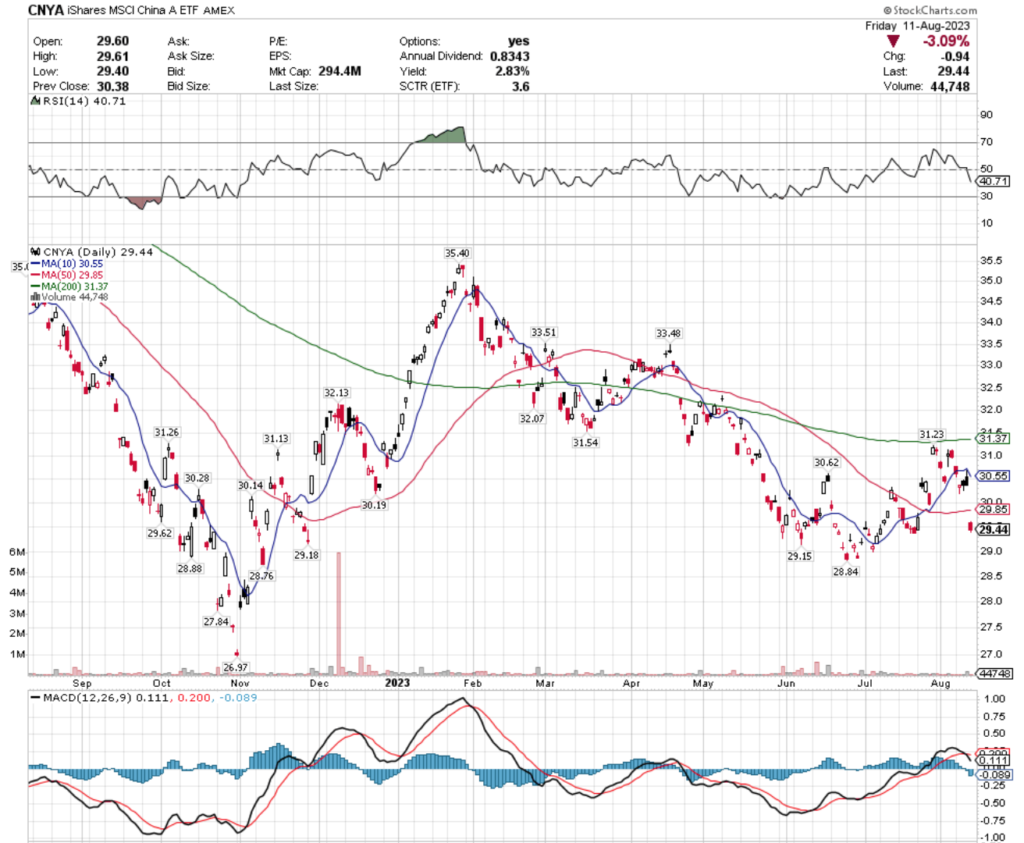
Their RSI is trending towards oversold & their MACD is in bearish decline after Friday’s -3.09% gap down session.
Last week’s volume was -49.25% below the year prior’s average volume (60,680 vs. 119,572) signaling that there is uncertainty among market participants at the current price levels.
The inability of their moving averages to hold up as support levels further confirms that, as from Monday’s session onward they continued to sink beneath the 10 day moving average & then the 50 DMA as well.
Wednesday’s hanging man candlestick & Thursday’s shooting star that was held underneath the 10 day moving average predicted the sharp decline seen Friday & investors should remain weary of this name until they’ve established more solid footing beneath them.
While they do offer a 2.83% distribution yield for long-term holders, that is limited protection against further declines.
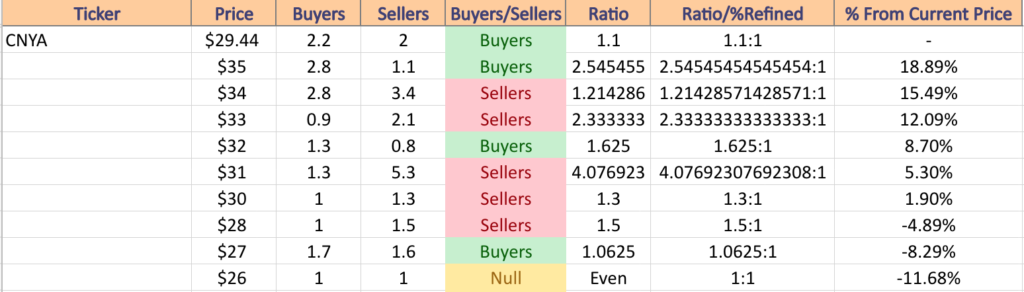
CNYA has support at the $29.18 (Volume Sentiment: Buyers, 1.1:1), $29.15 (Volume Sentiment: Buyers, 1.1:1), $28.88 (Volume Sentiment: Sellers, 1.5:1) & $28.84/share (Volume Sentiment: Sellers, 1.5:1) price levels, with resistance at the $29.62 (Volume Sentiment: Buyers, 1.1:1), $29.85 (50 Day Moving Average; Volume Sentiment: Buyers, 1.1:1), $30.14 (Volume Sentiment: Sellers, 1.3:1) & $30.19/share (Volume Sentiment: Sellers, 1.3:1) price levels.
GDX, the VanEck Vectors Gold Miners ETF has advanced +12.5% over the past year, but has fallen -18.75% from their 52-week high in May of 2023, while recovering +36.9% from their 52-week low in September of 2022 (ex-distributions).
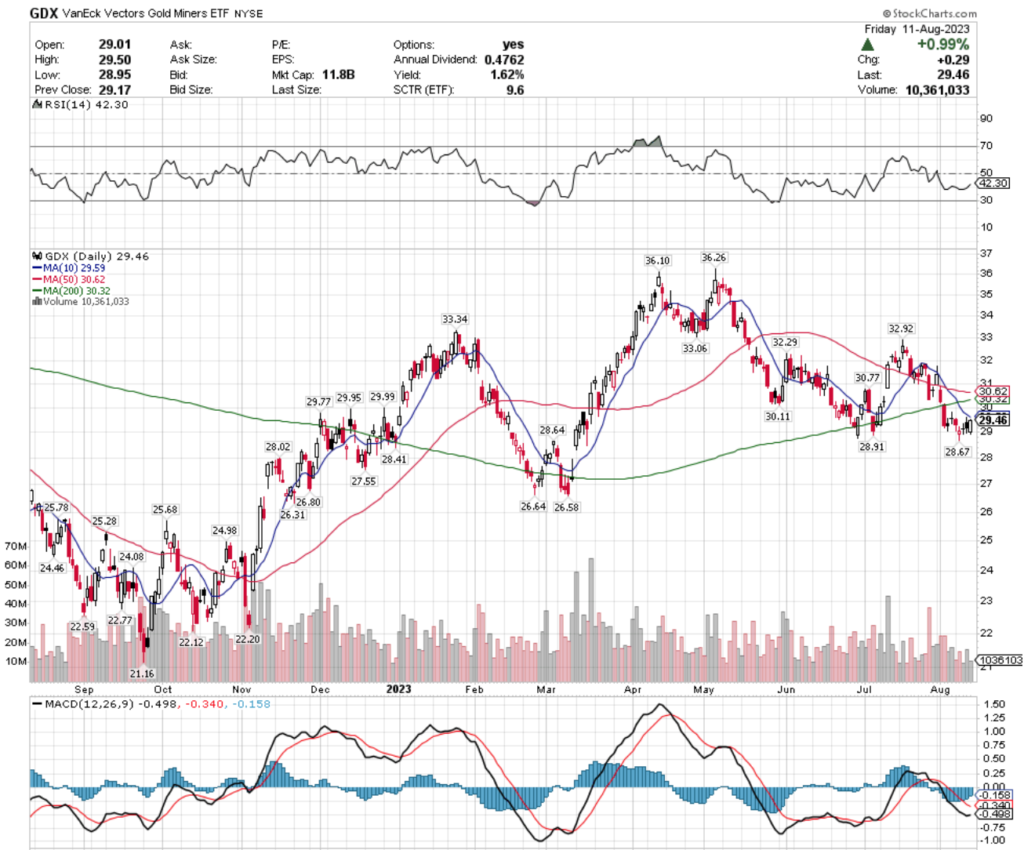
Their RSI is trending back up towards neutral at 42.3, with their MACD trending back towards a bullish crossover.
Last week’s volume was -46.07% below the year prior’s average (12,724,480 vs. 23,594,986) signaling hesitance among investors.
Tuesday’s spinning top & Wednesday’s doji also support this sentiment, as investors do not seem confident in GDX’s current price level at this time.
They offer a 1.62% distribution yield for long-term holders, which does not provide much protection against downside moves.
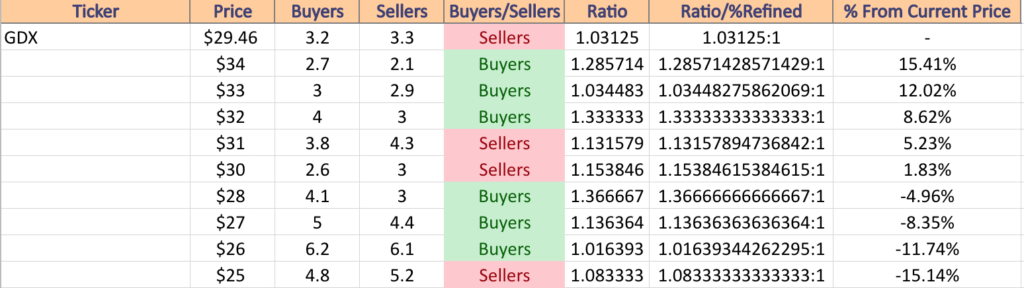
GDX has support at the $28.91 (Volume Sentiment: Buyers, 1.37:1), $28.67 (Volume Sentiment: Buyers, 1.37:1), $28.41 (Volume Sentiment: Buyers, 1.37:1) & $28.02/share (Volume Sentiment: Buyers, 1.37:1) price levels, with resistance at the $29.59 (10 Day Moving Average; Volume Sentiment: Sellers, 1.03:1), $29.77 (Volume Sentiment: Sellers, 1.03:1), $29.95 (Volume Sentiment: Sellers, 1.03:1) & $29.99/share (Volume Sentiment: Sellers, 1.03:1) price levels.
Tying It All Together
Next week is quiet on the data reports front on Monday, with Tuesday featuring U.S. Retail Sales, Retail Sales Minus Autos, Import Price Index, Import Price Index Minus Fuel & the Empire State Manufacturing Survey at 8:30 am, followed by Business Inventories data at 10 am.
Monday’s earnings reports include Alcon, Heron Therapeutics, JinkoSolar & Monday.com.
Home Depot is scheduled to report earnings on Tuesday, as are Agilent, Cardinal Health, CAVA Group, Coherent, H & R Block, HUYA, IHS Holding, On, Sea Limited & Tencent Music.
Wednesday kicks off with Housing Starts at 8:30 am, followed by Industrial Production & Capacity Utilization at 9:15 am & the FOMC Minutes of July’s Meeting at 2 pm.
Cisco Systems reports earnings on Wednesday, as does 3D Systems, Alarm.com, AppLovin, Ballard Power, Clean Energy Fuels, Coeur Mining, Enersys, Genpact, GoodRX, Illumina, Infinera, Jack in the Box, Jazz Pharma, Lions Gate Entertainment, LL Flooring Holdings, Manulife Financial, Nomad Foods, ODP Corp., OGE Energy, Pan Am Silver, PENN Entertainment, Plug Power, Reynolds Consumer Products, Roblox, Statasys, Taboola, The Beauty Health Company, The Trade Desk, Valvoline, Vertex, Warby Parker, Wendy’s & Wynn Resorts.
Thursday features Initial Jobless Claims & the Philadelphia Fed Manufacturing Survey at 8:30 am, followed by the U.S. Leading Economic Indicators at 10 am.
Walmart headlines the earnings reports for Thursday, as well as Applied Materials, Bilibili, Dole, Farfetch, Keysight Technologies, Lumentum, Ross Stores & Tapestry.
Friday has no economic data being released, with earnings reports scheduled to come from Buckle, Deere, Estee Lauder, Palo Alto Networks & VIPShop.
See you back here next week!
*** I DO NOT OWN SHARES OR OPTIONS CONTRACT POSITIONS IN SPY, QQQ, IWM, DIA, ERX, DXJ, EDIV, COWZ, UBT, ACES, CNYA or GDX AT THE TIME OF PUBLISHING THIS ARTICLE ***