Carrier Global Corp. stock trades under the ticker CARR & has had a strong past few months following a five month consolidation range that they traded in to kick off 2023.
Strength in the homebuilding & construction industries this year has helped to drive strength to CARR stock’s results in 2023.
They’ve just come off of a 52-week high that was achieved on 8/1, with their technical indicators & oscillators signaling that there is a cool-off period coming in the near-term, which makes it important to have an understanding of how the buyers & sellers have behaved at different price levels in recent history.
The Price:Volume analysis below seeks to display the volume at specific share-price levels from over the past two-to-three years & is intended to serve as a reference point for how investors viewed CARR stock’s value at each level.
It also includes a list of moving averages, as well as support & resistance levels, which will be marked in bold.
Carrier Global Corp. CARR Stock’s Price:Volume Sentiment Broken Down
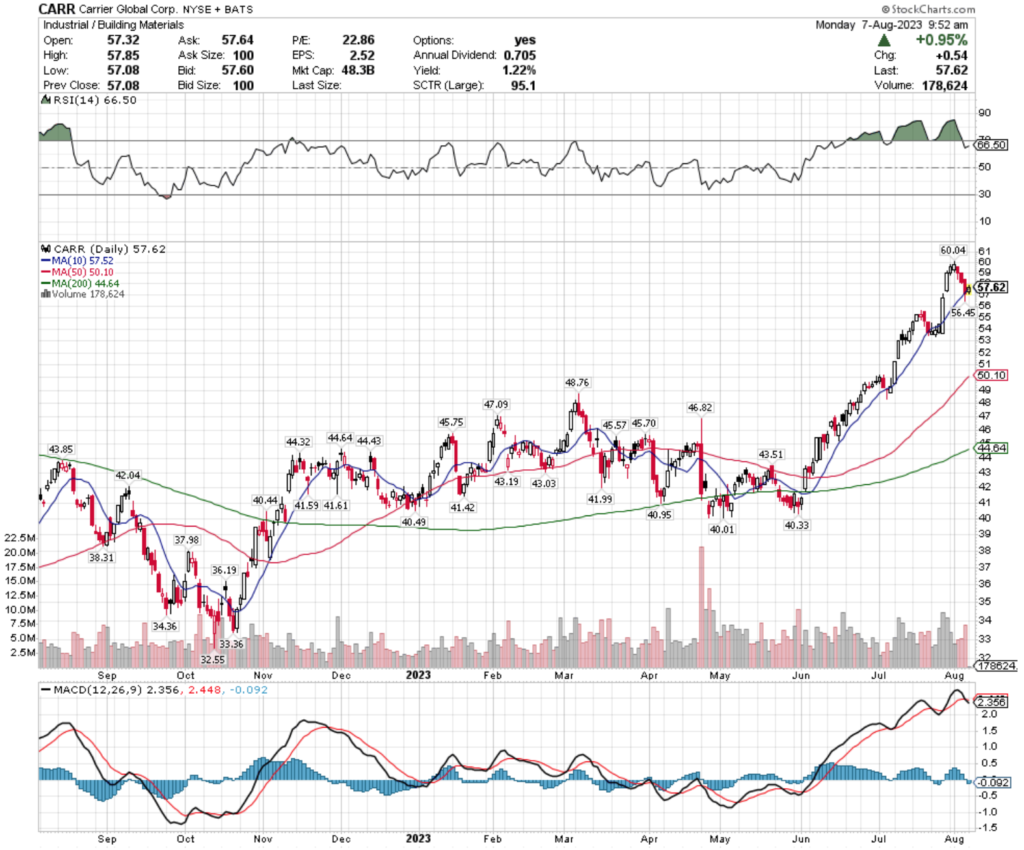
As noted above, CARR reached their 52-week high about one week ago & has begun to consolidate ever since.
At the time of taking the screenshot above (9:52 am on 8/7/2023), their share price was being supported by their 10 day moving average, but is hovering 0.17% above the support level.
Their RSI has just declined from oversold territory, but is still close to the oversold level, currently at 66.5 & their MACD has just bearishly crossed over last week.
Trading volumes over the past week (ex-today’s) are 14% higher than the average volumes for the past year (5,481,540 vs. 4,803,044), as investors were eager to take profits after a strong run that was capped off by a gap up on July 28,2023.
The session where they claimed their 52-week high closed in a spinning top candlestick, which is a sign of uncertainty among market participants & foretold the performance that we have seen over the past week.
Further weakness has been signaled by the hanging men candlesticks on 8/2 & 8/4, and while today’s session isn’t halfway over, the current chart is signaling that today’s session will close in a bearish harami pattern, which indicates further trouble on the horizon.
Support levels near their current price over the past year are scarce for CARR, who has spent much of this year relatively rangebound, which occurred on very light volume compared to other recent sessions, which investors could infer the coming weakness from.
The nearest support beyond the 10 day moving average is currently the 50 day moving average, which is -13.05% below the current price at $50.10.
With so much space without stable footing, it is important to be able to understand how investors have behaved at each price level that they have traded at in recent history in order to understand where they may find footing for support, or how far they can potentially fall.
The volume data covers the past 2-3 years, so the chart below has been added to help visualize how the price has moved over that time period.
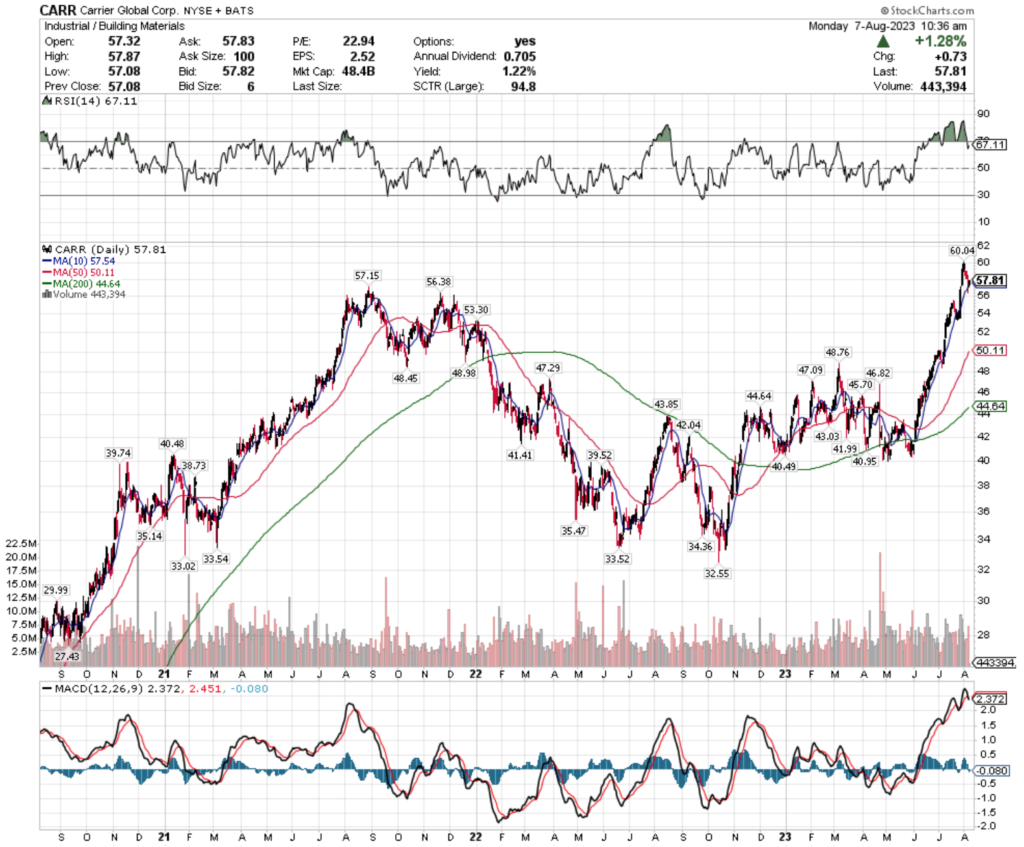
The bold prices on the image below denote the moving average levels just listed & the bold entries in the list form of the analysis under the images include other levels of support.
Each corresponding price level using a ratio of Buyers:Sellers (or Sellers:Buyers), NULL values denote that there was not enough data, so the ratio would’ve been 0:0.
Ratios with a 0 for the denominator/constant are denoted with an *, but are reported as is, as we are accounting for volume/sentiment.
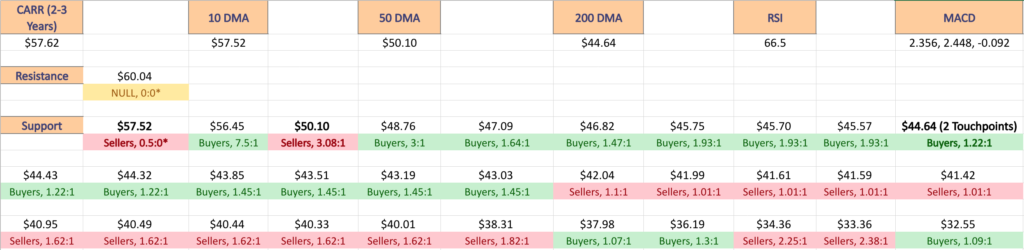
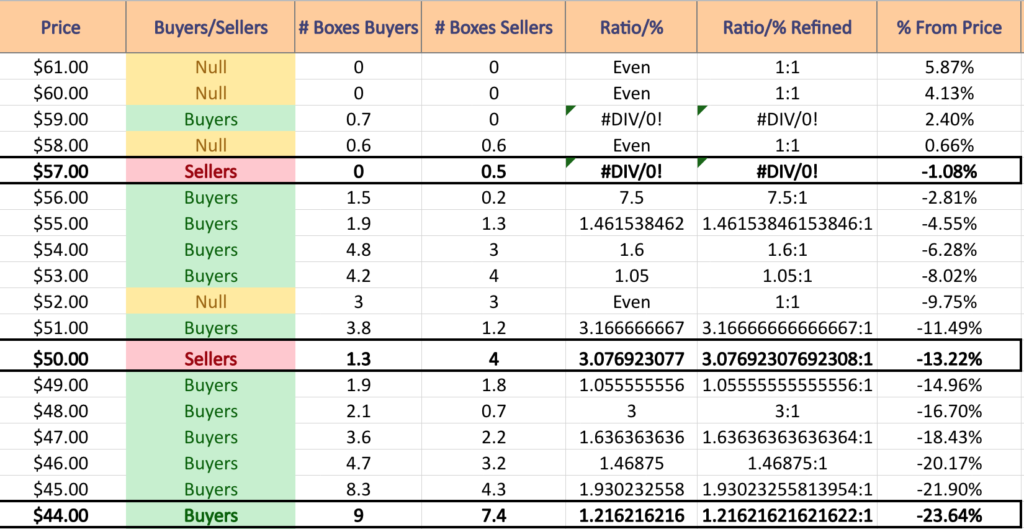
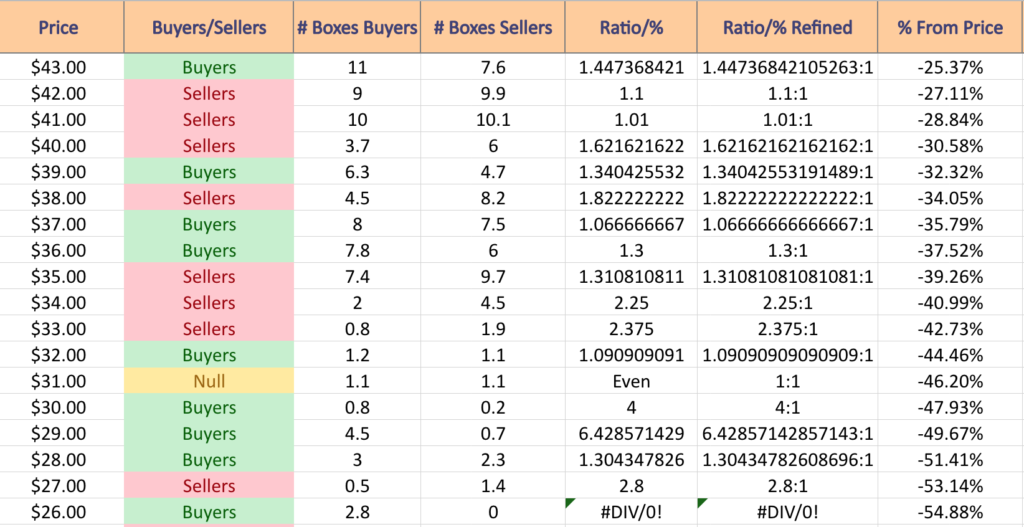
Carrier Global Corp. CARR Stock’s Volume By Price Level
$61 – NULL – 0:0*, +5.87% From Current Price Level
$60 – NULL – 0:0*, +4.13% From Current Price Level
$59 – Buyers – 0.7:0*, +2.4% From Current Price Level
$58 – Even – 1:1, +0.66% From Current Price Level
$57 – Sellers – 0.5:0*, -1.08% From Current Price Level – 10 Day Moving Average
$56 – Buyers – 7.5:1, -2.81% From Current Price Level
$55 – Buyers – 1.46:1, -4.55% From Current Price Level
$54 – Buyers – 1.6:1, -6.28% From Current Price Level
$53 – Buyers – 1.05:1, -8.02% From Current Price Level
$52 – Even – 1:1, -9.75% From Current Price Level
$51 – Buyers – 3.17:1, -11.49% From Current Price Level
$50 – Sellers – 3.08:1, -13.22% From Current Price Level – 50 Day Moving Average
$49 – Buyers – 1.06:1, -14.96% From Current Price Level
$48 – Buyers – 3:1, -16.7% From Current Price Level
$47 – Buyers – 1.64:1, -18.43% From Current Price Level
$46 – Buyers – 1.47:1, -20.17% From Current Price Level
$45 – Buyers – 1.93:1, -21.9% From Current Price Level
$44 – Buyers – 1.22:1, -23.64% From Current Price Level – 200 Day Moving Average
$43 – Buyers – 1.45:1. -25.37% From Current Price Level
$42 – Sellers – 1.1:1, -27.11% From Current Price Level
$41 – Sellers – 1.01:1, -28.84% From Current Price Level
$40 – Sellers – 1.62:1, -30.58% From Current Price Level
$39 – Buyers – 1.34:1. -32.32% From Current Price Level
$38 – Sellers – 1.82:1, -34.05% From Current Price Level
$37 – Buyers – 1.07:1, -35.79% From Current Price Level
$36 – Buyers – 1.3:1, -37.52% From Current Price Level
$35 – Sellers – 1.31:1, -39.26% From Current Price Level
$34 – Sellers – 2.25:1, -40.99% From Current Price Level
$33 – Sellers – 2.38:1, -42.73% From Current Price Level
$32 – Buyers – 1.09:1, -44.46% From Current Price Level
$31 – Even – 1:1, -46.2% From Current Price Level
$30 – Buyers – 4:1, -47.93% From Current Price Level
$29 – Buyers – 6.43:1, -49.67% From Current Price Level
$28 – Buyers – 1.3:1, -51.41% From Current Price Level
$27 – Sellers – 2.8:1, -53.14% From Current Price Level
$26 – Buyers – 2.8:0*, -54.88% From Current Price Level
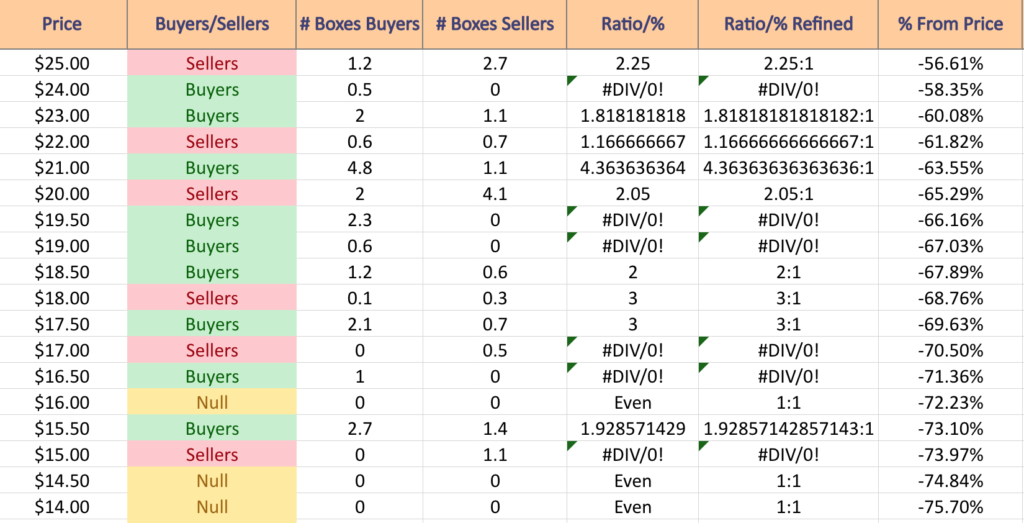
$25 – Sellers – 2.25:1, -56.61% From Current Price Level
$24 – Buyers – 0.5:0*, -58.35% From Current Price Level
$23 – Buyers – 1.82:1, -60.08% From Current Price Level
$22 – Sellers – 1.17:1, -61.82% From Current Price Level
$21 – Buyers – 4.36:1, -63.55% From Current Price Level
$20 – Sellers – 2.05:1, -65.29% From Current Price Level
$19.50 – Buyers – 2.3:0*, -66.16% From Current Price Level
$19 – Buyers – 0.6:0*, -67.03% From Current Price Level
$18.50 – Buyers – 2:1, -67.89% From Current Price Level
$18 – Sellers – 3:1, -68.76% From Current Price Level
$17.50 – Buyers – 3:1, -69.63% From Current Price Level
$17 – Sellers – 0.5:0*, -70.5% From Current Price Level
$16.50 – Buyers – 1:0*, -71.36% From Current Price Level
$16 – NULL – 0:0*, -72.23% From Current Price Level
$15.50 – Buyers – 1.93:1, -73.1% From Current Price Level
$15 – Sellers – 1.1:0*, -73.97% From Current Price Level
$14.50 – NULL – 0:0*, -74.84% From Current Price Level
$14 – NULL – 0:0*, -75.7% From Current Price Level
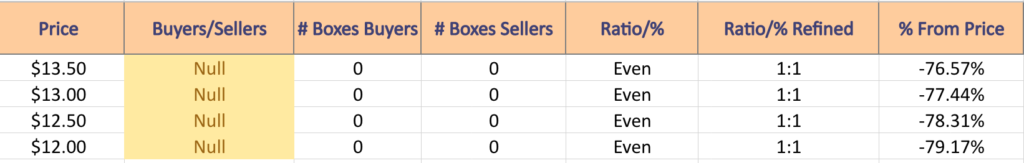
$13.50 – NULL – 0:0*, -76.57% From Current Price Level
$13 – NULL – 0:0*, -77.44% From Current Price Level
$12.50 – NULL – 0:0*, -78.31% From Current Price Level
$12 – NULL – 0:0*, -79.17% From Current Price Level
Tying It All Together
The list & image above paint the picture as to how investors & traders have behaved at various price levels that CARR has been at over the past two-to-three years.
It is not meant to serve as investment/trading advice, and is simply a way to visualize what investor/trader sentiment has been like at each of the price levels mentioned, as well as what it was at levels of support & resistance that are denoted in the image & list.
As always, do your own due diligence before making investing/trading decisions.
For more on the methodology on how the data was collected & put together, please refer to our original Price:Volume analysis.
*** I DO NOT OWN SHARES OR OPTIONS CONTRACT POSITIONS IN CARR AT THE TIME OF PUBLISHING THIS ARTICLE ***