Meta Platforms, Inc. stock trades under the ticker META & has steadily climbed from their 52-week low in November of 2022 to reach their 52-week high last week.
A gap up in February & one in April of 2023 have provided much of the catalyst that has fueled this ascent.
Given that they are now just beneath a 52-week high, it is time to begin looking to see how strong their support levels are in order to get an idea as to how far they might fall in the event of a correction.
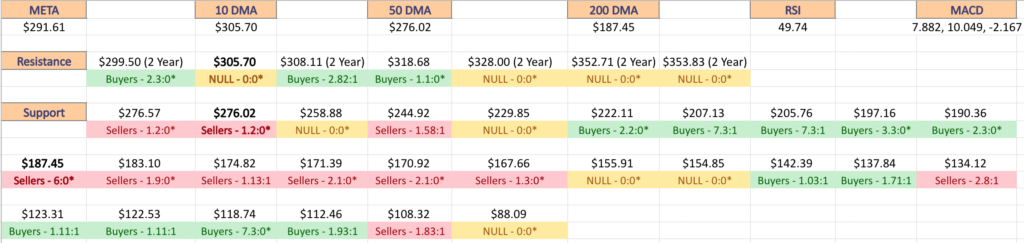
The Price:Volume analysis below seeks to display the volume at specific share-price levels from over the past one-to-two years & is intended to serve as a reference point for how investors viewed META stock’s value at each level.
It also includes a list of moving averages, as well as support & resistance levels, which will be marked in bold.
Meta Platforms, Inc. META Stock’s Price:Volume Sentiment Broken Down
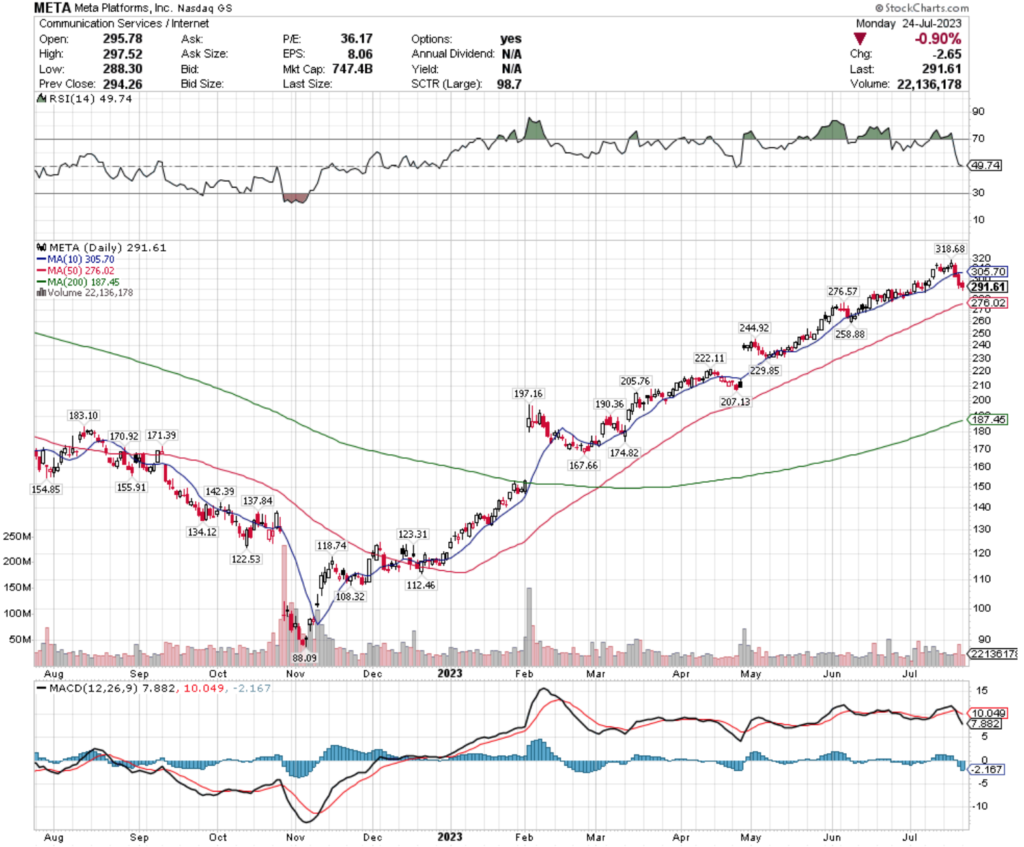
Their RSI is neutral at 49.74, with a bearish MACD after declining the past three days from their 52-week high.
Investors have begun to get skittish, with average trading volumes falling -17.83% over the past week (26,448,950 vs. 32,188,510), indicating indecisiveness on the part of market participants.
Last Thursday’s session saw the breakdown of the 10 day moving average as a support level, with the share price breaking through the 20 day moving average on Friday.
Yesterday’s spinning top candlestick indicates that there is further uncertainty in the near-term, as they approach the next two support levels, $276.57 (-5.16%) & $276.02 (50 Day Moving Average, -5.35%), making it important to understand how market participants have behaved at other price levels in recent history.
The volume data covers the past 1-2 years, so the chart below has been added to help visualize how the price has moved over that time period.
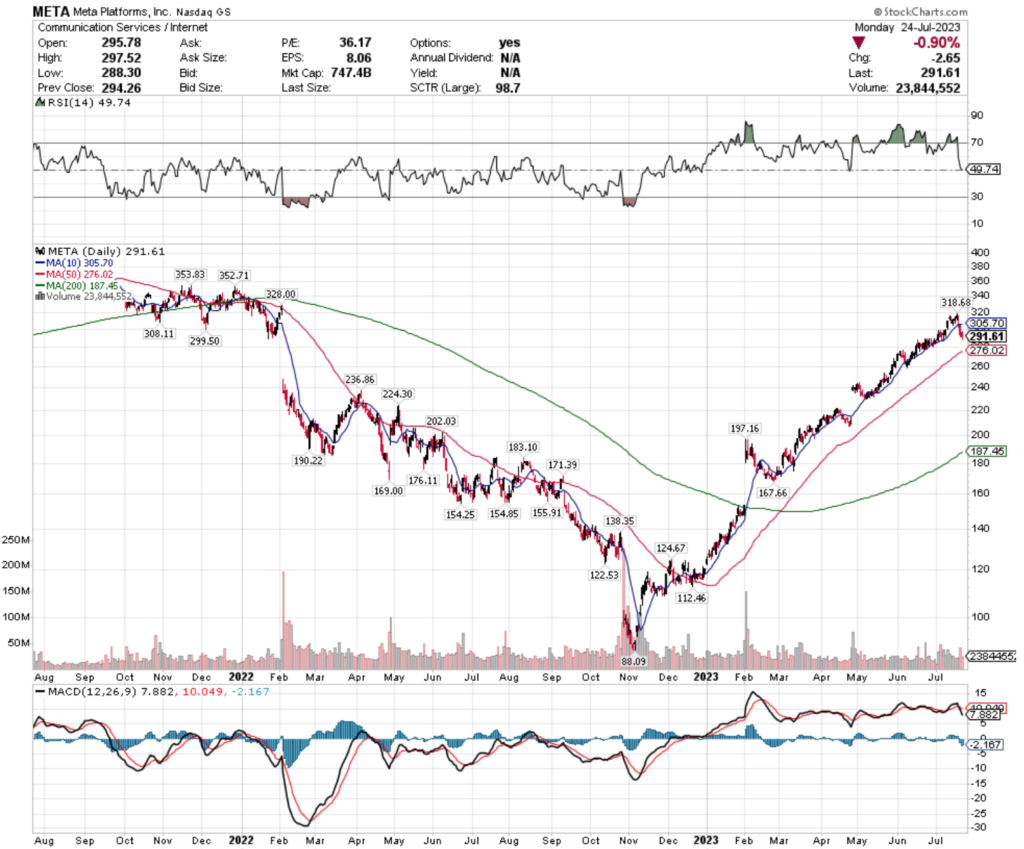
The bold prices on the image below denote the moving average levels just listed & the bold entries in the list form of the analysis under the images include other levels of support.
Each corresponding price level using a ratio of Buyers:Sellers (or Sellers:Buyers), NULL values denote that there was not enough data, so the ratio would’ve been 0:0.
Ratios with a 0 for the denominator/constant are denoted with an *, but are reported as is, as we are accounting for volume/sentiment.
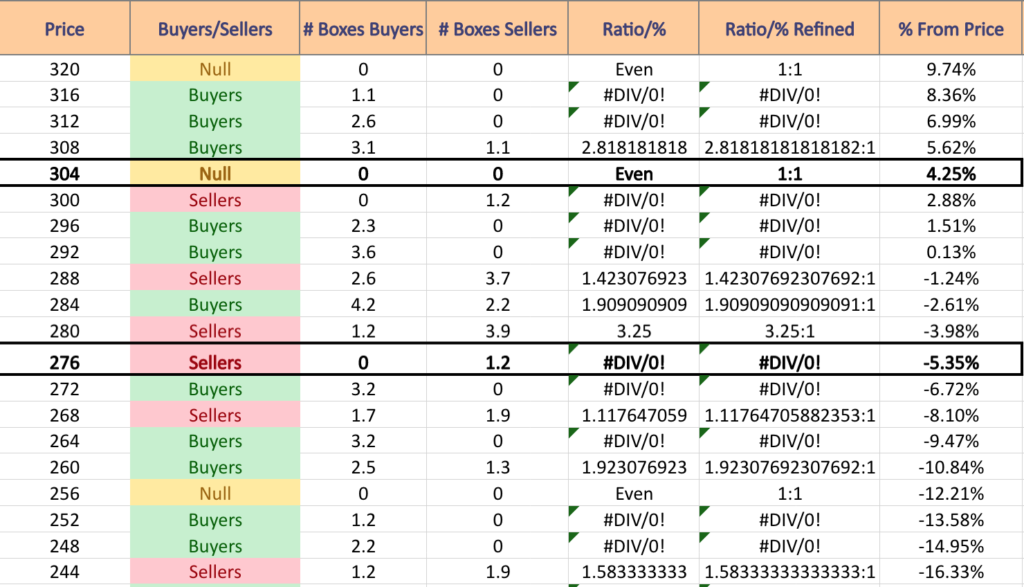
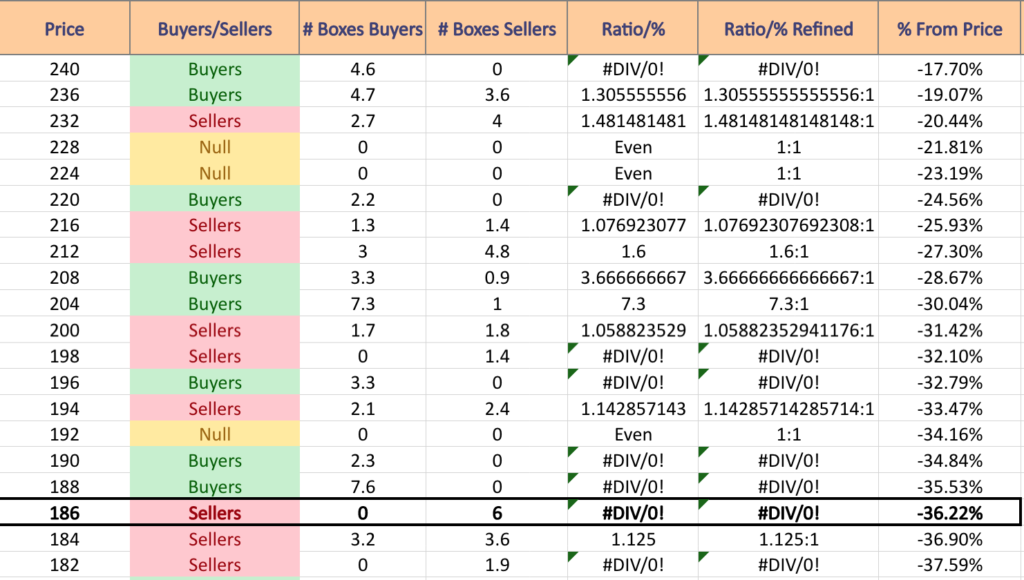
Meta Platforms, Inc. META Stock’s Volume By Price Level
$320 – NULL – 0:0*, +9.74% From Current Price
$316 – Buyers – 1.1:0*, +8.36% From Current Price (52-Week High)
$312 – Buyers – 2.6:0*, +76.99% From Current Price
$308 – Buyers – 2.82:1, +5.62% From Current Price (2 Year Chart)
$304 – NULL – 0:0*, +4.25% From Current Price – 10 Day Moving Average
$300 – Sellers – 1.2:0*, +2.88% From Current Price
$296 – Buyers – 2.3:0*,+1.51% From Current Price (2 Year Chart)
$292 – Buyers – 3.6:0*, +0.13% From Current Price
$288 – Sellers – 1.42:1, -1.24% From Current Price
$284 – Buyers – 1.91:1, -2.61% From Current Price
$280 – Sellers – 3.25:1, -3.98% From Current Price
$276 – Sellers – 1.2:0*, -5.35% From Current Price
$272 – Buyers – 3.2:0*, -6.72% From Current Price
$268 – Sellers – 1.12:1, -8.1% From Current Price
$264 – Buyers – 3.2:0*, -9.47% From Current Price
$260 – Buyers – 1.92:1, -10.84% From Current Price
$256 – NULL – 0:0*, -12.21% From Current Price
$252 – Buyers – 1.2:0*, -13.58% From Current Price
$248 – Buyers – 2.2:0*, -14.95% From Current Price
$244 – Sellers – 1.58:1, -16.33% From Current Price
$240 – Buyers – 4.6:0*, -17.7% From Current Price
$236 – Buyers – 1.31:1, -19.07% From Current Price
$232 – Sellers – 1.48:1, -20.44% From Current Price
$228 – NULL – 0:0*, -21.81% From Current Price
$224 – NULL – 0:0*, -23.19% From Current Price
$220 – Buyers – 2.2:0*, -24.56% From Current Price
$216 – Sellers – 1.08:1, -25.93% From Current Price
$212 – Sellers – 1.6:1, -27.3% From Current Price
$208 – Buyers – 3.67:1, -28.67% From Current Price
$204 – Buyers – 7.3:1, -30.04% From Current Price
$200 – Sellers – 1.06:1, -31.42% From Current Price
$198 – Sellers – 1.4:0*, -32.1% From Current Price
$196 – Buyers – 3.3:0*, -32.79% From Current Price
$194 – Sellers – 1.14:1. -33.47% From Current Price
$192 – NULL – 0:0*, -34.16% From Current Price
$188 – Buyers – 7.6:0*, -34.84% From Current Price
$186 – Sellers – 6:0*, -35.53% From Current Price
$184 – Sellers – 1.13:1, -36.22% From Current Price
$182 – Sellers – 1.9:0*, -36.9% From Current Price
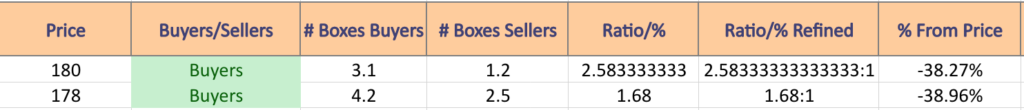
$180 – Buyers – 2.58:1, -37.59% From Current Price
$178 – Buyers – 1.68:1, -38.27% From Current Price
$176 – Sellers – 4.2:0*, -39.65% From Current Price
$174 – Sellers – 1.13:1, -40.33% From Current Price
$172 – Sellers – 1.86:1, -41.02% From Current Price
$170 – Sellers – 2.1:0*, -41.7% From Current Price
$168 – NULL – 0:0*, -42.39% From Current Price
$166 – Sellers – 1.3:0*, -43.07% From Current Price
$164 – Buyers – 1.5:0*, -43.76% From Current Price
$162 – Buyers – 4.2:1, -44.45% From Current Price
$160 – Sellers – 3:1, -45.13% From Current Price
$158 – Sellers – 2:0*, -45.82% From Current Price
$156 – Sellers – 1:0*, -46.5% From Current Price
$154 – NULL – 0:0*, -47.19% From Current Price
$152 – Buyers – 1.27:1, -47.88% From Current Price
$150 – Sellers – 1.11:1, -48.56% From Current Price
$148 – Buyers – 1.63:1, -49.25% From Current Price
$146 – Sellers – 3.92:1, -49.93% From Current Price
$144 – NULL – 0:0*, -50.62% From Current Price
$142 – Buyers – 1.03:1, -51.3% From Current Price
$140 – Buyers – 1.14:1, -51.99% From Current Price
$138 – Buyers – 3.62:1, -52.68% From Current Price
$136 – Buyers – 1.71:1, -53.36% From Current Price
$134 – Sellers – 2.8:1, -54.05% From Current Price
$132 – Sellers – 1.27:1, -54.73% From Current Price
$130 – Sellers – 1.19:1, -55.42% From Current Price
$128 – Sellers – 11:0*, -56.11% From Current Price
$126 – Sellers – 2.47:1, -56.79% From Current Price
$124 – Buyers – 1.9:0*, -57.48% From Current Price
$122 – Buyers – 1.11:1, -58.16% From Current Price
$120 – Buyers – 8:0*, -58.85% From Current Price
$118 – Buyers – 7.3:0*, -59.53% From Current Price
$116 – Buyers – 1.03:1, -60.22% From Current Price
$114 – Sellers- 1.02:1, -60.91% From Current Price
$112 – Buyers – 1.93:1, -61.59% From Current Price
$110 – Buyers – 2.43:1, -62.28% From Current Price
$108 – Sellers – 1.83:1, -62.96% From Current Price
$106 – NULL – 0:0*, -63.65% From Current Price
$104 – NULL – 0:0*, -64.34% From Current Price
$102 – NULL – 0:0*, -65.02% From Current Price
$100 – Buyers – 5.3:0*, -65.71% From Current Price
$99 – Buyers – 4.9:0*, -66.05% From Current Price
$98 – NULL – 0:0*, -66.39% From Current Price
$97 – Sellers – 11.7:0*, -66.74% From Current Price
$96 – Buyers – 1.52:1, -67.08% From Current Price
$95 – Buyers – 5.6:0*, -67.42% From Current Price
$94 – NULL – 0:0*, -67.77% From Current Price
$93 – Sellers – 6.1:0*, -68.11% From Current Price
$92 – NULL – 0:0*. -68.45% From Current Price
$91 – NULL – 0:0*, -68.79% From Current Price
$90 – Sellers – 1.25:1, -69.14% From Current Price
$89 – Sellers – 3:0*, -69.48% From Current Price
$88 – NULL – 0:0*, -69.82% From Current Price
Tying It All Together
The list & image above paint the picture as to how investors & traders have behaved at various price levels that META has been at over the past one-to-two years.
It is not meant to serve as investment/trading advice, and is simply a way to visualize what investor/trader sentiment has been like at each of the price levels mentioned, as well as what it was at levels of support & resistance that are denoted in the image & list.
As always, do your own due diligence before making investing/trading decisions.
For more on the methodology on how the data was collected & put together, please refer to our original Price:Volume analysis.
*** I DO NOT OWN SHARES OR OPTIONS CONTRACT POSITIONS IN META AT THE TIME OF PUBLISHING THIS ARTICLE ***