Eli Lilly & Co. stock trades under the ticker LLY & has had a remarkable past year, climbing 84.69% from their 52-week low in September of 2022 (ex-yields).
LLY has continued to climb higher after last week’s large gap up session & continues to establish new 52-week highs, making it an important time to check in & see how market participant sentiment has been at the various price levels they have traded at over the past one-to-two years.
By doing so, it will be easier to visualize what support levels may be stronger than others when LLY’s price corrects & people begin to take their profits down from the table.
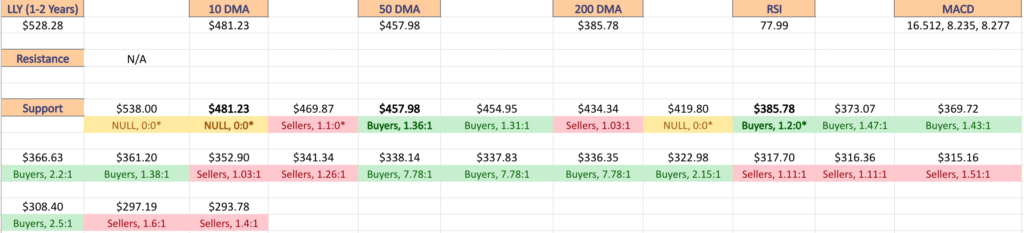
The Price:Volume analysis below seeks to display the volume at specific share-price levels from over the past two-to-three years & is intended to serve as a reference point for how investors viewed LLY stock’s value at each level.
It also includes a list of moving averages, as well as support & resistance levels, which will be marked in bold.
Eli Lilly & Co. LLY Stock’s Price:Volume Sentiment Broken Down
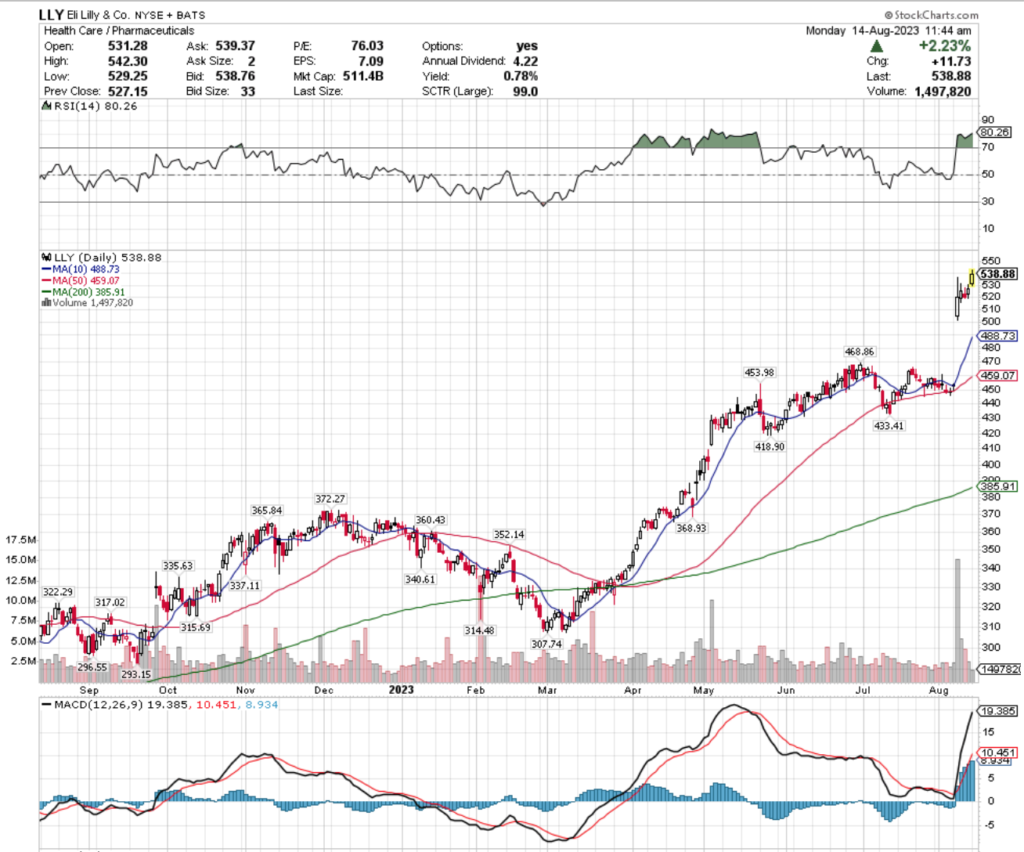
Their RSI is overbought following last week’s gap up session & their MACD is signaling very bullish & standing almost vertical.
One note on their RSI, earlier this year LLY traded from early April until almost the end of May with an RSI that was in overbought territory, however this was on steady day-over-day climbing & not due to a large gap up.
Last week’s volumes were 97.1% higher than the average volume for the past year (5,909,900 vs. 2,998,360), a signal of strength & conviction that confirms that 11.43% price gap up & continued strength.
It will be interesting to see what support levels look like by the time that the 10 day moving average comes closer to their share price, as the 10 DMA is currently about halfway through the gap traveling towards the price, while the 50 DMA still has yet to reach the window.
In the event of a correction in price that may pose a problem for market participants if the price is able to break below the 10 day moving average as there will not be support to stop the gap from filling.
Following Tuesday’s gap up, Wednesday continued the climb higher but ended on a spinning top, with Thursday’s inverted hammer sending the share price higher again on Friday & today.
Given everything mentioned above & that a 10% correction from the current price levels puts LLY at ~$484/share with only the 10 day moving average to act as support, it is important to have a breakdown of how they’ve traded at different price levels to see if that can provide clues to market behavior when there are no true support levels nearby.
The bold prices on the image below denote the moving average levels just listed & the bold entries in the list form of the analysis under the images include other levels of support.
Each corresponding price level using a ratio of Buyers:Sellers (or Sellers:Buyers), NULL values denote that there was not enough data, so the ratio would’ve been 0:0.
Ratios with a 0 for the denominator/constant are denoted with an *, but are reported as is, as we are accounting for volume/sentiment.
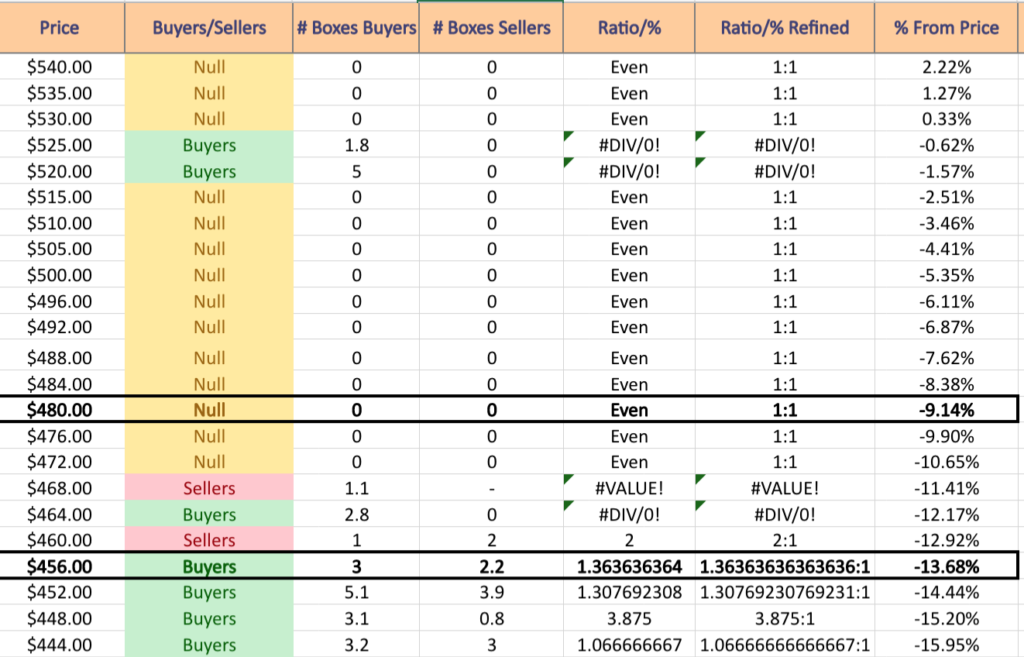
Eli Lilly & Co. LLY Stock’s Volume By Price Level
$540 – NULL – 0:0*; +2.22% From Current Price Level
$535 – NULL – 0:0*; +1.27% From Current Price Level
$530 – NULL – 0:0*; +0.33% From Current Price Level
$525 – Buyers – 1.8:0*; -0.62% From Current Price Level
$520 – Buyers – 5:0*; -1.57% From Current Price Level
$515 – NULL – 0:0*; -2.51% From Current Price Level
$510 – NULL – 0:0*; -3.46% From Current Price Level
$505 – NULL – 0:0*; -4.41% From Current Price Level
$500 – NULL – 0:0*; -5.35% From Current Price Level
$496 – NULL – 0:0*; -6.11% From Current Price Level
$492 – NULL – 0:0*; -6.87% From Current Price Level
$488 – NULL – 0:0*; -7.62% From Current Price Level
$484 – NULL – 0:0*; -8.38% From Current Price Level
$480 – NULL – 0:0*; -9.14% From Current Price Level – 10 Day Moving Average
$476 – NULL – 0:0*; -9.9% From Current Price Level
$472 – NULL – 0:0*; -10.65% From Current Price Level
$468 – Sellers – 1.1:0*; -11.41% From Current Price Level
$464 – Buyers – 2.8:0*; -12.17% From Current Price Level
$460 – Sellers – 2:1; -12.92% From Current Price Level
$456 – Buyers – 1.36:1; -13.68% From Current Price Level – 50 Day Moving Average
$452 – Buyer s- 1.31:1; -14.44% From Current Price Level
$448 – Buyers – 3.88:1; -15.2% From Current Price Level
$444 – Buyers – 1.07:1; -15.95% From Current Price Level
$440 – Buyers – 10:1; -16.71% From Current Price Level
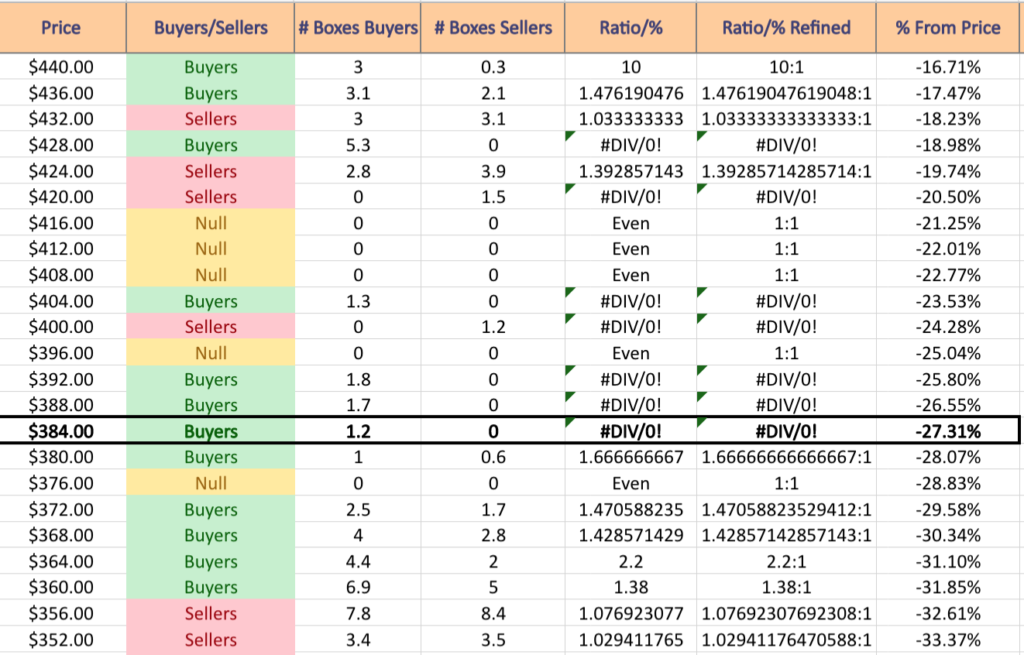
$436 – Buyers – 1.48:1; -17.47% From Current Price Level
$432 – Sellers – 1.03:1; -18.23% From Current Price Level
$428 – Buyers – 5.3:0*; -18.98% From Current Price Level
$424 – Sellers – 1.39:1; -19.74% From Current Price Level
$420 – Sellers – 1.5:0*; -20.5% From Current Price Level
$416 – NULL – 0:0*; -21.25% From Current Price Level
$412 – NULL – 0:0*; -22.01% From Current Price Level
$408 – NULL – 0:0*; -22.77% From Current Price Level
$404 – Buyers – 1.3:0*; -23.53% From Current Price Level
$400 – Sellers – 1.2:0*; -24.28% From Current Price Level
$396 – NULL – 0:0*; -25.04% From Current Price Level
$392 – Buyers – 1.8:0*; -25.8% From Current Price Level
$388 – Buyers – 1.7:0*; -26.55% From Current Price Level
$384 – Buyers – 1.2:0*; -27.31% From Current Price Level – 200 Day Moving Average
$380 – Buyers – 1.67:1; -28.07% From Current Price Level
$376 – NULL – 0:0*; -28.83% From Current Price Level
$372 – Buyers – 1.47:1; -29.58% From Current Price Level
$368 – Buyers – 1.43:1; -30.34% From Current Price Level
$364 – Buyers – 2.2:1; -31.1% From Current Price Level
$360 – Buyers – 1.38:1; -31.85% From Current Price Level
$356 – Sellers – 1.08:1; -32.61% From Current Price Level
$352 – Sellers – 1.03:1; -33.37% From Current Price Level
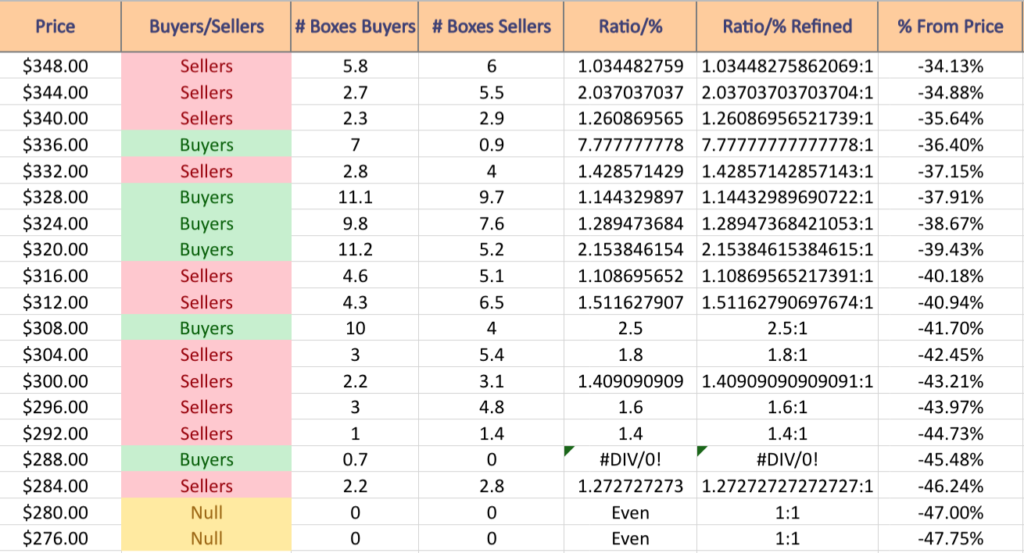
$348 – Sellers – 1.03:1; -34.13% From Current Price Level
$344 – Sellers – 2.04:1; -34.88% From Current Price Level
$340 – Sellers – 1.26:1; -35.64% From Current Price Level
$336 – Buyers – 7.78:1; -36.4% From Current Price Level
$332 – Sellers – 1.43:1; -37.15% From Current Price Level
$328 – Buyers – 1.14:1; -37.91% From Current Price Level
$324 – Buyers – 1.29:1; -38.67% From Current Price Level
$320 – Buyers – 2.15:1; -39.43% From Current Price Level
$316 – Sellers – 1.11:1; -40.18% From Current Price Level
$312 – Sellers – 1.51:1; -40.94% From Current Price Level
$308 – Buyers – 2.5:1; -41.7% From Current Price Level
$304 – Sellers – 1.8:1; -42.45% From Current Price Level
$300 – Sellers – 1.41:1; -43.21% From Current Price Level
$296 – Sellers – 1.6:1; -43.97% From Current Price Level
$292 – Sellers – 1.4:1; -44.73% From Current Price Level
$288 – Buyers – 0.7:0*; -45.48% From Current Price Level
$284 – Sellers – 1.27:1; -46.24% From Current Price Level
$280 – NULL – 0:0*; -47% From Current Price Level
$276 – NULL – 0:0*; -47.75% From Current Price Level
Tying It All Together
The list & image above paint the picture as to how investors & traders have behaved at various price levels that LLY has been at over the past one-to-two years.
It is not meant to serve as investment/trading advice, and is simply a way to visualize what investor/trader sentiment has been like at each of the price levels mentioned, as well as what it was at levels of support & resistance that are denoted in the image & list.
As always, do your own due diligence before making investing/trading decisions.
For more on the methodology on how the data was collected & put together, please refer to our original Price:Volume analysis.
*** I DO NOT OWN SHARES OR OPTIONS CONTRACT POSITIONS IN LLY AT THE TIME OF PUBLISHING THIS ARTICLE ***