Akamai Technologies, Inc. stock trades under the ticker AKAM & has advanced +43.92% since their 52-week low in March of 2023.
After making a fresh new 52-week high last week & seeing their oscillators it is time to check in with how their volume has been at each price level that they’ve traded at in recent history (past 1-2 years).
Given the +8.47% gap up they experienced last week having limited support within the window (with exception to their 10 day moving average & a couple of other touch-points towards the lower end of the window), it becomes even more important to understand how market participants have viewed their valuation at various price levels, as there is otherwise unstable footing at their recent price levels.
The Price:Volume analysis below seeks to display the volume at specific share-price levels from over the past two-to-three years & is intended to serve as a reference point for how investors viewed AKAM stock’s value at each level.
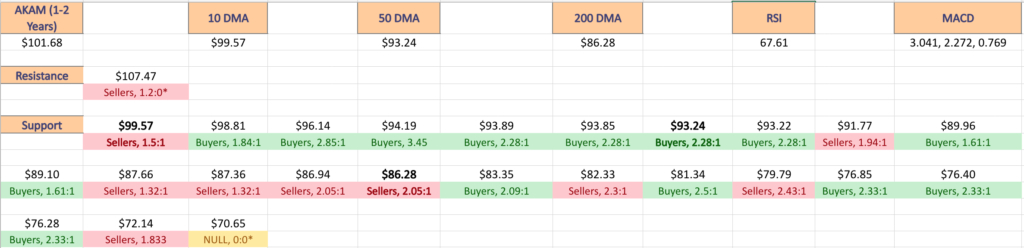
It also includes a list of moving averages, as well as support & resistance levels, which will be marked in bold.
Akamai Technologies, Inc. AKAM Stock’s Price:Volume Sentiment Broken Down
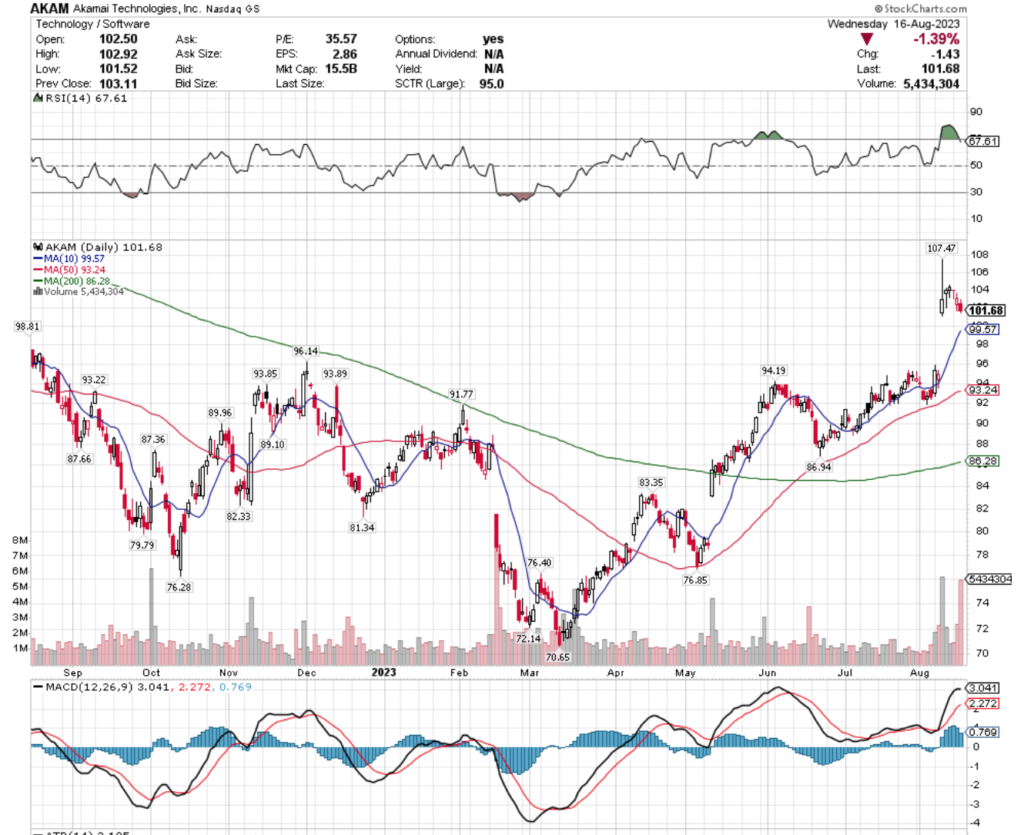
As noted above, their oscillators are signaling impending declines with their RSI just returning from overbought levels at 67.61 & their MACD is beginning to curl over into a bearish reversal.
Their trading volumes over the past week & a half have increased by +90.59% compared to the past year’s average volume as market participants were eager to get involved in the gap up & have remained eager to take profits off of the table (2,938,294.5 vs. 1,541,687.92), which is flashing signals of an impending reversal in sentiment/a continuation of the past few days’ declines.
AKAM’s 50 day moving average is lagging their 10 day moving average by -6.4% & will likely not be able to provide extra support within the window unless they establish a temporary consolidation range in the meantime, leaving them limited support in the window, especially given that their second highest support level of the past 52-weeks will become less relevant by the end of the week as it is nearing 52-weeks old.
Their range for the gap-up day was very wide, but the real body of the candlestick for that day is a fraction of said range, followed by two bullish spinning tops that have upper wicks just slightly higher above being hanging man candles, indicating investors were becoming uncertain about their price level.
The declines began this week, with a dragonfly doji on Monday, followed by a decline Tuesday that was pumped up to have a higher close than open & Wednesday’s session’s real body indicates further declines on the horizon.
With all of these factors in mind, it becomes even more apparent that having an understanding of their price:volume sentiment is essential in the coming weeks.
The bold prices on the image below denote the moving average levels just listed & the bold entries in the list form of the analysis under the images include other levels of support.
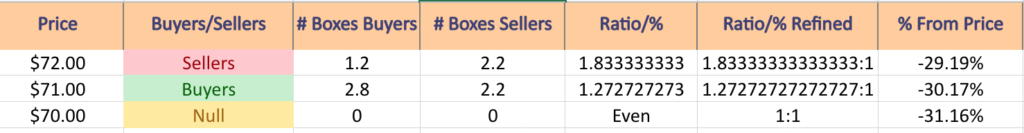
Each corresponding price level using a ratio of Buyers:Sellers (or Sellers:Buyers), NULL values denote that there was not enough data, so the ratio would’ve been 0:0.
Ratios with a 0 for the denominator/constant are denoted with an *, but are reported as is, as we are accounting for volume/sentiment.
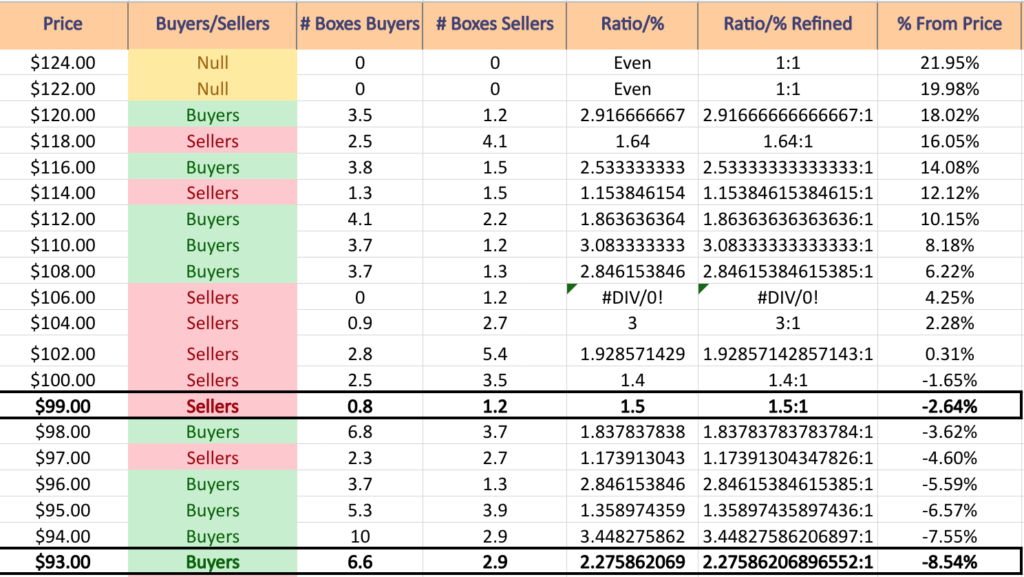
Akamai Technologies, Inc. AKAM Stock’s Volume By Price Level
$124 – NULL – 0:0*; +21.32% From Current Price Level
$122 – NULL – 0:0*; +19.36% From Current Price Level
$120 – Buyers – 2.92:1; +17.41% From Current Price Level
$118 – Sellers – 1.64:1; +15.45% From Current Price Level
$116 – Buyers – 2.53:1; +13.49% From Current Price Level
$114 – Sellers – 1.15:1; +11.54% From Current Price Level
$112 – Buyers – 1.86:1; +9.58% From Current Price Level
$110 – Buyers – 3.08:1; +7.62% From Current Price Level
$108 – Buyers – 2.85:1; +5.66% From Current Price Level
$106 – Sellers – 1.2:0*; +3.71% From Current Price Level
$104 – Sellers – 3:1; +1.75% From Current Price Level
$102 – Sellers – 1.93:1; -0.21% From Current Price Level
$100 – Sellers – 1.4:1; -2.16% From Current Price Level
$99 – Sellers – 1.5:1; -3.14% From Current Price Level
$98 – Buyers – 1.84:1; -4.12% From Current Price Level – 10 Day Moving Average
$97 – Sellers – 1.17:1; -5.1% From Current Price Level
$96 – Buyers – 2.85:1; -6.08% From Current Price Level
$95 – Buyers – 1.36:1; -7.05% From Current Price Level
$94 – Buyers – 3.45:1; -8.03% From Current Price Level
$93 – Buyers – 2.28:1; -9.01% From Current Price Level – 50 Day Moving Average
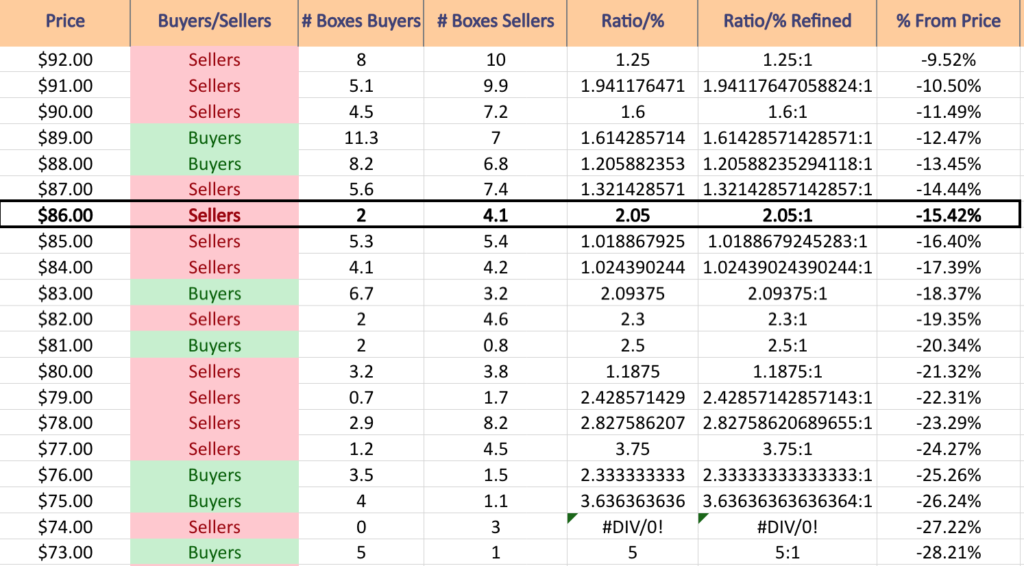
$92 – Sellers – 1.25:1; -9.99% From Current Price Level
$91 – Sellers – 1.94:1; -10.97% From Current Price Level
$90 – Sellers – 1.6:1; -11.95% From Current Price Level
$89 – Buyers – 1.61:1; -12.92% From Current Price Level
$88 – Buyers – 1.21:1; -13.9% From Current Price Level
$87 – Sellers – 1.32:1; -14.88% From Current Price Level
$86 – Sellers – 2.05:1; -15.86% From Current Price Level – 200 Day Moving Average
$85 – Sellers – 1.02:1; -16.84% From Current Price Level
$84 – Sellers – 1.02:1; -17.82% From Current Price Level
$83 – Buyers – 2.03:1; -18.79% From Current Price Level
$82 – Sellers – 2.3:1; -19.77% From Current Price Level
$81 – Buyers – 2.5:1; -20.75% From Current Price Level
$80 – Sellers – 1.19:1; -21.73% From Current Price Level
$79 – Sellers – 2.43:1; -22.71% From Current Price Level
$78 – Sellers – 2.83:1; -23.69% From Current Price Level
$77 – Sellers – 3.75:1; -24.66% From Current Price Level
$76 – Buyers – 2.33:1; -25.64% From Current Price Level
$75 – Buyers – 3.64:1; -26.62% From Current Price Level
$74 – Sellers – 3:0*; -27.6% From Current Price Level
$73 – Buyers – 5:1; -28.58% From Current Price Level
$72 – Sellers – 1.83:1; -29.56% From Current Price Level
$71 – Buyers – 1.27:1; -30.54% From Current Price Level
$70 – NULL – 0:0*
Tying It All Together
The list & image above paint the picture as to how investors & traders have behaved at various price levels that AKAM has been at over the past one-to-two years.
It is not meant to serve as investment/trading advice, and is simply a way to visualize what investor/trader sentiment has been like at each of the price levels mentioned, as well as what it was at levels of support & resistance that are denoted in the image & list.
As always, do your own due diligence before making investing/trading decisions.
For more on the methodology on how the data was collected & put together, please refer to our original Price:Volume analysis.
*** I DO NOT OWN SHARES OR OPTIONS CONTRACT POSITIONS IN AKAM AT THE TIME OF PUBLISHING THIS ARTICLE ***