Marriott International, Inc. stock trades under the ticker MAR & has had an excellent 2023, advancing +51.13% since their 52-week low in September of 2022.
They’ve declined -3.42% off of their 52-week high set in August of 2023, making it a great time to look at their current support levels & how strong investor sentiment was at each.
Given that there are only 2 support touch points between their current price & the next support zone, it will help market participants to understand how their price action moves in the coming days-to-weeks.
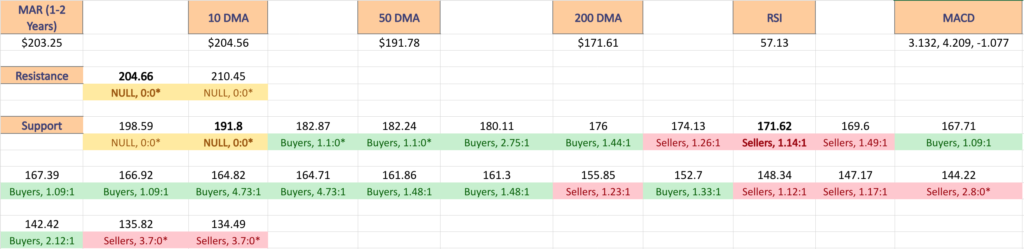
The Price:Volume analysis below seeks to display the volume at specific share-price levels from over the past one-to-two years & is intended to serve as a reference point for how investors viewed MAR stock’s value at each level.
It also includes a list of moving averages, as well as support & resistance levels, which will be marked in bold.
Marriott International, Inc. MAR Stock’s Price:Volume Sentiment Broken Down
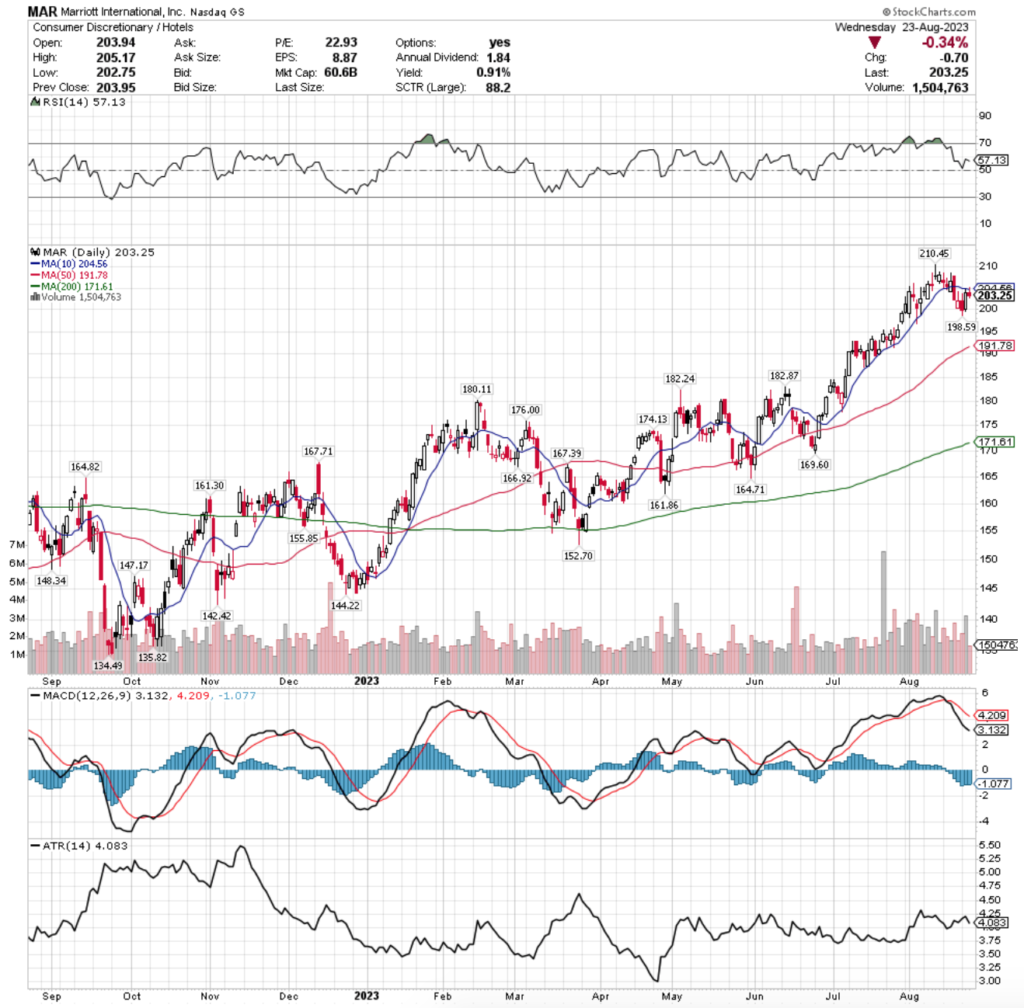
Their RSI is on the overbought end of neutral at 57.13, with a MACD signaling bearish decline following some profit taking after they hit their 52-week high a couple of weeks ago.
Their trading volume over the past week & a half has been +15.11% above average compared to the year prior (2,217,112.5 vs. 1,926,009.96), confirming that investors were eager to take profits after the rally that led to the top that began back in June.
Their ATR is just below its average & trending lower, implying that there are more declines to come in the near future.
This is important to recognize, as their next support levels are $198.59 (-2.29%) & $191.78 (50-Day Moving Average; -5.64%) before they reach a support zone ~10% below their current price.
By understanding how market participants behaved at each price level that MAR stock has traded at over the past 1-2 years, it is possible to gauge how they might behave in the face of additional near-term declines.
The following note outlines support/resistance levels from the past year, while also breaking down the ratio of buyers:sellers (or sellers:buyers) at each price level by percentage that they’ve traded at in the past 1-2 years.
The bold prices on the image below denote the moving average levels just listed & the bold entries in the list form of the analysis under the images include other levels of support.
Each corresponding price level using a ratio of Buyers:Sellers (or Sellers:Buyers), NULL values denote that there was not enough data, so the ratio would’ve been 0:0.
Ratios with a 0 for the denominator/constant are denoted with an *, but are reported as is, as we are accounting for volume/sentiment.
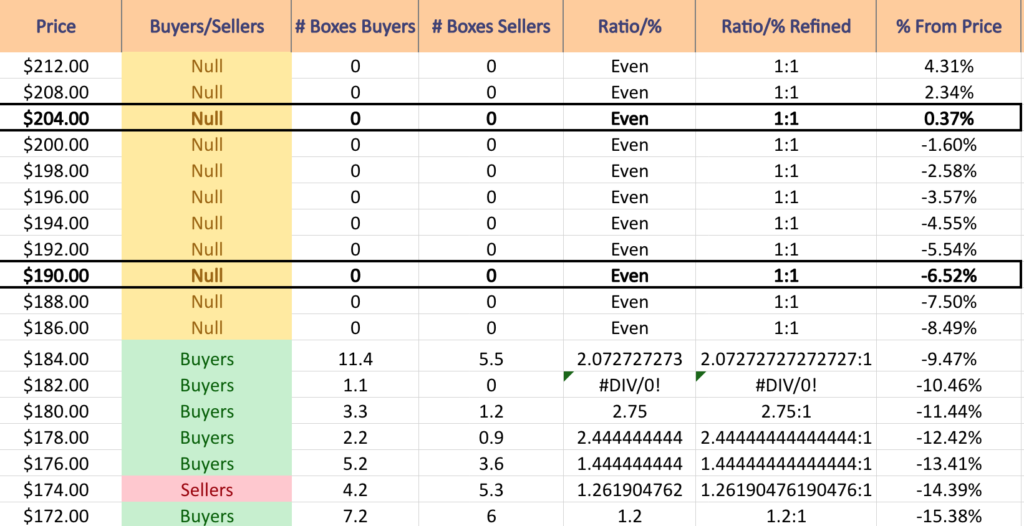
Marriott International, Inc. MAR Stock’s Volume By Price Level
$212 – NULL – 0:0*; +4.31% From Current Price Level
$208 – NULL – 0:0*; +2.34% From Current Price Level
$204 – NULL – 0:0*; +0.37% From Current Price Level – 10 Day Moving Average
$200 – NULL – 0:0*; -1.6% From Current Price Level
$198 – NULL – 0:0*; -2.58% From Current Price Level
$196 – NULL – 0:0*; -3.57% From Current Price Level
$194 – NULL – 0:0*; -4.55% From Current Price Level
$192 – NULL – 0:0*; -5.54% From Current Price Level
$190 – NULL – 0:0*; -6.52% From Current Price Level – 50 Day Moving Average
$188 – NULL – 0:0*; -7.5% From Current Price Level
$186 – NULL – 0:0*; -8.49% From Current Price Level
$184 – Buyers – 2.07:1; -9.47% From Current Price Level
$182 – Buyers – 1.1:0*; -10.46% From Current Price Level
$180 – Buyers – 2.75:1; -11.44% From Current Price Level
$178 – Buyers – 2.44:1; -12.42% From Current Price Level
$176 – Buyers – 1.44:1; -13.41% From Current Price Level
$174 – Sellers – 1.26:1; -14.39% From Current Price Level
$172 – Buyers – 1.2:1; -15.38% From Current Price Level
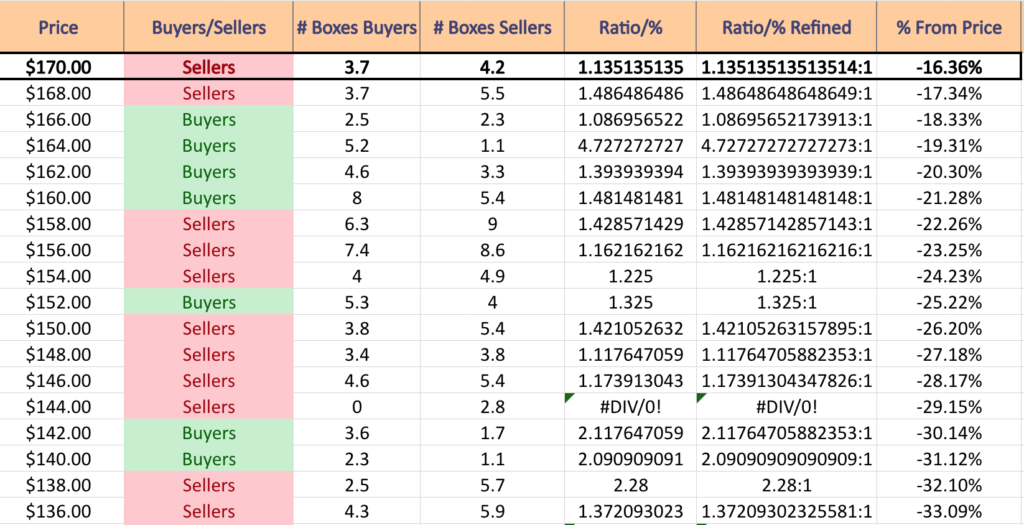
$170 – Sellers – 1.35:1; -16.36% From Current Price Level – 200 Day Moving Average
$168 – Sellers – 1.49:1; -17.34% From Current Price Level
$166 – Buyers – 1.09:1; -18.33% From Current Price Level
$164 – Buyers – 4.73:1; -19.31% From Current Price Level
$162 – Buyers – 1.39:1; -20.3% From Current Price Level
$160 – Buyers – 1.48:1; -21.28% From Current Price Level
$158 – Sellers – 1.43:1; -22.26% From Current Price Level
$156 – Sellers – 1.16:1; -23.25% From Current Price Level
$154 – Sellers – 1.23:1; -24.23% From Current Price Level
$152 – Buyers – 1.33:1; -25.22% From Current Price Level
$150 – Sellers – 1.42:1; -26.2% From Current Price Level
$148 – Sellers – 1.12:1; -27.18% From Current Price Level
$146 – Sellers – 1.17:1; -28.17% From Current Price Level
$144 – Sellers – 2.8:0*; -29.15% From Current Price Level
$142 – Buyers – 2.12:1; -30.14% From Current Price Level
$140 – Buyers – 2.09:1; -31.12% From Current Price Level
$138 – Sellers – 2.28:1; -32.1% From Current Price Level
$136 – Sellers – 1.37:1; -33.09% From Current Price Level
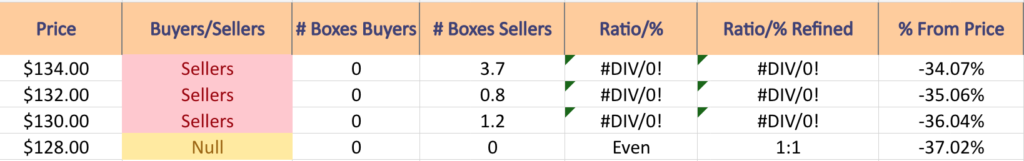
$134 – Sellers – 3.7:0*; -34.07% From Current Price Level
$132 – Sellers – 0.8:0*; -35.06% From Current Price Level
$130 – Sellers – 1.2:0*; -36.04% From Current Price Level
$128 – NULL – 0:0*; -37.02% From Current Price Level
Tying It All Together
The list & image above paint the picture as to how investors & traders have behaved at various price levels that MAR has been at over the past one-to-two years.
It is not meant to serve as investment/trading advice, and is simply a way to visualize what investor/trader sentiment has been like at each of the price levels mentioned, as well as what it was at levels of support & resistance that are denoted in the image & list.
As always, do your own due diligence before making investing/trading decisions.
For more on the methodology on how the data was collected & put together, please refer to our original Price:Volume analysis.
*** I DO NOT OWN SHARES OR OPTIONS CONTRACT POSITIONS IN MAR AT THE TIME OF PUBLISHING THIS ARTICLE ***