SPY, the SPDR S&P 500 ETF advanced +0.14% this past week, faring the best of the major indexes.
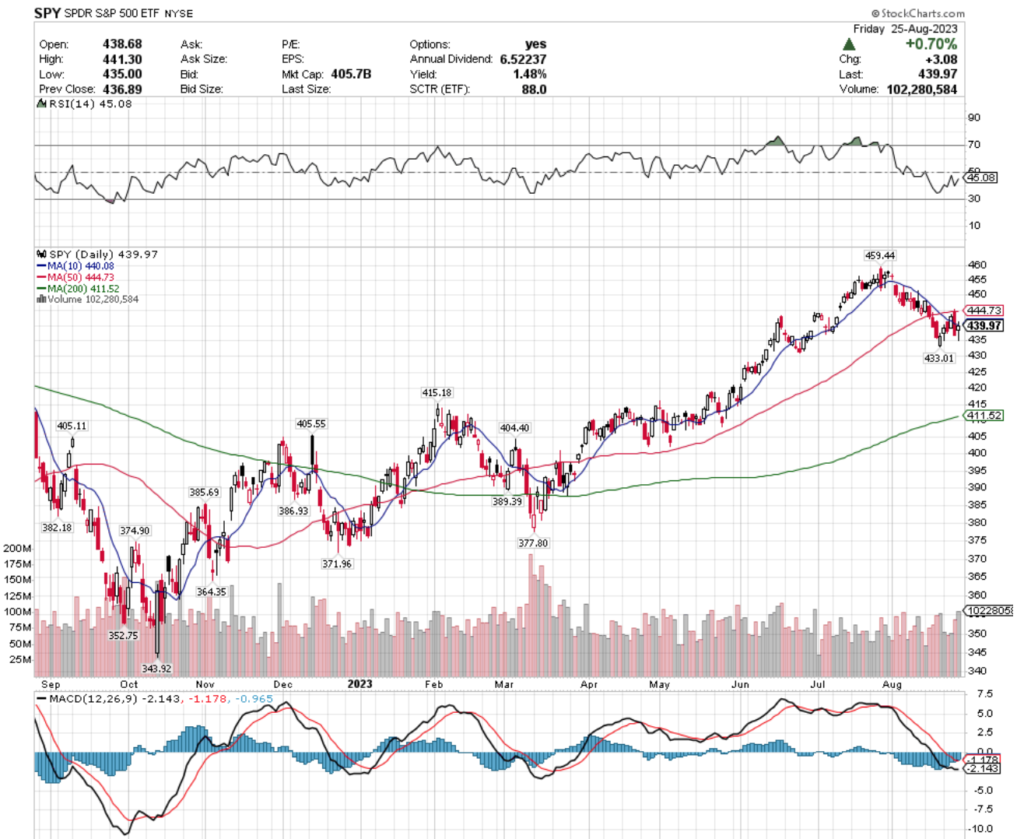
Their RSI is trying to trend back to neutral & sits on the oversold end of neutral at 45.08, with a bearish MACD that is trying to curl up bullishly.
Volumes were -7.6% below the average for the year prior (78,304,857 vs. 84,743,675) signaling indecision among market participants, but the candlesticks tell a different story.
The week began & ended on spinning top candles, but Thursday’s bearish engulfing candlestick painted the picture that this week & next will likely see some cooling off in SPY’s share price.
The appearance of a bearish head & shoulders pattern is something to be watching out for from a technical perspective.
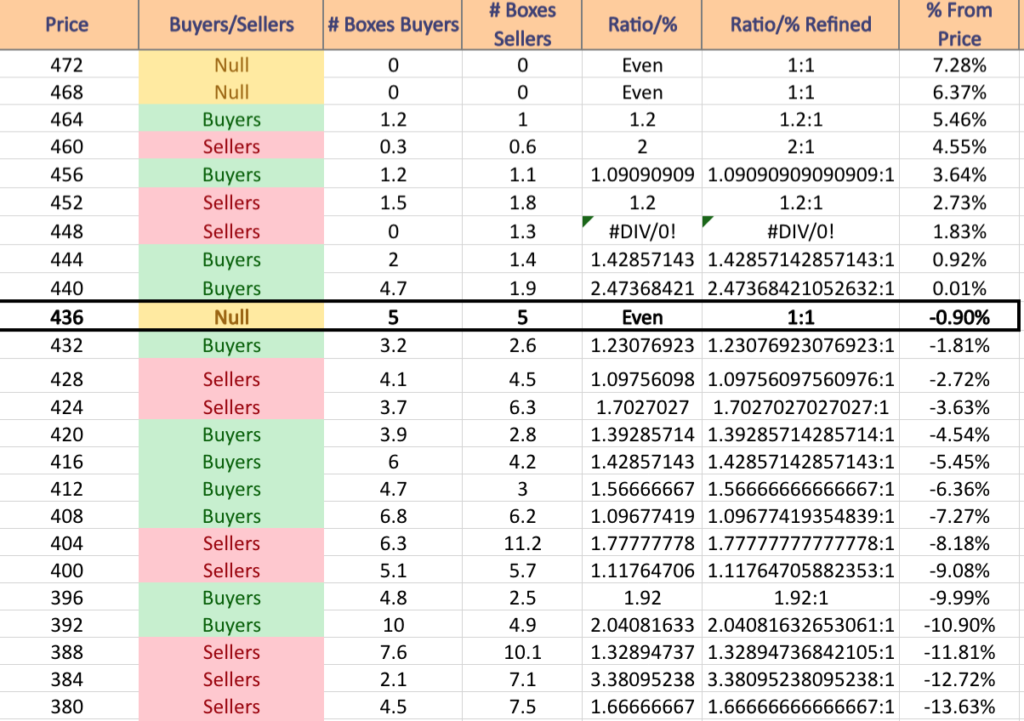
SPY has support at the $433.01 (Volume Sentiment: Buyers, 1.23:1), $415.18 (Volume Sentiment: Buyers, 1.57:1), $411.52 (200 Day Moving Average; Volume Sentiment: Buyers, 1.10:1) & $405.55/share (Volume Sentiment: Sellers, 1.78:1) price levels, with resistance at the $440.08 (Volume Sentiment: Buyers, 2.47:1), $444.73 (Volume Sentiment: Buyers, 1.43:1) & $459.44/share (Volume Sentiment: Buyers, 1.09:1) price levels.
QQQ, the Invesco QQQ Trust ETF nudged forward +0.03% this past week, faring second best out of the major indexes.
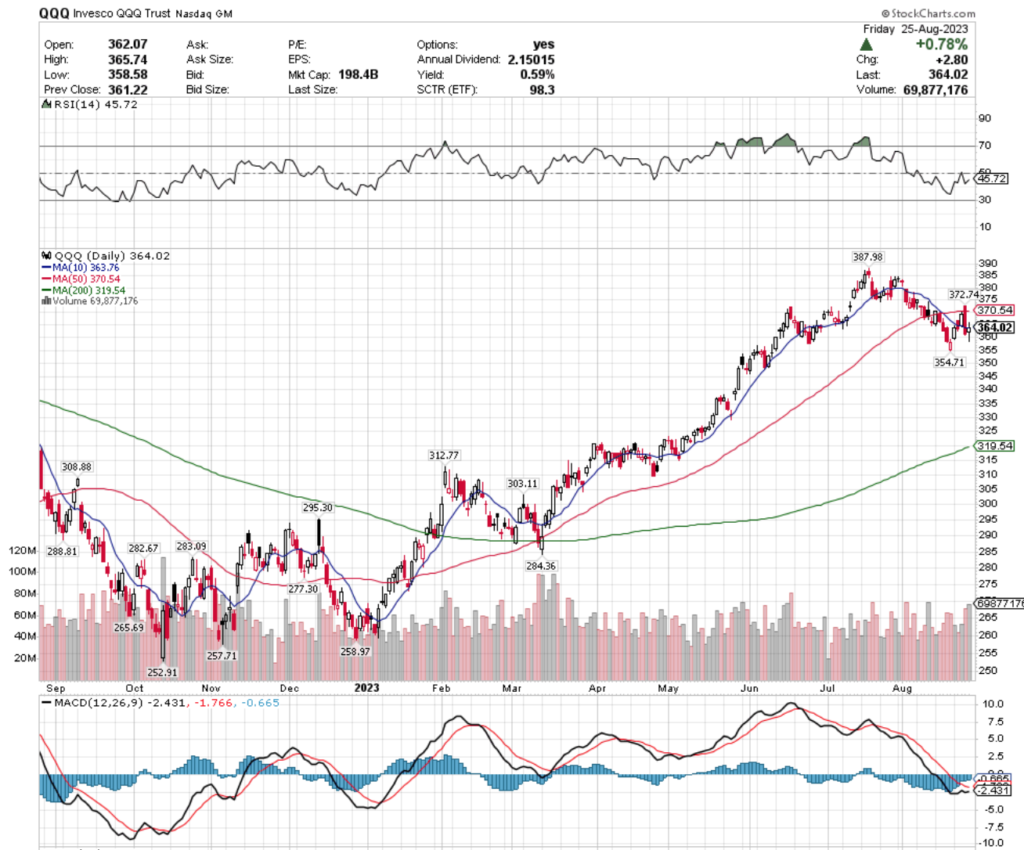
Their RSI is trending back towards neutral, but sits on the oversold end at 45.72, with a MACD that is trying to cross over bullishly in the coming days.
Volumes were +1.22% above average compared to the year prior (56,710,367 vs. 56,026,726), which is not particularly noteworthy.
However, Thursday’s bearish engulfing candle & Friday’s spinning top signal that there is hesitancy on the part of market participants & is signaling more near-term declines on the horizon.
QQQ is also beginning to show signs of developing a bearish head & shoulders pattern in the coming week or two, which is something to keep an eye on.
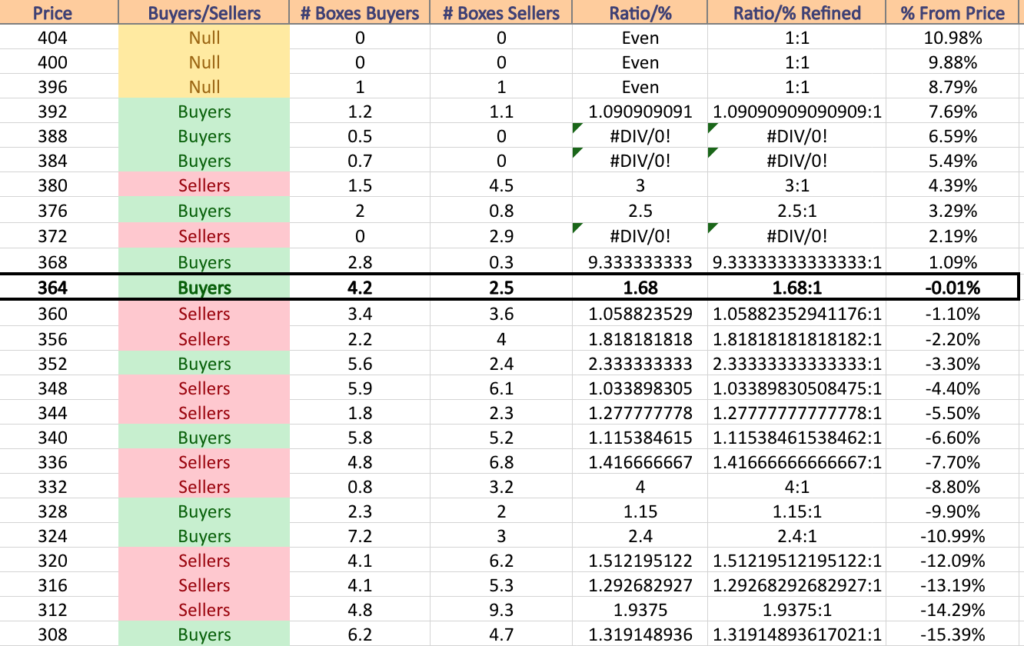
QQQ has support at the $363.76 (10 Day Moving Average; Volume Sentiment: Sellers, 1.06:1), $354.71 (Volume Sentiment: Buyers, 2.33:1), $319.54 (200 Day Moving Average; Volume Sentiment: Sellers, 1.29:1) & $312.77/share (Volume Sentiment: Sellers, 1.94:1) price levels, with resistance overhead at the $370.54 (50 Day Moving Average; Volume Sentiment: Buyers, 9.33:1), $372.74 (Volume Sentiment: Sellers, 2.9:0*) & $387.98/share (Volume Sentiment: Buyers, 0.7:0*) price levels.
IWM, the iShares Russell 2000 ETF declined -0.21% this past week, faring worse than the S&P 500 & NASDAQ, but outperforming their larger cap peers of the DJIA.
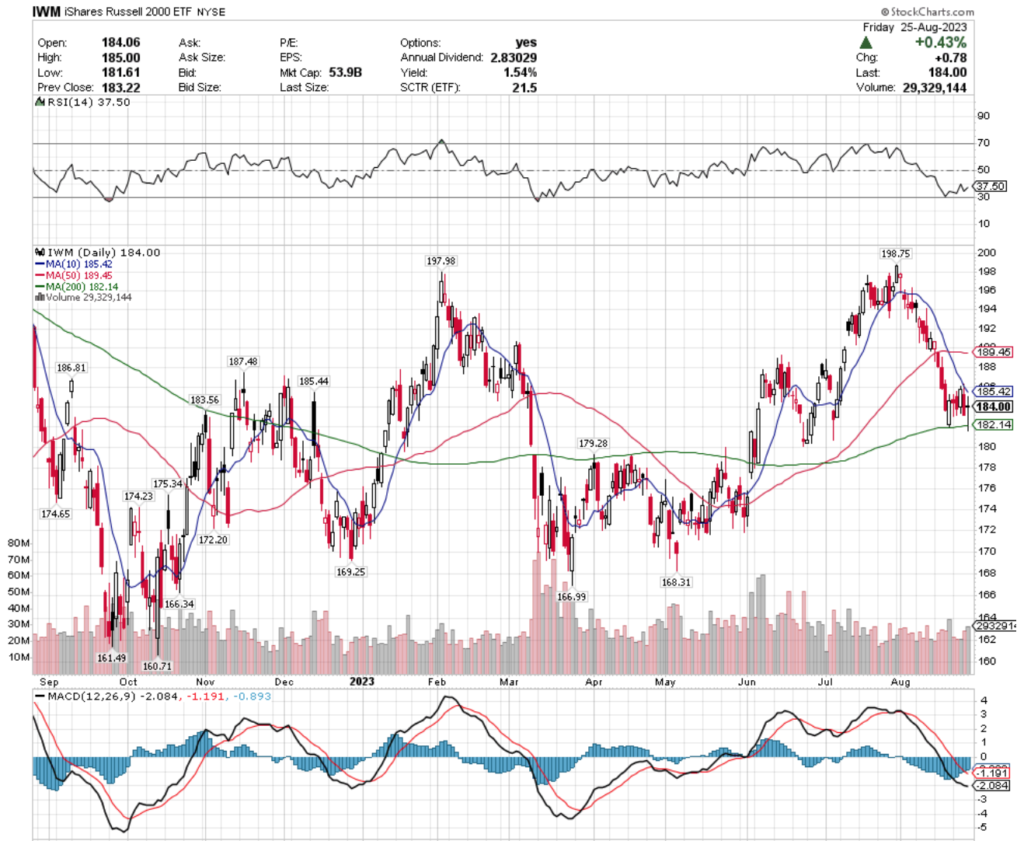
Their RSI is trying to trend back towards neutral, but sits currently at 37.5 with a bearish MACD that is attempting to smoothen out & cross over bullishly.
Volumes were -14.04% below average compared to the year prior (24,227,429 vs. 28,184,020) as investors were not feeling particularly up for taking risks in the week’s trading range.
Monday’s spinning top set the stage for uncertainty, while the week closed Friday with a dragonfly doji that temporarily broke below their 200 day moving average during the day’s session, indicating another leg lower may be on the horizon.
The downwards pressure of the 10 day moving average looks primed to force a harder test of the 200 DMA as support in the near-term, which may see us finding a third index with a bearish head & shoulders pattern in the coming weeks.
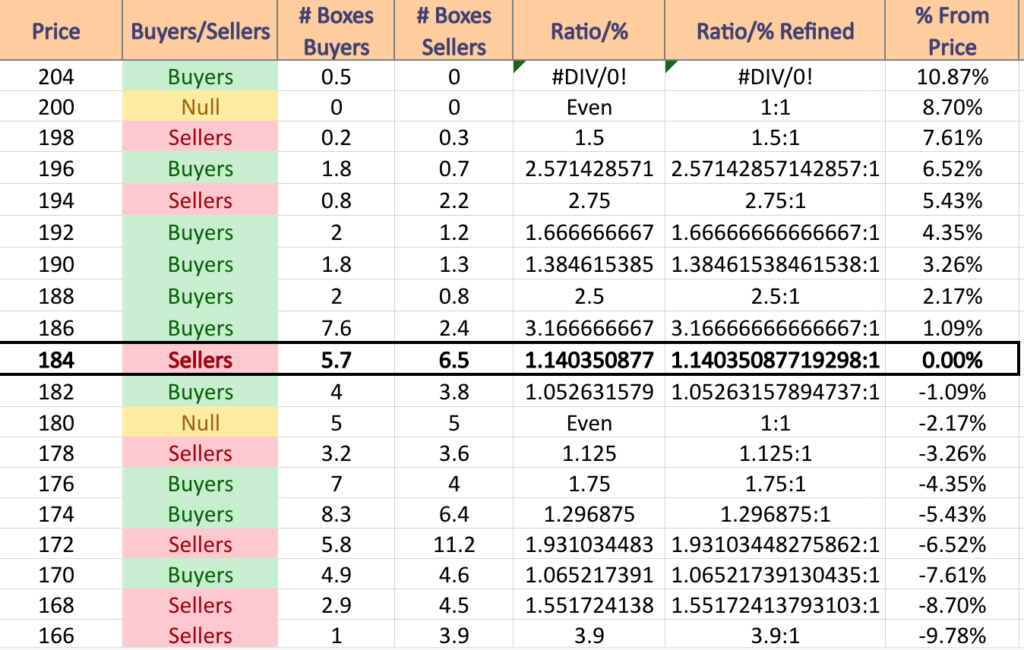
IWM has support at the $183.56 (Volume Sentiment: Buyers, 1.05:1), $182.14 (200 Day Moving Average; Volume Sentiment: Buyers, 1.05:1), $179.28 (Volume Sentiment: Sellers, 1.13:1) & $175.34/share (Volume Sentiment: Buyers, 1.30:1) price levels, with resistance at the $185.42 (10 Day Moving Average; Volume Sentiment: Sellers, 1.14:1) $185.44 (Volume Sentiment: Sellers, 1.14:1), $186.81 (Volume Sentiment: Buyers, 3.17:1) & $187.48/share (Volume Sentiment: Buyers, 3.17:1) price levels.
DIA, the SPDR Dow Jones Industrial Average ETF fell -0.34% this past week, as the larger cap stocks in this index fell the most out of favor in the market & many investors were eager to take profits & risk off of the table.
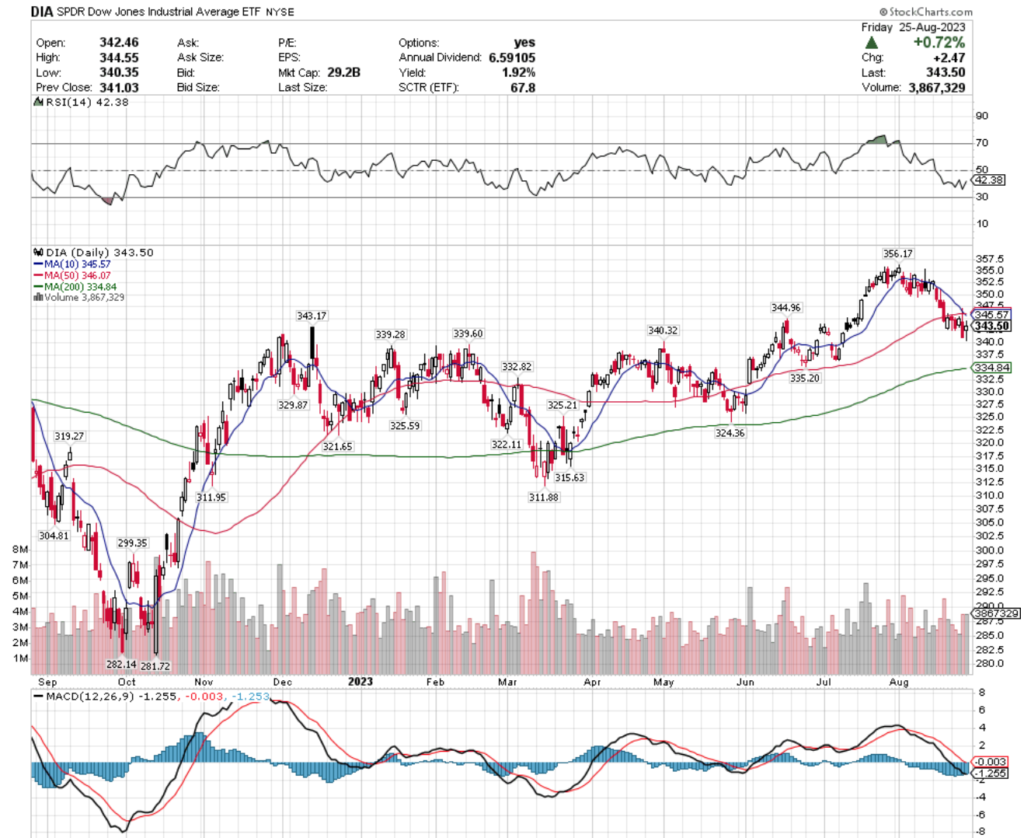
Their RSI is trending back towards neutral & sits at 42.38 currently, but their MACD is still bearish.
Volumes were -10.98% below average compared to the year prior (3,261,314 vs. 3,663,626) as there had already been signs of profit taking in the weeks leading up to last week.
Monday kicked the week off with a hanging man candlestick, which is not a good sign & the index continued lower into the rest of the week, closing out on Friday with an indecisive spinning top candle following Thursday’s thwarted attempt to break out beyond the 10 & 50 day moving averages serving currently as resistance.
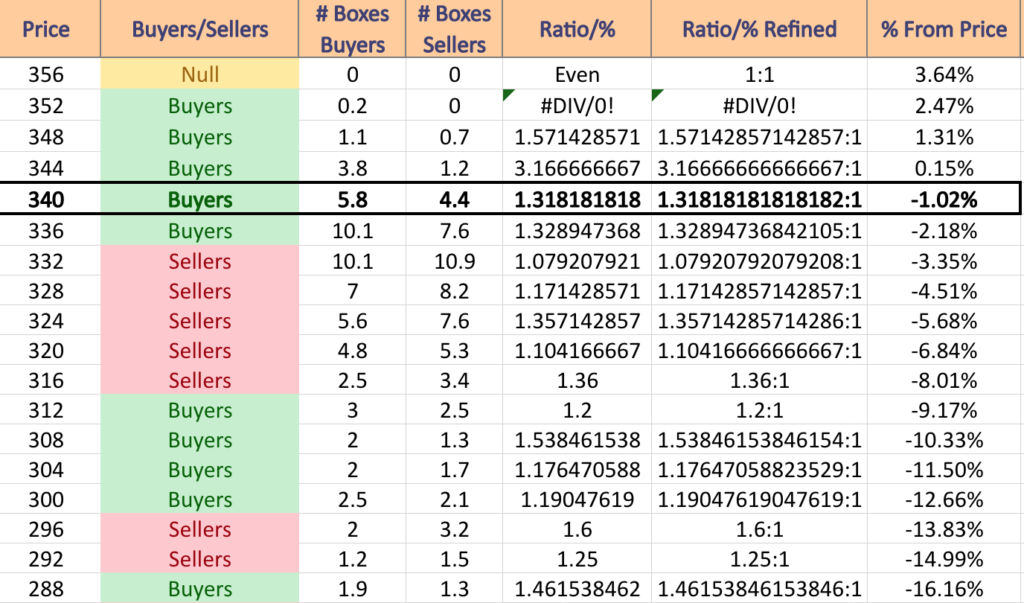
DIA has support at the $343.17 (Volume Sentiment: Buyers, 1.32:1), $340.32 (Volume Sentiment: Buyers, 1.32:1), $339.60 (Volume Sentiment: Buyers, 1.33:1) & $339.28/share (Volume Sentiment: Buyers, 1.33:1) price levels, with resistance at the $344.96 (Volume Sentiment: Buyers, 3.17:1), $345.57 (Volume Sentiment: Buyers, 3.17:1), $346.07 (Volume Sentiment: Buyers, 3.17:1) & $356.17/share (Volume Sentiment: NULL, 0:0*) price levels.
Dynamic Oil & Gas Services (PXJ), Homebuilders (XHB), Natural Gas (FCG) & Japan Hedged Equity (DBJP) Are All Bullishly Leading The Market
PXJ, the Invesco Dynamic Oil & Gas Services ETF has climbed +35.99% over the past year, including a +65.04% improvement from their 52-week low in September of 2022 (ex-distributions).
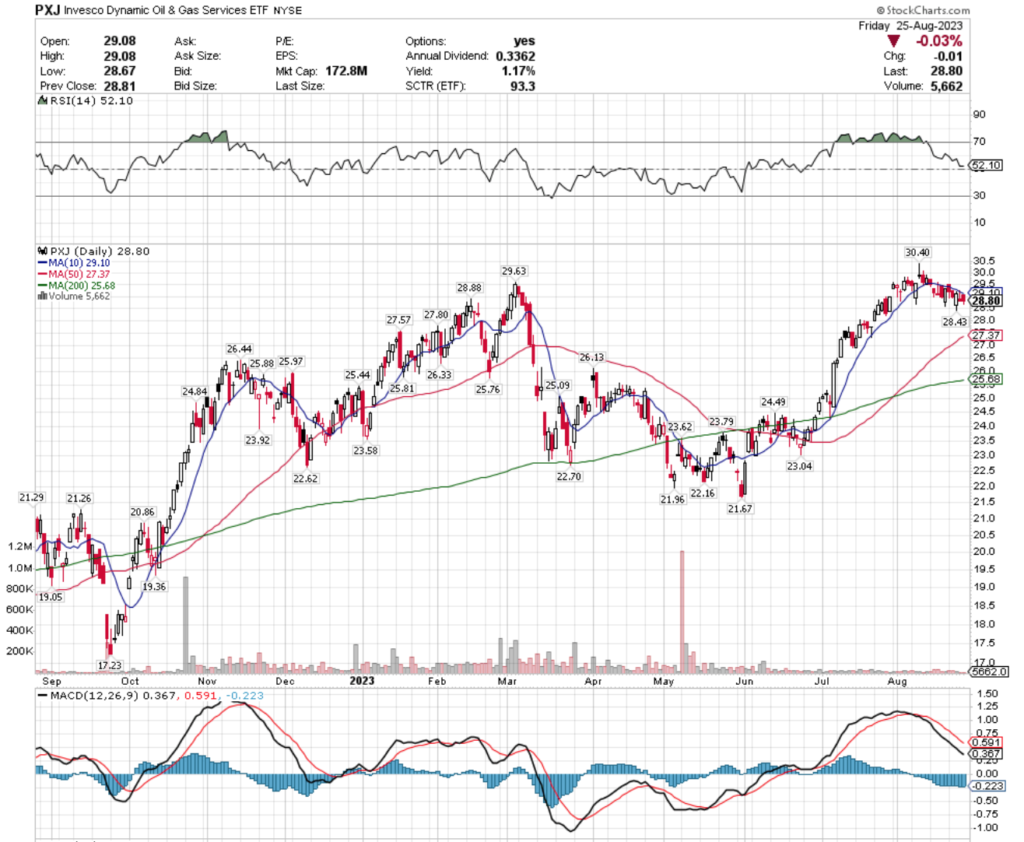
Their MACD is bearish, with a neutral reading on their RSI at 52.1.
Last week’s volume was extremely light, -80.25% compared to the year prior’s average (13,511.6 vs. 68,428.64), as investors took a wait & see approach after the week prior’s profit taking from their recent 52-week high.
Their moving averages are going to be a key area to watch in the coming weeks, as their 10 DMA is adding downward pressure against their price & the 50 DMA will need to serve as a support level soon.
While they offer a 1.17% distribution yield, that is not much downside protection & investors should begin to think of hedging options in the event that the move to the downside continues, such as selling calls or buying puts.
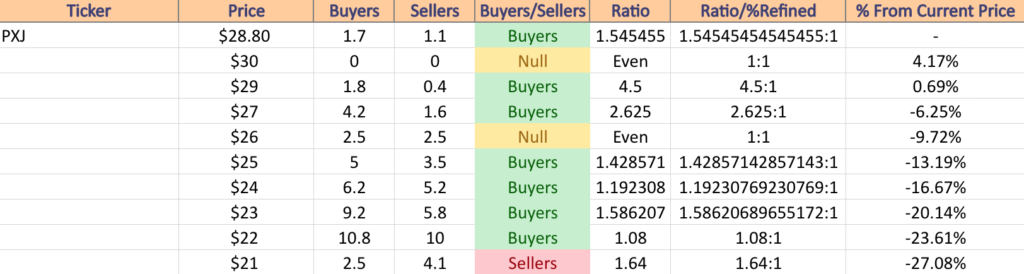
PXJ has support at the $28.43 (Volume Sentiment: Buyers, 1.55:1), $27.80 (Volume Sentiment: Buyers, 2.63:1), $27.57 (Volume Sentiment: Buyers, 2.63:1) & $27.37/share (50 Day Moving Average; Volume Sentiment: Buyers, 2.63:1), with resistance at the $28.88 (Volume Sentiment: Buyers, 1.55:1), $29.10 (10 Day Moving Average; Volume Sentiment: Buyers, 4.5:1), $29.63 (Volume Sentiment: Buyers, 4.5:1) & $30.40/share (52-Week High; Volume Sentiment: NULL, 0:0*) price levels.
XHB, the SPDR S&P Homebuilders ETF has advanced +24.59% over the past year, climbing +49.71% since their 52-week low in October of 2022 (ex-distributions).
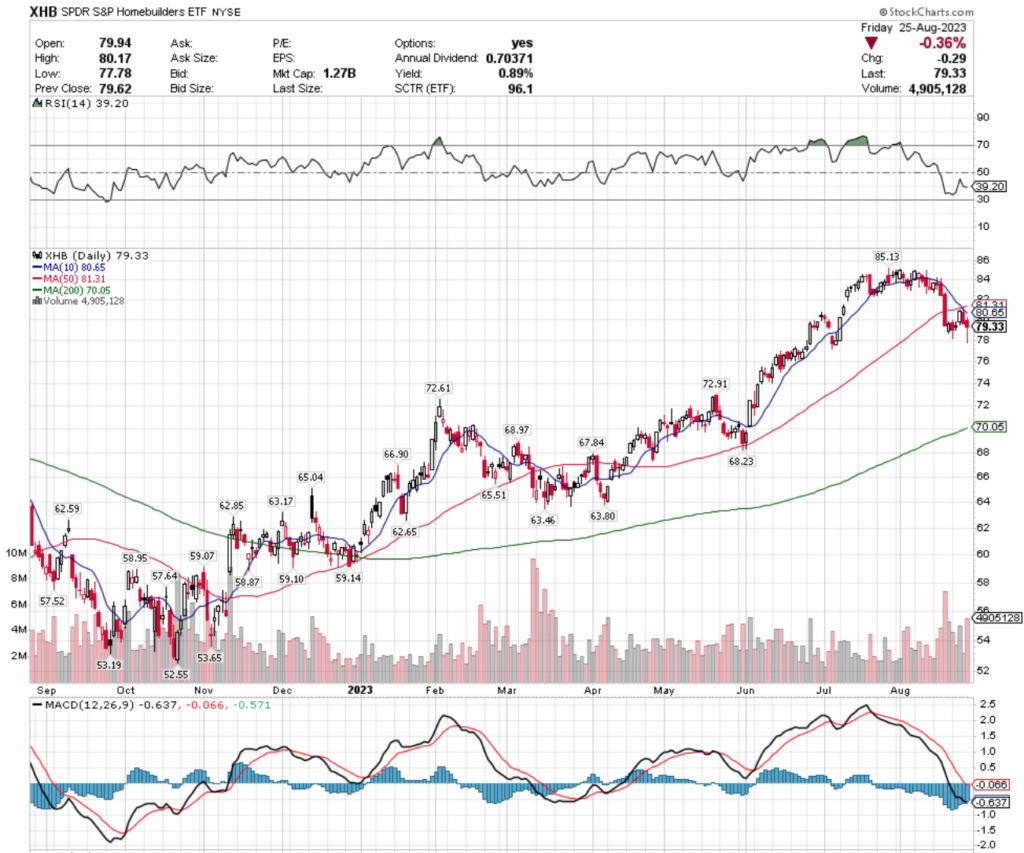
Their RSI is trending towards oversold & currently sits at 39.2, with a bearish MACD.
Volumes jumped +16.78% this past week compared to the year prior’s average volume (3,666,170.4 vs. 3,139,319.25), but were not as severe as the prior week’s volumes when investors were taking profits from their recent 52-week high’s consolidation range.
Tuesday’s candlestick was a spinning top which signals indecision by investors & the week ended on an interesting note, as prices opened & closed near the highs of the day’s session, but did retreat below the $78 level for part of the day, which indicates that they may test that level again in the near-term.
It would be wise to look into a hedging strategy, such as selling calls or buying puts in the near-term, as their 0.89% distribution yield does not provide much protection against losses.
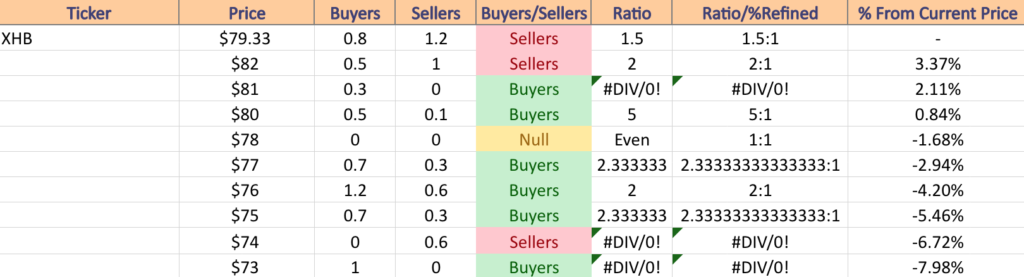
XHB has support at the $72.91 (Volume Sentiment: Buyers, 0.8:0*), $72.61 (Volume Sentiment: Buyers, 0.8:0*), $70.05 (200 Day Moving Average; Volume Sentiment: Buyers, 1.23:1) & $68.97/share (Volume Sentiment: Sellers, 2.05:1) price levels, with resistance at the $80.65 (10 Day Moving Average; Volume Sentiment: Buyers, 5:1), $81.31 (50 Day Moving Average; Volume Sentiment: Buyers, 0.3:0*) & $85.13/share (52-Week High; Volume Sentiment: Buyers, 0.2:0*) price levels.
FCG, the First Trust Natural Gas ETF has dipped -2.05% over the past year, rising +26.97% from their 52-week low in March of 2023 (ex-distributions).
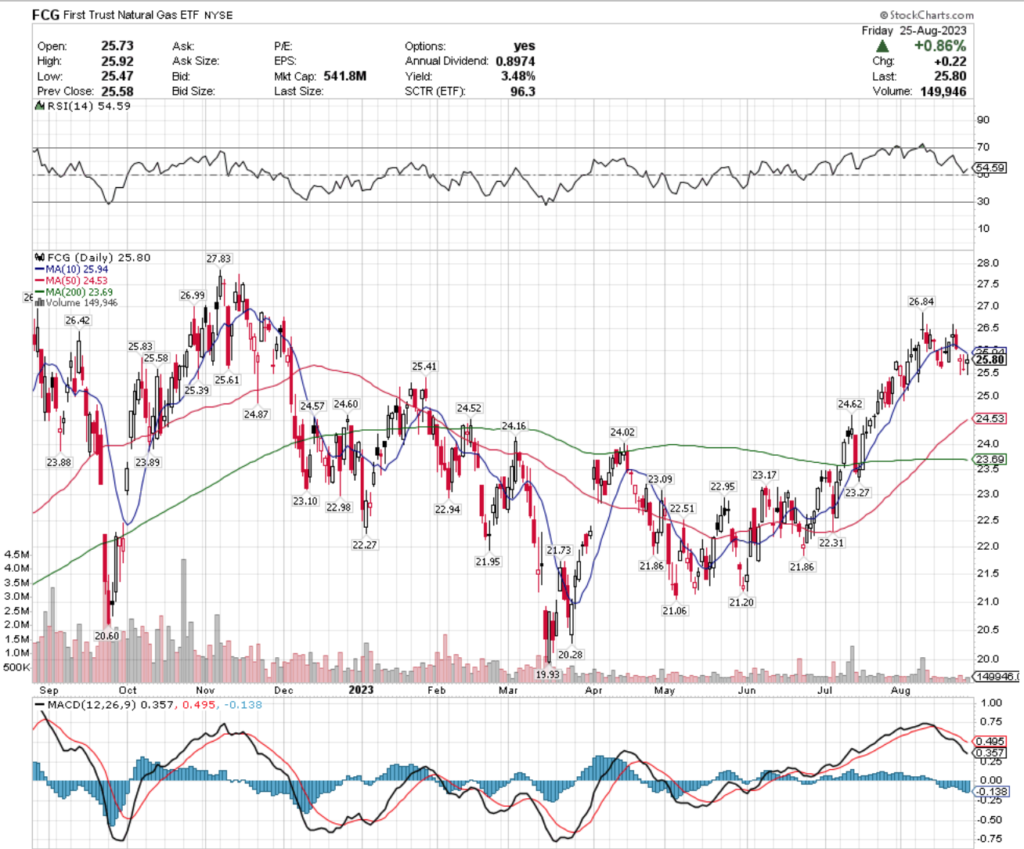
Their RSI is neutral at 54.59, but their MACD is bearish.
This past week’s volumes were -75.81% below average compared to the year prior (166,388.6 vs. 687,916.44) as investors took a breather to let the market sort out where FCG is currently valued.
Last week began on a spinning top, before a gap down on Wednesday that closed in a spinning top as there is still much uncertainty about their current value.
Thursday’s session closed in a gravestone doji which signals further declines are on the horizon & Friday’s spinning top’s high price was unable to penetrate the resistance of their 10-day moving average.
This makes it important to be looking for a near-term hedging strategy for any existing positions, as there are other signals of an impending decline on their chart.
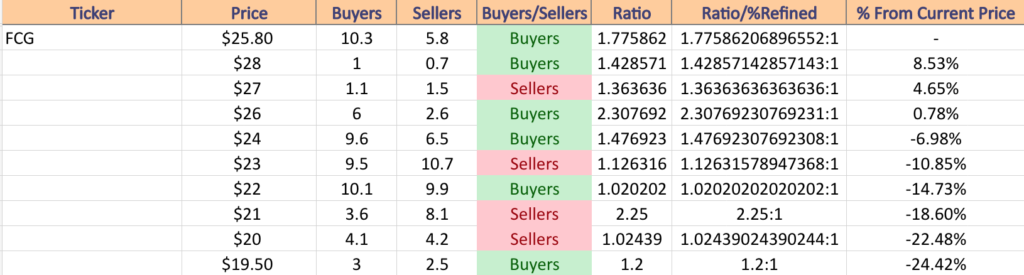
FCG has support at the $25.61 (Volume Sentiment: Buyers, 1.78:1), $25.58 (Volume Sentiment: Buyers, 1.78:1), $25.41 (Volume Sentiment: Buyers, 1.78:1) & $25.39/share (Volume Sentiment Buyers, 1.78:1) price levels, with resistance at the $25.83 (Volume Sentiment: Buyers, 1.78:1), $25.94 (10 Day Moving Average; Volume Sentiment: Buyers, 1.78:1), $26.42 (Volume Sentiment: Buyers, 2.31:1) & $26.84/share (Volume Sentiment: Buyers, 2.31:1) price levels.
DBJP, the Deutsche X-trackers MSCI Japan Hedged Equity ETF has gained +21.83% over the past year, climbing +24.7% from their 52-week low in October of 2023 (ex-distributions).
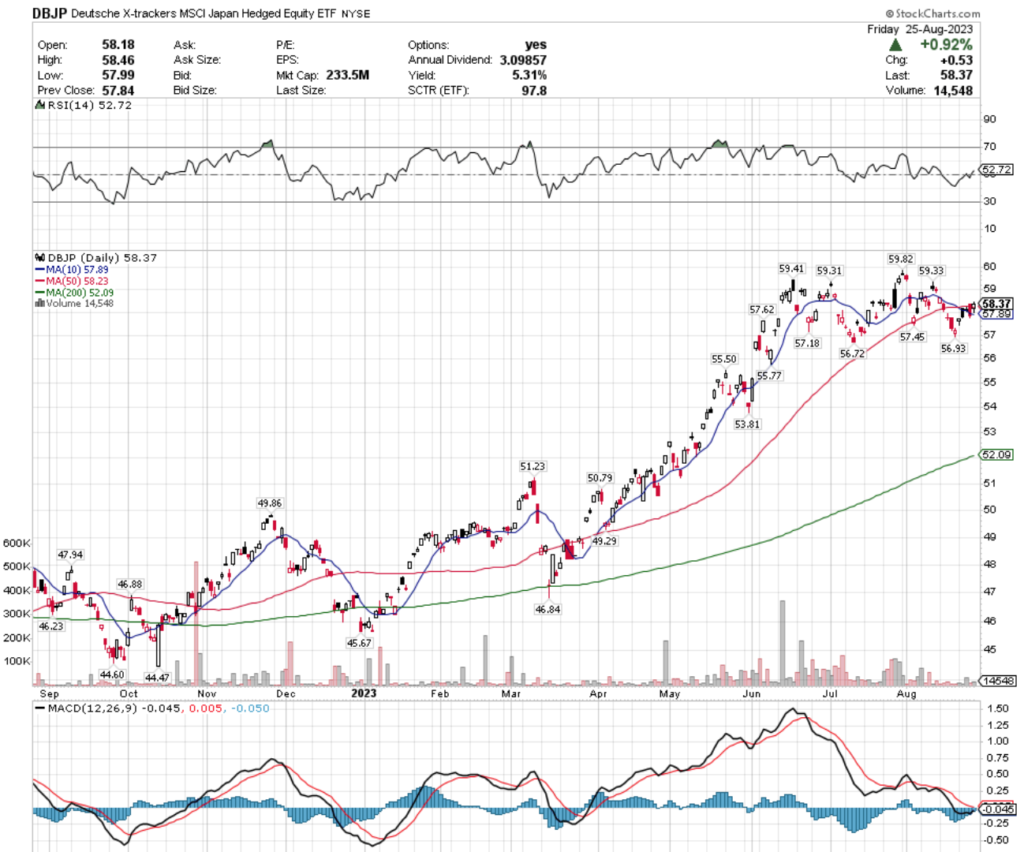
Their RSI is currently neutral at 52.72 & their MACD is set to cross over bullishly in the coming days after they posted a positive week last week.
Volumes were down -48.76% this past week compared to the year prior (15,220.2 vs. 29,703.97) which casts a shadow of doubt on their performance last week, particular as Monday’s session kicked off with a gap up hanging man & Friday’s session ended in a spinning top.
Wednesday’s doji confirms additionally that there is still a lot to be uncertain about on the part of investors for DBJP.
Their 5.31% distribution yield for long-term holders is a decent amount of cushion against losses, but it would be wise to be vigilant & think about hedging options while waiting to see how they behave at their 10 & 50 day moving averages.
Their 10 DMA is currently below the price, but its angle does not look primed to provide much in the way of support, and the 50 DMA is acting as resistance.
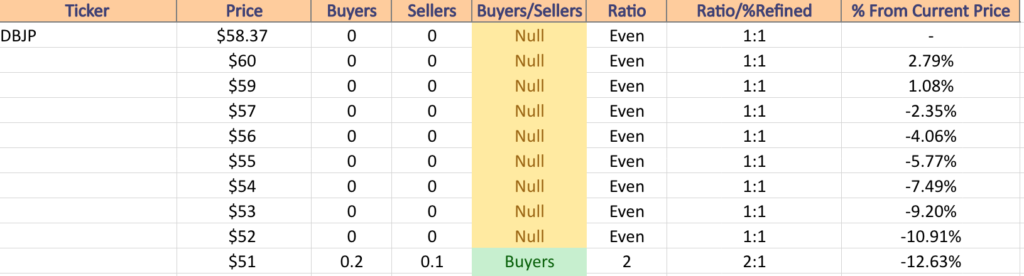
DBJP has support at the $58.23 (50 Day Moving Average; Volume Sentiment: NULL, 0:0*), $57.89 (10 Day Moving Average; Volume Sentiment: NULL, 0:0*), $57.62 (Volume Sentiment: NULL, 0:0*) & $57.45/share (Volume Sentiment: NULL, 0:0*) price levels, with resistance at the $59.31 (Volume Sentiment: NULL, 0:0*), $59.33 (Volume Sentiment: NULL, 0:0*), $59.41 (Volume Sentiment: NULL, 0:0*) & $59.82/share (Volume Sentiment: NULL, 0:0*) price levels.
Real Estate (DRN), Hong Kong (EWH), Space (UFO) & Community Banks (QABA) Are All Bearishly Lagging The Market
DRN, the Direxion Daily Real Estate Bull 3x ETF has fallen -51.12% over the past year, losing -52.51% since their 52-week high in August of 2022, but regaining +14.85% since their 52-week low in October of 2022 (ex-distributions).
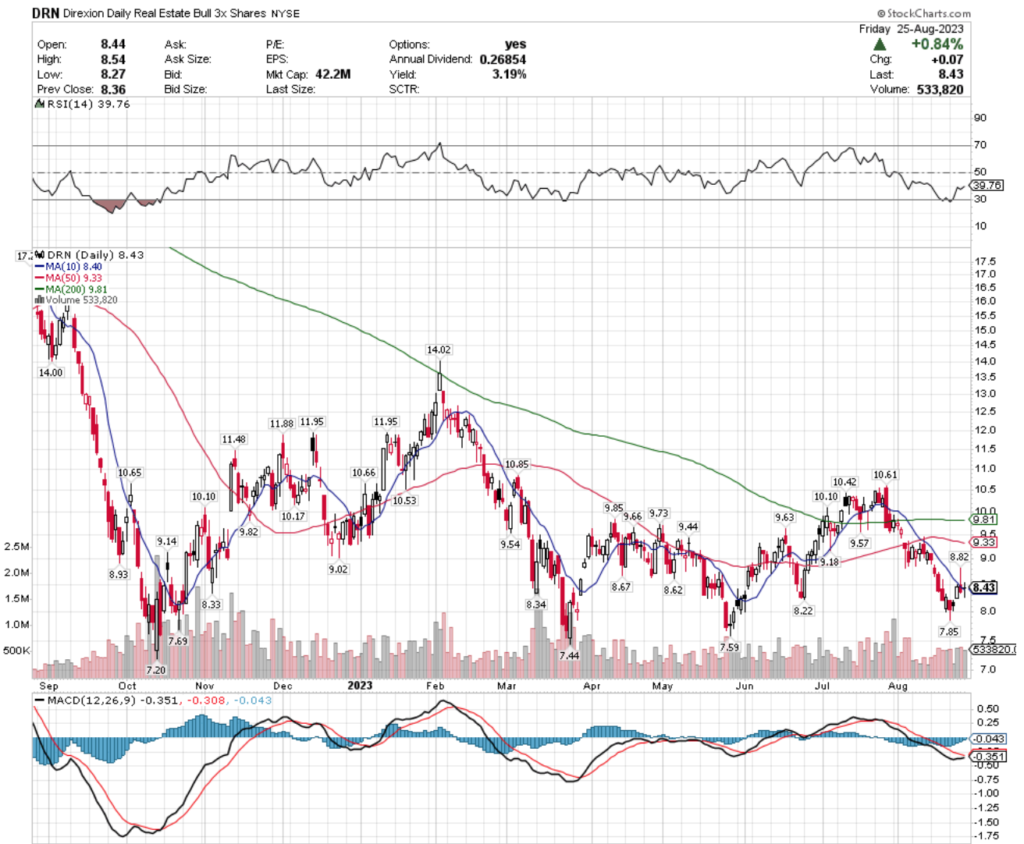
Their RSI is currently trending back towards neutral after being oversold & sits at 39.76 & their MACD is primed to cross over bullishly in the coming days.
Last weeks trading volume was -13.58% below the past year’s average volume (500,369.2 vs. 578,975.18) which does little along the lines of confirming their rise in price.
Monday’s hammer candlestick paved the way for their short advance during the week, however Friday’s doji is not a sign of confidence among market participants for the near-term.
While they offer a 3.19% distribution yield, it would be smart to begin exploring what hedging options are available for the coming weeks.
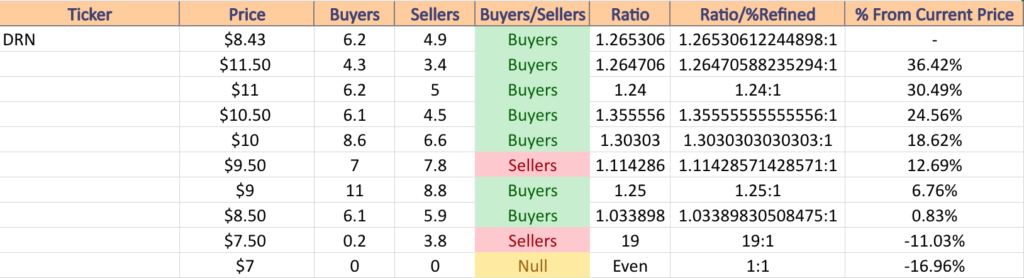
DRN has support at the $8.40 (10 Day Moving Average; Volume Sentiment: Buyers, 1.27:1), $8.34 (Volume Sentiment: Buyers, 1.27:1), $8.33 (Volume Sentiment: Buyers, 1.27:1) & $8.22/share (Volume Sentiment: Buyers, 1.27:1) price levels, with resistance at the $8.62 (Volume Sentiment: Buyers, 1.03:1), $8.67 (Volume Sentiment: Buyers, 1.03:1), $8.82 (Volume Sentiment: Buyers, 1.03:1) & $8.93/share (Volume Sentiment: Buyers, 1.03:1) price levels.
EWH, the iShares MSCI Hong Kong ETF has lost -13.29% over the past year, dropping -22.25% since their 52-week high in August of 2022, but reclaiming 9.79% since their 52-week low in October of 2022 (ex-distributions).
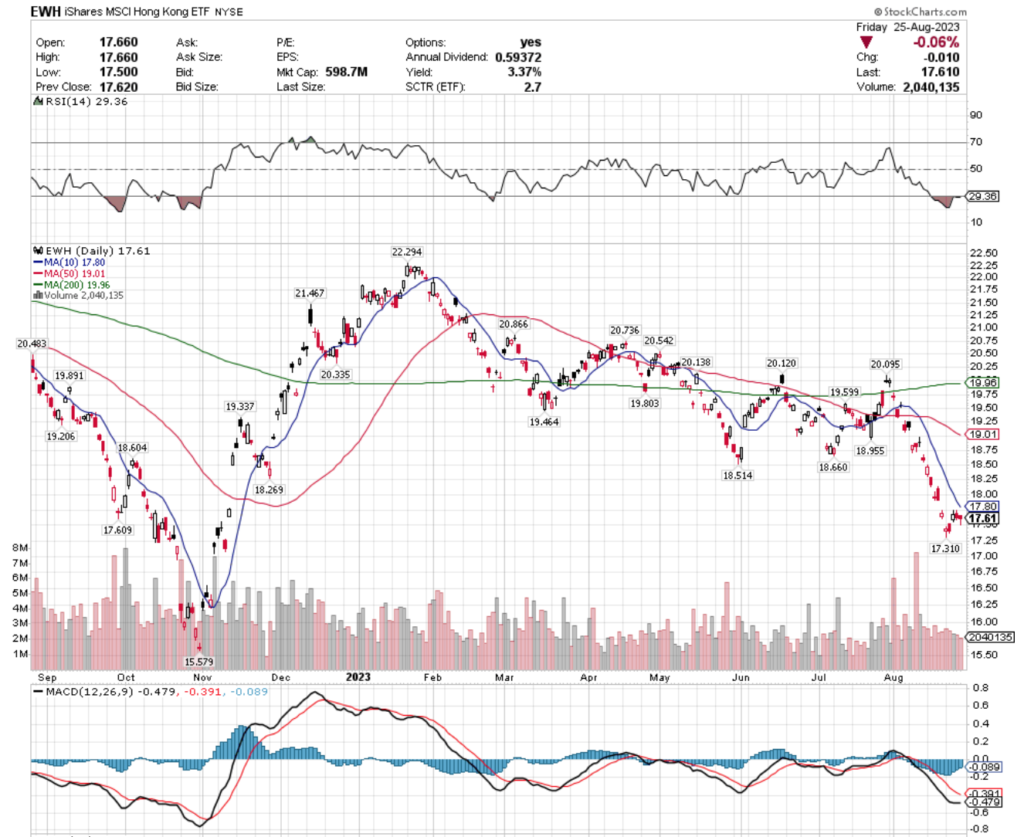
Their RSI is in oversold territory at 29.36 with a bearish MACD after spending the month of August in decline.
Last week’s volume were -23.41% below par, compared to the past year’s average volume (2,385,526.6 vs. 3,114,788.62), as their share price was able to consolidate a bit & begin to establish a range to halt the decline.
Their 3.37% distribution yield provides some protection against further decline, but this is another instance of needing to tread lightly & wait & see where the market goes next while exploring hedging options.
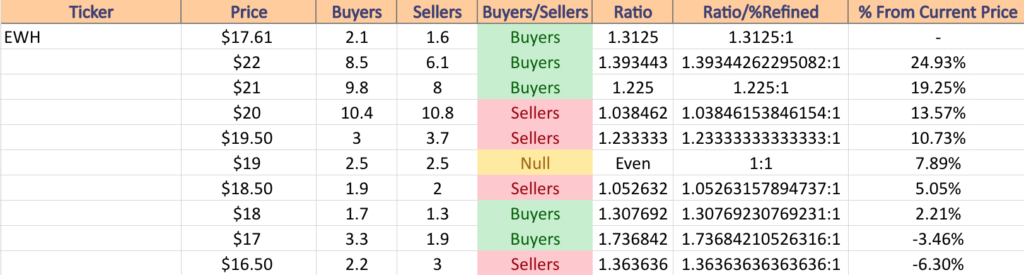
EWH has support at the $17.60 (Volume Sentiment: Buyers, 1.31:1), $17.31 (Volume Sentiment: Buyers, 1.74:1) & $15.58/share (Volume Sentiment: Buyers, 1.03:1) price levels, with resistance at the $17.80 (10 Day Moving Average; Volume Sentiment: Buyers, 1.31:1), $18.27 (Volume Sentiment: Buyers, 1.31:1), $18.51 (Volume Sentiment: Sellers, 1.05:1) & $18.60/share (Volume Sentiment: Sellers, 1.05:1) price levels.
UFO, the Procure Space ETF has declined -16.98% over the past year, losing -18.92% since their 52-week high in August of 2022 & inching +0.74% from their recent 52-week low (ex-distributions).
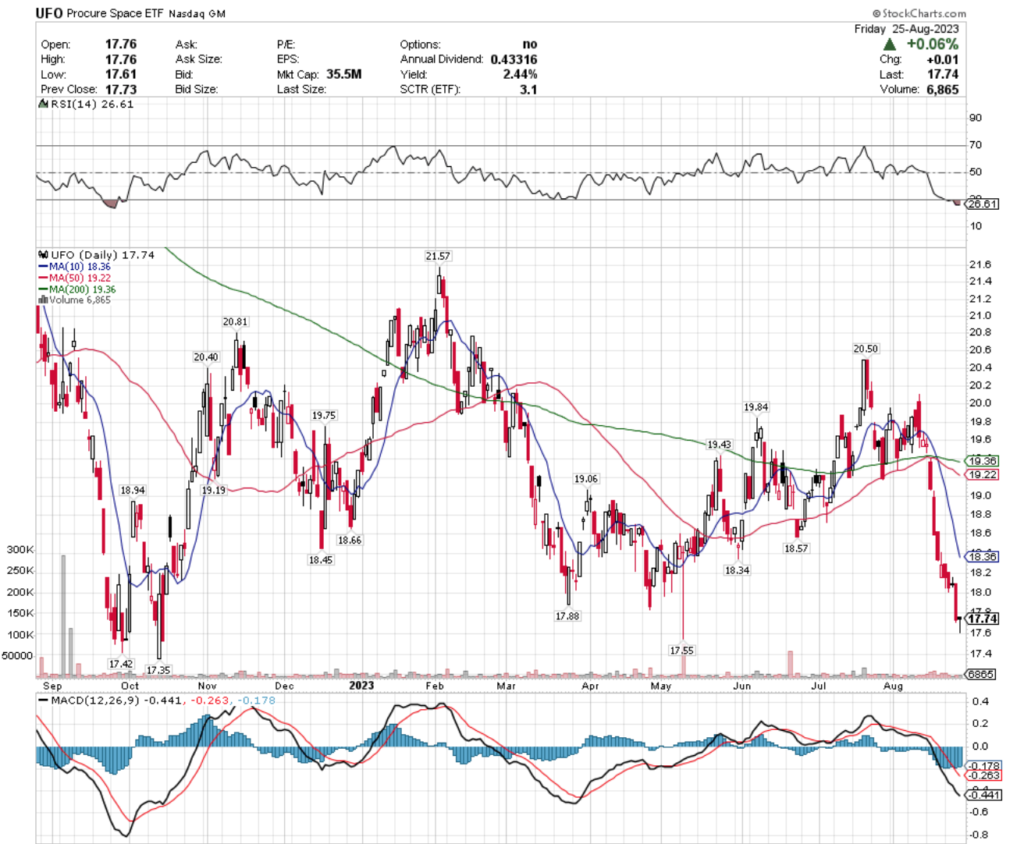
Their RSI is oversold at 26.61, with their MACD still in bearish freefall following a rough August.
Last week’s volume was -27.51% below the average volume for the past year (6,773 vs. 9,343.51), as investors became more cautious once their price got within 3% of their 52-week low.
Wednesday’s candle did flash a warning sign of additional declines as it was a gravestone doji, while we wait to see how Friday’s hammer candle sets the tone for this week.
They offer a 2.44% distribution yield, which will not provide much downside protection in the event that they do test their 52-week low in the near-term.
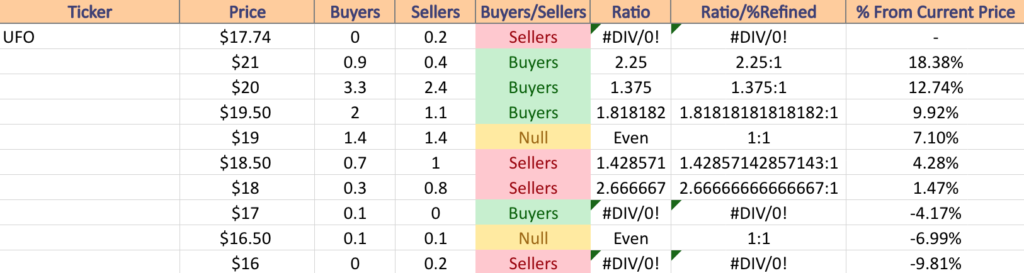
UFO has support at the $17.55 (Volume Sentiment: Sellers, 0.2:0*), $17.42 (Volume Sentiment: Buyers, 0.1:0*) & $17.35/share (Volume Sentiment: Buyers, 0.1:0*) price levels, with resistance at the $17.88 (Volume Sentiment: Sellers, 0.2:0*), $18.34 (Volume Sentiment: Sellers, 2.67:1), $18.36 (10 Day Moving Average; Volume Sentiment: Sellers, 2.67:1) & $18.45/share (Volume Sentiment: Sellers, 2.67:1) price levels.
QABA, the First Trust NASDAQ ABA Community Bank Index Fund ETF has shed -22.28% over the past year, declining -28.07% from their 52-week high in November of 2022 & has rebounded +20.44% from their 52-week low in May of 2023 (ex-distributions).
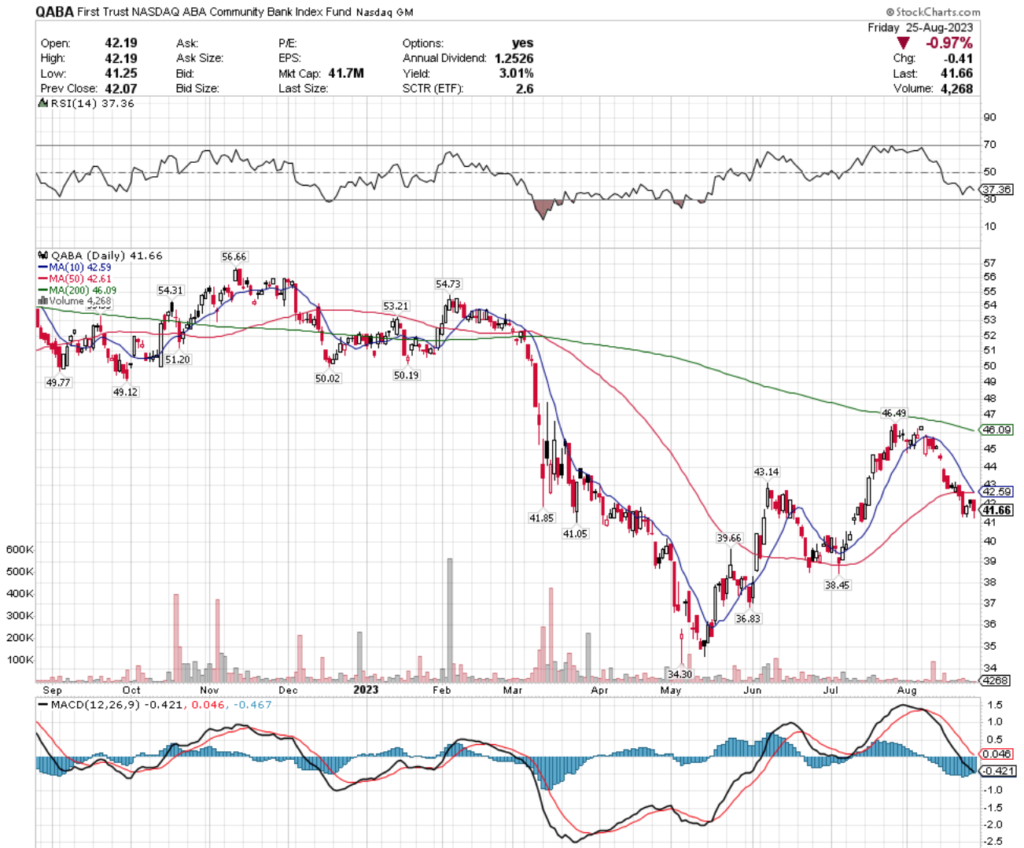
Their RSI is trending towards oversold territory & currently sits at 37.36 & their MACD is bearish.
Last week’s volume was -76.95% below the past year’s average (8,712.6 vs. 37,796.28), as investors mostly stood on the sidelines & watched their price dip under their 50 DMA & consolidate into a range just beneath it.
The 10 DMA is applying pressure from above which will be something to keep an eye on in the coming week.
Their 3.01% distribution yield offers some relief from further losses, but with their current chart layout this seems better suited to be watched for a while or to pursue hedging options to protect existing positions.
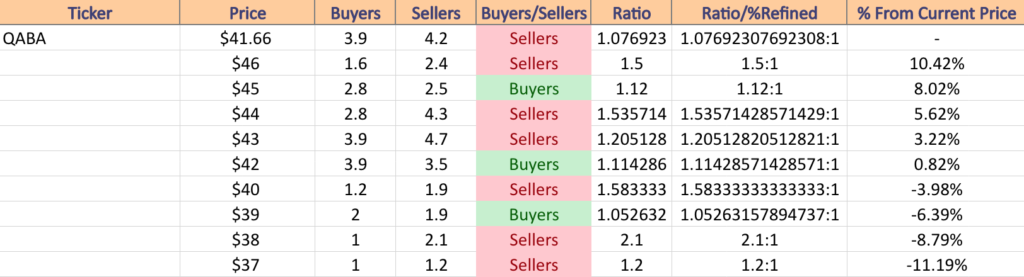
QABA has support at the $41.05 (Volume Sentiment: Sellers, 1.08:1), $39.66 (Volume Sentiment: Buyers, 1.05:1), $38.45 (Volume Sentiment: Sellers, 2:1) & $36.83/share (Volume Sentiment: Sellers, 10:1) price levels, with resistance at the $41.85 (Volume Sentiment: Sellers, 1.08:1), $42.59 (10 Day Moving Average; Volume Sentiment: Buyers, 1.11:1), $42.61 (50 Day Moving Average; Volume Sentiment: Buyers, 1.11:1) & $43.14/share (Volume Sentiment: Sellers, 1.21:1) price levels.
Tying It All Together
Monday has no economic data set to be reported, but HEICO will be reporting earnings.
Tuesday kicks the week off on the economic data front with S&P Case Shiller Home Price Index (20 Cities) at 9 am, followed by Job Openings & Consumer Confidence at 10 am.
Ambarella, American Woodmark, Best Buy, Big Lots, Box, Catalent, Donaldson, Hewlett Packard Enterprise, HP, J.M. Smucker, Malibu Boats, NIO, Pinduoduo, PVH & ZTO Express are all reporting earnings on Tuesday.
Wednesday starts with ADP Employment data at 8:15 am, followed by GDP (revision), Advanced U.S. Trade Balance In Goods, Advanced Retail Inventories & Advanced Wholesale Inventories data at 8:30 am & closes out with Pending Home Sales data at 10 am.
Salesforce, Brown-Forman, Chewy, Conn’s, Cooper, CrowdStrike, Five Below, MasterCraft, Okta, Patterson Companies, Veeva Systems & Victoria’s Secret all report earnings on Wednesday.
Thursday morning is a busy one, with Initial Jobless Claims, Personal Income (nominal), Personal Spending (nominal), PCE Index, Core PCE Index, PCE (year-over-year) & Core PCE (year-over-year) at 8:30 am & Chicago Business Barometer data at 9:45 am.
Thursday’s earnings calls include Dell Technologies, Lululemon Athletica, Academy Sports + Outdoors, Broadcom, BRP, Caleres, Campbell Soup, Dollar General, Genesco, Hello Group, Hormel Foods, MongoDB, Nutanix, Ollie’s Bargain Outlet, Signet Jewelers, Titan Machinery, VMWare & UBS.
Friday delivers the U.S. Nonfarm Payroll, U.S. Unemployment Rate, U.S. Hourly Wages, & Hourly Wages Year-over-Year data at 8:30 am, followed by ISM Manufacturing & Construction Spending data at 10 am & no scheduled major earnings reports.
See you back here next week!
**** I DO NOT OWN SHARES OR HAVE OPTIONS CONTRACT POSITIONS IN SPY, QQQ, IWM, DIA, PXJ, XHB, FCG, DBJP, DRN, EWH, UFO, or QABA AT THE TIME OF PUBLISHING THIS ARTICLE ***