Palo Alto Networks Inc. stock trades under the ticker PANW & has advanced +77.4% from their 52-week low in January of 2023.
August has been an interesting month for them, kicking off the month with an -8% gap down, but gapping up +14.75% this past Monday.
While they’re shy of their 52-week high, it is worthwhile to examine their volume sentiment at each price level that they’ve traded at in the past 1-2 years in order to get a better understanding of how their shares may trade in the coming months.
It is particularly important as it may give insight into how they’ll trade as their price approaches the windows created by the two aforementioned gaps.
The Price:Volume analysis below seeks to display the volume at specific share-price levels from over the past two-to-three years & is intended to serve as a reference point for how investors viewed PANW stock’s value at each level.
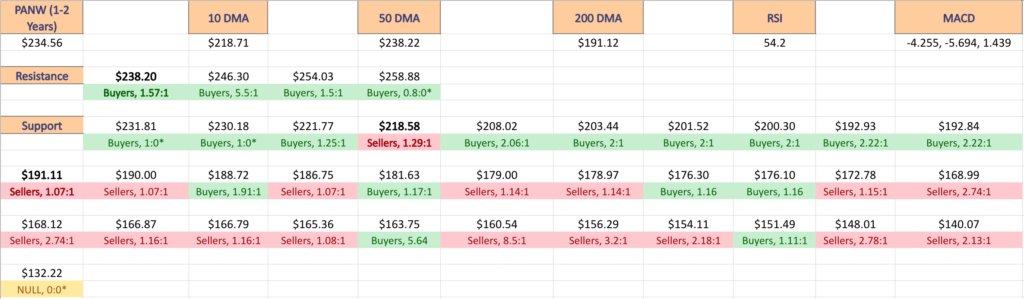
It also includes a list of moving averages, as well as support & resistance levels, which will be marked in bold.
Palo Alto Networks Inc. PANW Stock’s Price:Volume Sentiment Broken Down
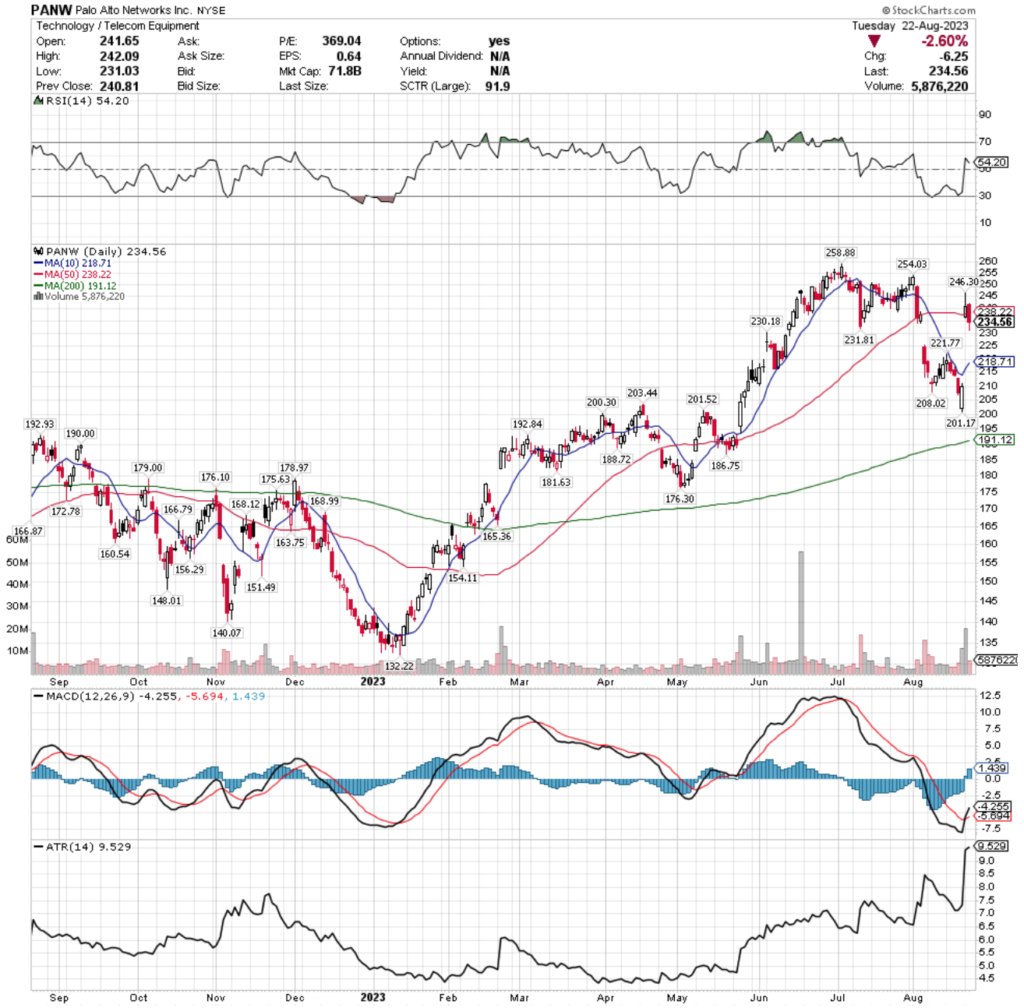
Their RSI is currently neutral at 54.2 & their MACD is slightly bullish following Monday’s gap up session.
Their average true range is signaling that they will see a decline in the near-term, or at least some rangebound activity around their current price level.
Volumes over the past week & a half have been +51.82% higher than the average volume for the past year (7,307,033.51 vs. 4,812,866.01), signaling that investor sentiment was strong on last Friday & Monday of this week, which may lead to some profit taking in the near-term.
Looking in the windows created by the gap we can see that there are 2 support levels that are near the current price level, with the nearest support near the bottom of the gap getting help from the 10 day moving average in the coming week, which may help them in the event of decline.
Yesterday’s bearish engulfing candlestick is a cause for concern however & market participants would be wise to keep a close eye on PANW in the coming days-to-weeks.
The bold prices on the image below denote the moving average levels just listed & the bold entries in the list form of the analysis under the images include other levels of support.
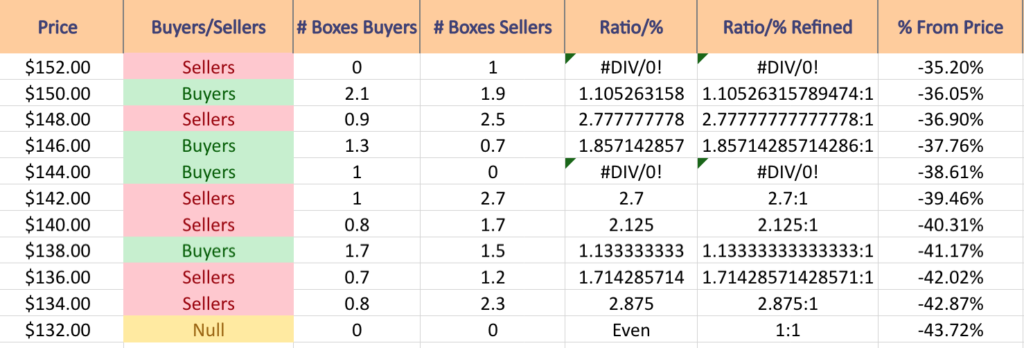
Each corresponding price level using a ratio of Buyers:Sellers (or Sellers:Buyers), NULL values denote that there was not enough data, so the ratio would’ve been 0:0.
Ratios with a 0 for the denominator/constant are denoted with an *, but are reported as is, as we are accounting for volume/sentiment.
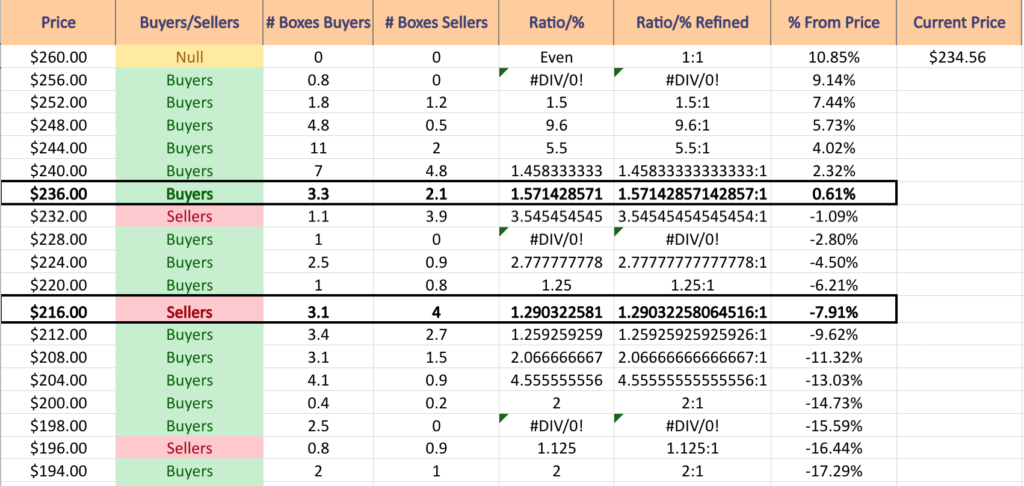
Palo Alto Networks Inc. PANW Stock’s Volume By Price Level
$260 – NULL – 0:0*; +10.85% From Current Price Level
$256 – Buyers – 0.8:0*; +9.14% From Current Price Level
$252 – Buyers – 1.5:1; +7.44% From Current Price Level
$248 – Buyers – 9.6:1; +5.73% From Current Price Level
$244 – Buyer s- 5.5:1; +4.02% From Current Price Level
$240 – Buyers – 1.46:1; +2.32% From Current Price Level
$236 – Buyers – 1.57:1; +0.61% From Current Price Level – 50 Day Moving Average
$232 – Sellers – 3.55:1; -1.09% From Current Price Level
$228 – Buyers – 1:0*; -2.8% From Current Price Level
$224 – Buyers – 2.78:1; -4.5% From Current Price Level
$220 – Buyers – 1.25:1; -6.21% From Current Price Level
$216 – Sellers – 1.29:1; -7.91% From Current Price Level – 10 Day Moving Average
$212 – Buyers – 1.26:1; -9.62% From Current Price Level
$208 – Buyers – 2.07:1; -11.32% From Current Price Level
$204 – Buyers 4.56:1; -123.03% From Current Price Level
$200 – Buyers – 2:1; -14.73% From Current Price Level
$198 – Buyer s- 2.5:0*; -15.59% From Current Price Level
$196 – Sellers – 1.13:1; -16.44% From Current Price Level
$194 – Buyers 2:1; -17.29% From Current Price Level
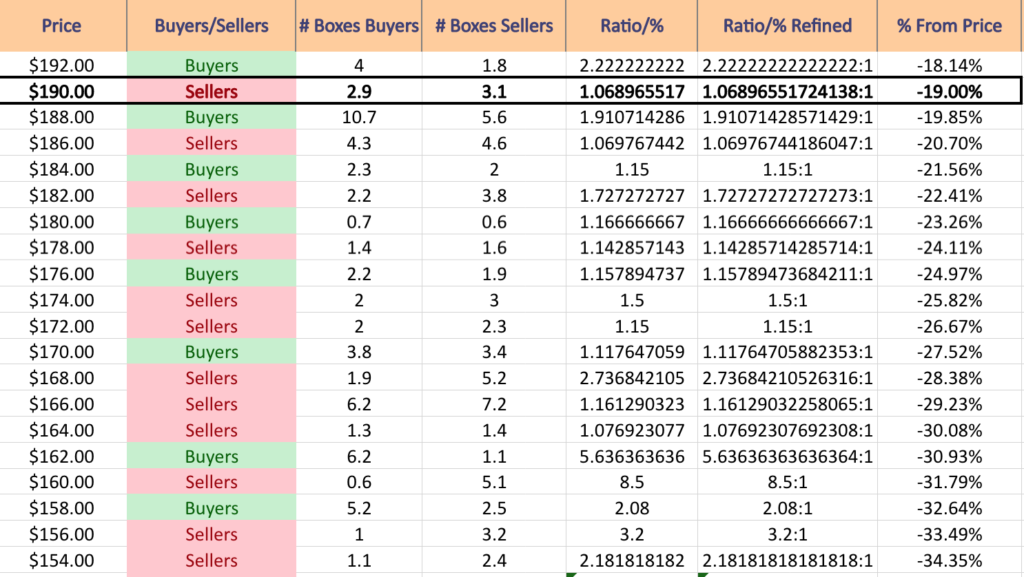
$192 – Buyers – 2.22:1; -18.14% From Current Price Level
$190 – Sellers – 1.07:1; -19% From Current Price Level – 200 Day Moving Average
$188 – Buyers – 1.91:1; -19.85% From Current Price Level
$186 – Sellers – 1.07:1; -20.7% From Current Price Level
$184 – Buyers 1.15:1; -21.56% From Current Price Level
$182 – Sellers – 1.73:1; -22.41% From Current Price Level
$180 – Buyers – 1.17:1; -23.26% From Current Price Level
$178 – Sellers – 1.14:1; -24.11% From Current Price Level
$176 – Buyers – 1.16:1; -24.97% From Current Price Level
$174 – Sellers – 1.5:1; -25.82% From Current Price Level
$172 – Sellers – 1.15:1; -26.67% From Current Price Level
$170 – Buyers – 1.12:1; -27.52% From Current Price Level
$168 – Sellers – 2.74:1; -28.38% From Current Price Level
$166 – Sellers – 1.16:1; -29.23% From Current Price Level
$164 – Sellers – 1.08:1; -30.08% From Current Price Level
$162 – Buyers – 5.64:1; -30.93% From Current Price Level
$160 – Sellers – 8.5:1; -31.79% From Current Price Level
$158 – Buyers – 2.08:1; -32.64% From Current Price Level
$156 – Sellers – 3.2:1; -33.49% From Current Price Level
$154 – Sellers – 2.18:1; -34.35% From Current Price Level
$152 – Sellers – 1:0*; -35.2% From Current Price Level
$150 – Buyers – 1.11:1; -36.05% From Current Price Level
$148 – Sellers – 2.78:1; -36.9% From Current Price Level
$146 – Buyers – 1.86:1; -37.76% From Current Price Level
$144 – Buyers – 1:0*; -38.61% From Current Price Level
$142 – Sellers – 2.7:1; -39.46% From Current Price Level
$140 – Sellers – 2.13:1; -40.31% From Current Price Level
$138 – Buyers – 1.13:1; -41.17% From Current Price Level
$136 – Sellers – 1.71:1; -42.02% From Current Price Level
$134 – Sellers – 2.88:1; -42.87% From Current Price Level
$132 – NULL – 0:0*; -43.72% From Current Price Level
Tying It All Together
The list & image above paint the picture as to how investors & traders have behaved at various price levels that PANW has been at over the past one-to-two years.
It is not meant to serve as investment/trading advice, and is simply a way to visualize what investor/trader sentiment has been like at each of the price levels mentioned, as well as what it was at levels of support & resistance that are denoted in the image & list.
As always, do your own due diligence before making investing/trading decisions.
For more on the methodology on how the data was collected & put together, please refer to our original Price:Volume analysis.
*** I DO NOT OWN SHARES OR OPTIONS CONTRACT POSITIONS IN PANW AT THE TIME OF PUBLISHING THIS ARTICLE ***