OIH, the VanEck Vectors Oil Services ETF has performed well over the past year, gaining +82.78% since their 52-week low in September of 2022 (ex-distributions).
Much of their success has been due to the strength of oil & oil services companies in Q4 2022 & into 2023.
Some of their largest holdings include Schlumberger Nv (SLB, 19.68%), Halliburton Co. (HAL, 11.47%), Baker Hughes Co. (BKR, 8.43%), Tenaris SA (TS, 5.04%), TechnipFMC PLC (FTI, 5%), Patterson-UTI Energy Inc. (PTEN, 4.73%) & more.
Their price is currently -1.48% below their 52-week high, making it an opportune time to check in & see what their volumes have been over the last 1-2 years at the price levels that they’ve traded at.
The Price:Volume analysis below seeks to display the volume at specific share-price levels from over the past one-to-two years & is intended to serve as a reference point for how investors viewed OIH ETF’s value at each level.
It also includes a list of moving averages, as well as support & resistance levels, which will be marked in bold.
Breaking Down The Technicals & Price:Volume Sentiment For OIH, The VanEck Vectors Oil Services ETF

Their RSI is currently trending back towards neutral from oversold territory, but still sits relatively oversold at 63.76, as their MACD looks set for a bearish crossover in the coming days.
Trading volumes have declined -14.27% this past week compared to the average of the year prior’s volumes (602,360 vs. 702,596), as investors have adopted a wait & see approach with prices so close to their 52-week high.
The 10 day moving average will be a point of interest to keep an eye on, as it is the nearest level of support to the current share price & beginning to signal signs of weakness as it is curving over.
Last week kicked off with an up session on Monday, however the filled in candlestick body shows that the session closed lower than it opened, as enthusiasm waned during the day’s session.
Tuesday’s gap up set the stage for a rangebound rest of the week, with the last three sessions resulting in spinning top candlesticks, which signals uncertainty & hesitancy among market participants.
Technical indicators are signaling that it is time for a cool off for OIH’s price & the table & list below can be useful to see how market participants have behaved at each price level OIH traded at over the past 1-2 years.
While history will not repeat itself perfectly, it will often rhyme, making it worth having the insights below as you watch the price action for OIH in the near-future.
The bold prices on the image below denote the moving average levels just listed & the bold entries in the list form of the analysis under the images include other levels of support.
Each corresponding price level using a ratio of Buyers:Sellers (or Sellers:Buyers), NULL values denote that there was not enough data, so the ratio would’ve been 0:0.
Ratios with a 0 for the denominator/constant are denoted with an *, but are reported as is, as we are accounting for volume/sentiment.
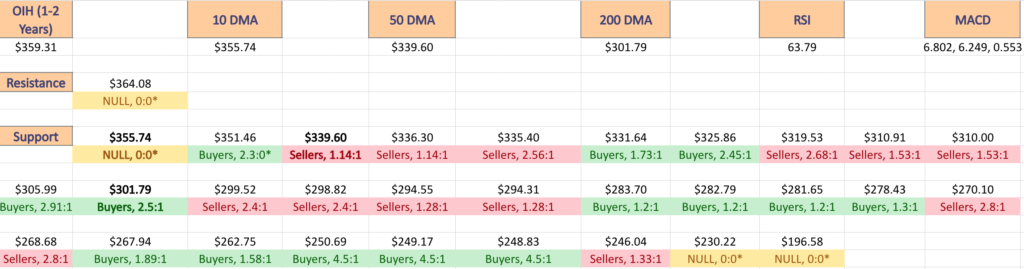
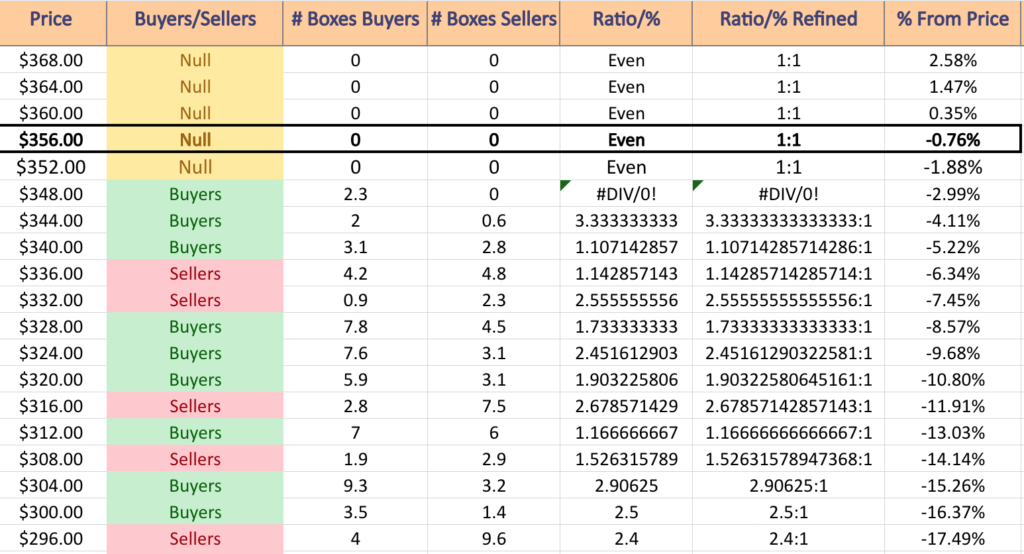
OIH, The VanEck Oil Services ETF’s Volume By Price Level Over The Past 1-2 Years
$368 – NULL – 0:0*; +2.58% From Current Price Level
$364 – NULL – 0:0*; +1.47% From Current Price Level
$360 – NULL – 0:0*; +0.35% From Current Price Level
$356 – NULL – 0:0*; -0.76% From Current Price Level – Current Price Block
$352 – NULL – 0:0*; -1.88% From Current Price Level – 10 Day Moving Average
$348 – Buyers – 2.3:0*; -2.99% From Current Price Level
$344 – Buyers – 3.33:1; -4.11% From Current Price Level
$340 – Buyers – 1.11:1; -5.22% From Current Price Level
$336 – Sellers – 1.14:1; -6.34% From Current Price Level – 50 Day Moving Average
$332 – Sellers – 2.56:1; -7.45% From Current Price Level
$328 – Buyer s- 1.73:1; -8.57% From Current Price Level
$324 – Buyers – 2.45:1; -9.68% From Current Price Level
$320 – Buyer s- 1.9:1; -10.8% From Current Price Level
$316 – Sellers – 2.68:1; -11.91% From Current Price Level
$312 – Buyers – 1.17:1; -13.03% From Current Price Level
$308 – Sellers – 1.53:1; -14.14% From Current Price Level
$304 – Buyers – 2.91:1; -15.26% From Current Price Level
$300 – Buyers – 2.5:1; -16.37% From Current Price Level – 200 Day Moving Average
$296 – Sellers – 2.4:1; -17.49% From Current Price Level
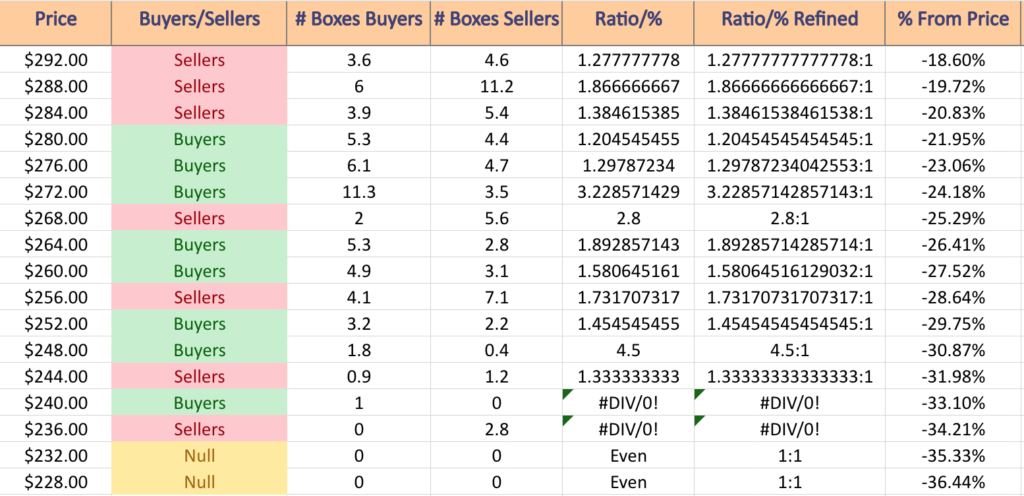
$292 – Sellers – 1.28:1; -18.6% From Current Price Level
$288 – Sellers – 1.87:1; -19.72% From Current Price Level
$284 – Sellers – 1.39:1; -20.83% From Current Price Level
$280 – Buyers – 1.2:1; -21.95% From Current Price Level
$276 – Buyers – 1.30:1; -23.06% From Current Price Level
$272 – Buyers – 3.23:1; -24.18% From Current Price Level
$268 – Sellers – 2.8:1; -25.29% From Current Price Level
$264 – Buyers – 1.89:1; -26.41% From Current Price Level
$260 – Buyers – 1.58:1; -27.52% From Current Price Level
$256 – Sellers – 1.73:1; -28.64% From Current Price Level
$252 – Buyers – 1.45:1; -29.75% From Current Price Level
$248 – Buyers – 4.5:1; -30.87% From Current Price Level
$244 – Sellers – 1.33:1; -31.98% From Current Price Level
$240 – Buyers – 1:0*; -33.1% From Current Price Level
$236 – Sellers – 2.8:0*; -34.21% From Current Price Level
$232 – NULL – 0:0*; -35.33% From Current Price Level
$228 – NULL – 0:0*; -36.44% From Current Price Level
Tying It All Together
The list & image above paint the picture as to how investors & traders have behaved at various price levels that OIH has been at over the past one-to-two years.
It is not meant to serve as investment/trading advice, and is simply a way to visualize what investor/trader sentiment has been like at each of the price levels mentioned, as well as what it was at levels of support & resistance that are denoted in the image & list.
As always, do your own due diligence before making investing/trading decisions.
For more on the methodology on how the data was collected & put together, please refer to our original Price:Volume analysis.
*** I DO NOT OWN SHARES OR OPTIONS CONTRACT POSITIONS IN OIH AT THE TIME OF PUBLISHING THIS ARTICLE ***