SPY, the SPDR S&P 500 ETF declined -0.78% last week in a week of relatively rangebound trading.
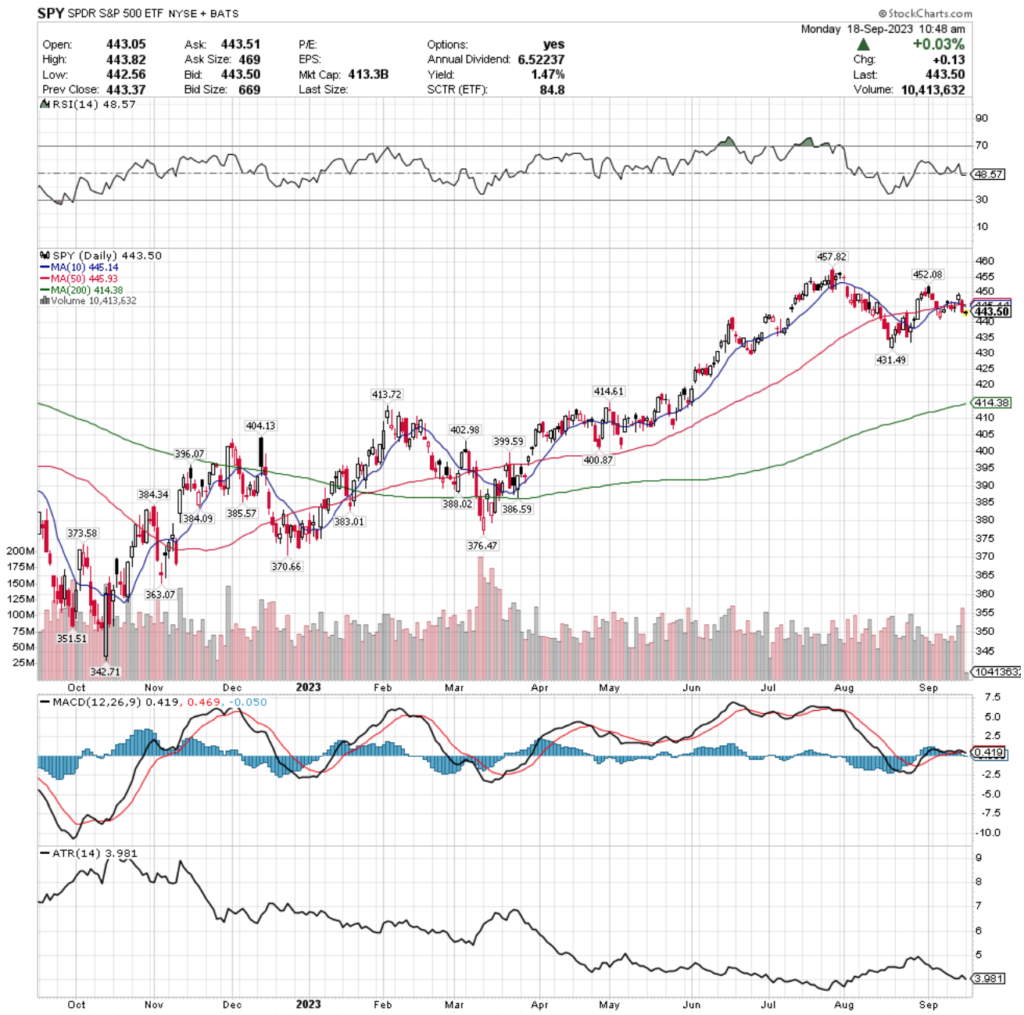
Their RSI is sitting just below the neutral mark at 48.57, with a MACD that is crossing over bearishly as we head into a new week.
Volumes were -8.8% less than average last week compared to the year prior (76,627,400 vs. 84,016,741), signaling that investors are feeling uncertain, which is confirmed by Friday’s risk off session being the week’s highest volume.
Monday’s session kicked off with a hanging man that was able to close above the support of the 10 & 50 day moving averages.
Tuesday’s candle was a bearish spinning top that was unable to stay above the 10 & 50 day moving averages, followed by a doji on Wednesday what also was not able to break that resistance.
Thursday saw a glimmer of hope with a session that jumped above the resistance levels & was able to maintain that price level into the close before everything unwound on Friday’s high volume risk off session heading into the weekend that closed below the 10 & 50 day moving average.
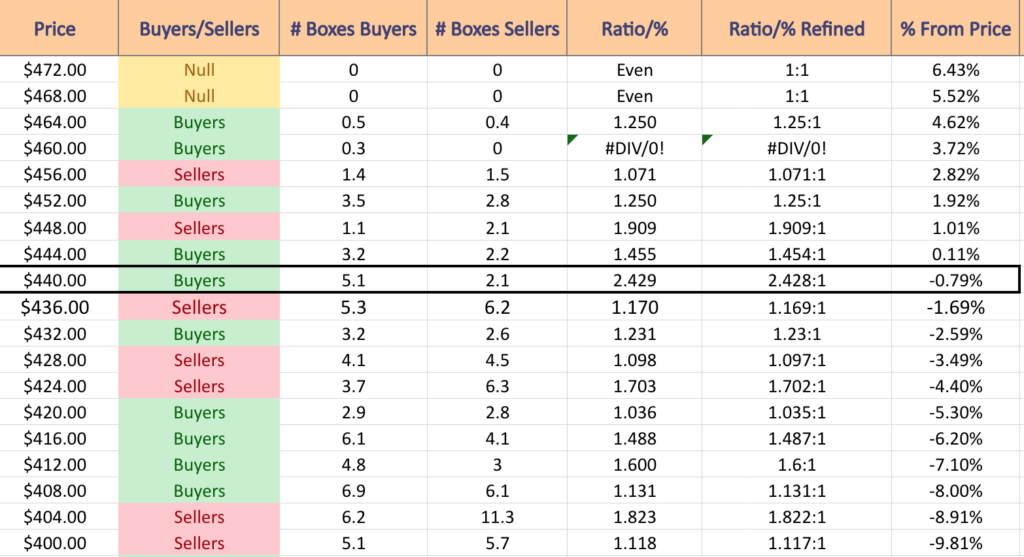
SPY has support at the $431 (Volume Sentiment: Sellers, 1.10:1), $414.61 (Volume Sentiment: Buyers, 1.6:1), $414.38 (200 Day Moving Average; Volume Sentiment: Buyers, 1.6:1) & $413.72/share (Volume Sentiment: Buyers, 1.6:1) price levels, with resistance at the $445.14 (10 Day Moving Average; Volume Sentiment: Buyers, 1.45:1), $445.93 (50 Day Moving Average; Volume Sentiment: Buyers, 1.45:1), $452.08 (Volume Sentiment: Buyers, 1.25:1) & $457.82/share (52-Week High; Volume Sentiment: Sellers, 1.07:1) price levels.
QQQ, the Invesco QQQ Trust ETF dropped -1.63% last week, faring the worst of the major indexes.
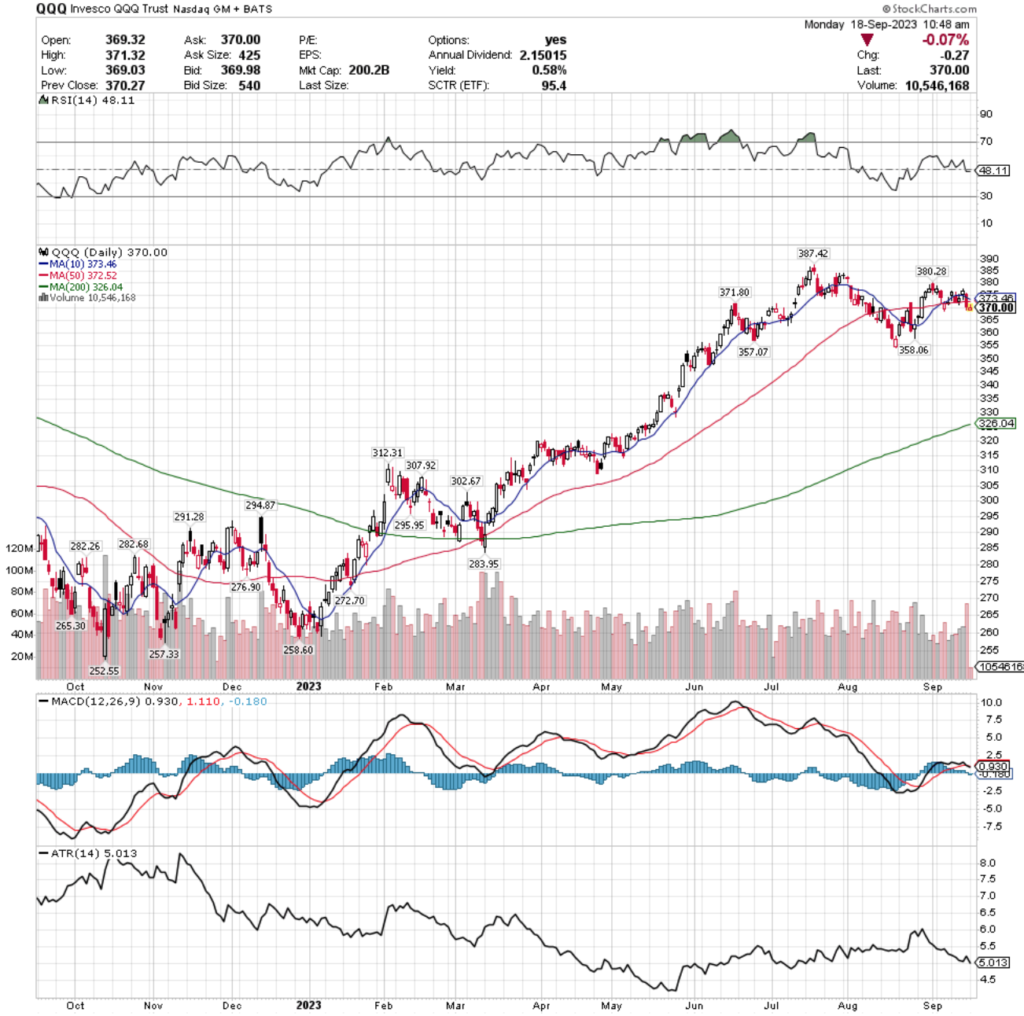
Their RSI is just below the neutral mark at 48.11, with a MACD that has recently crossed over bearishly.
Volumes were -11.22% below average last week vs. the year prior (49,085,080 vs. 55,285,373), which like SPY was strongest on Friday’s risk off session, indicating that investors are feeling uneasy & more risk averse in the near-term.
QQQ’s chart has a lot in common with SPY’s for last week, kicking the week off with a hanging man that was able to settle & close on the top of the 10 day moving average’s support.
Tuesday’s bearish candle’s real body was wedged in between the 10 & 50 day moving averages, with the upper shadow briefly breaking resistance but not closing above it.
Wednesday’s spinning top showed investors were getting jittery, with the candle’s body staying between the 10 & 50 day moving averages & closing atop the support of the 50 DMA.
Thursday offered a glimmer of hope blended with uncertainty, as the day’s session resulted in a spinning top that was able to break above the 10 day moving average & close above it.
That indecision resulted in a big risk off Friday, which is setting the tone for more near-term declines as investors will be watching for the 10 DMA to bearishly cross the 50 DMA in the coming days.
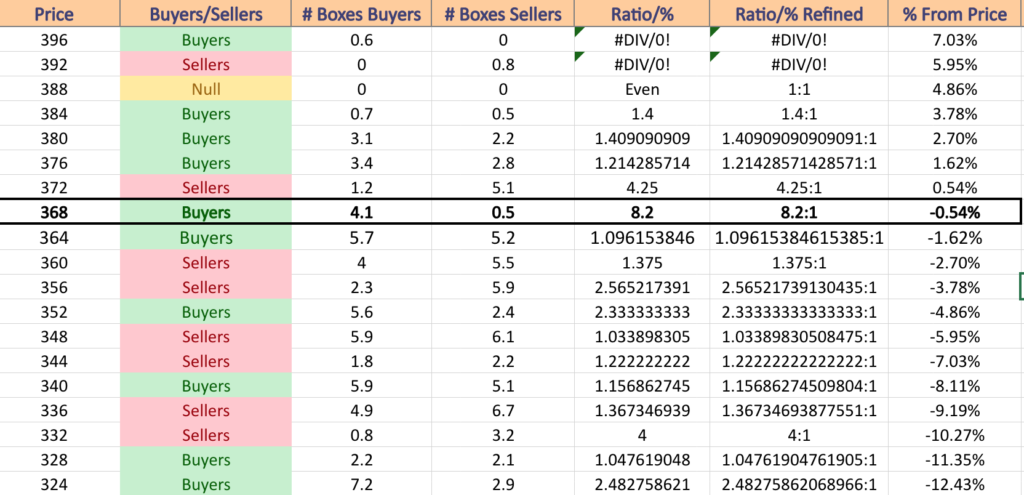
QQQ has support at the $358.06 (Volume Sentiment: Sellers, 2.56:1), $357.07 (Volume Sentiment: Sellers, 2.56:1), $326.04 (200 Day Moving Average; Volume Sentiment: Buyers, 2.48:1) & $312.31/share (Volume Sentiment: NULL; 0:0*) price levels, with resistance at the $371.80 (Volume Sentiment: Buyers, 8.2:1), $372.52 (50 Day Moving Average; Volume Sentiment: Sellers, 4.25:1), $373.46 (10 Day Moving Average; Volume Sentiment: Sellers, 4.25:1) & $380.28/share (Volume Sentiment: Buyers, 1.41:1) price levels.
IWM, the iShares Russell 2000 ETF lost -0.41% last week, as their prices remained relatively range-bound for the week.
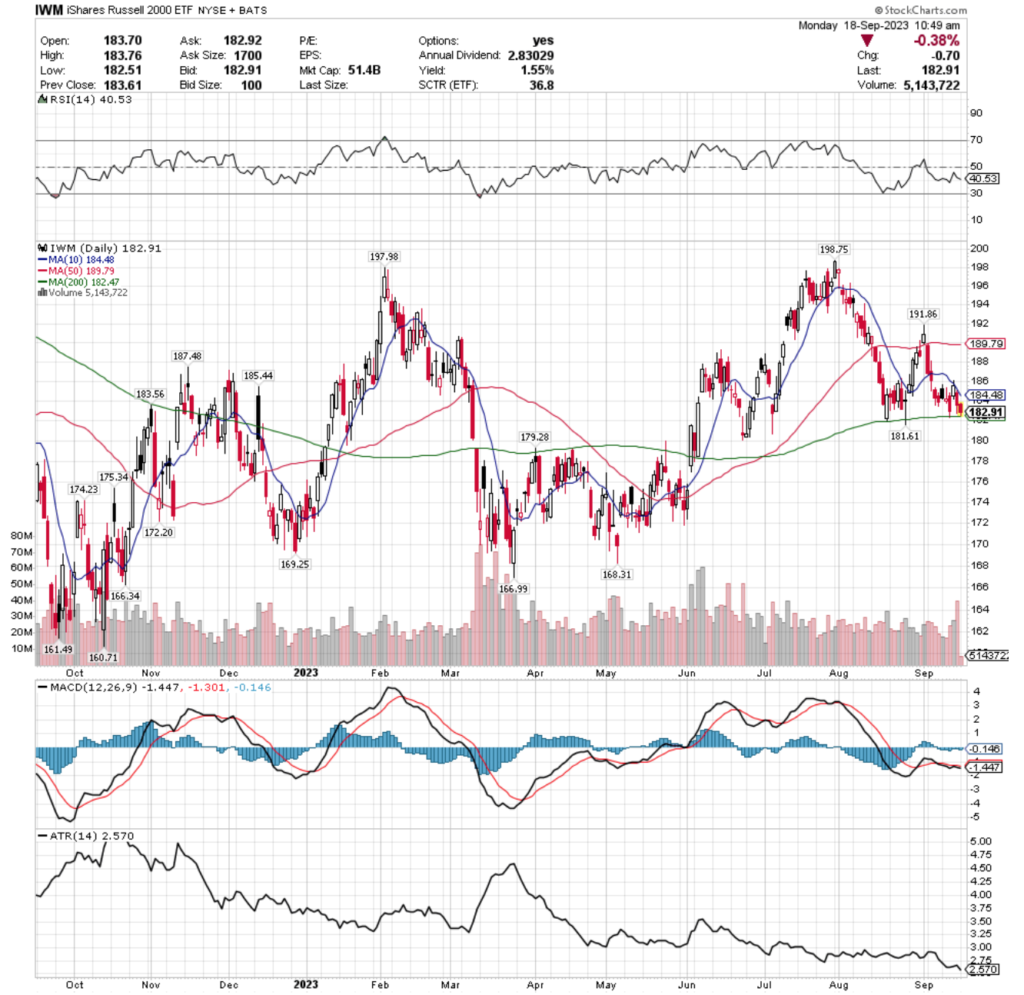
Their RSI is trending toward oversold & currently sits at 40.53 & their MACD has been bearish since the beginning of September.
Volumes fell -10.13% below the year prior’s average last week (25,259,700 vs. 28,105,603) in a sign of indecision during the week, but investors should note that Friday’s sell off into the weekend was the strongest volume session of the week, which is a warning signal.
Monday kicked off with a bullish start, however the session closed lower than it opened, which set the stage for the declines through the rest of the week.
Tuesday’s candle shows a wide range of prices were covered, but the open & close were concentrated towards the bottom of the day’s candle.
Wednesday the decline continued, but was supported by the 200 day moving average, before Thursday’s session attempted to break above the 10 day moving average’s resistance but was only able to briefly, as the close was below the 10 DMA.
Friday was a risk off session, with the 10 DMA forcing IWM lower, although the support of the 200 DMA was not broken.
As their 10 DMA approaches the 200 DMA it will be worth keeping an eye on to see if support holds up for their share price.
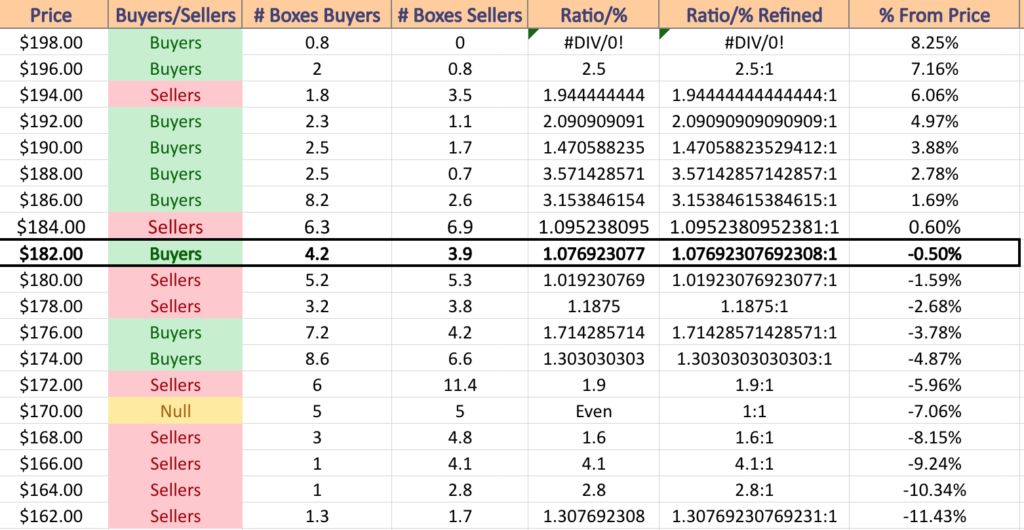
IWM has support at the $182.47 (200 Day Moving Average; Volume Sentiment: Buyers, 1.08:1), $181.61 (Volume Sentiment: Sellers, 1.02:1), $179.28 (Volume Sentiment: Sellers, 1.19:1) & $175.34/share (Volume Sentiment: Buyers, 1.3:1) price levels, with resistance at the $183.56 (Volume Sentiment: Buyers, 1.08:1), $184.48 (10 Day Moving Average; Volume Sentiment: Sellers, 1.10:1), $185.44 (Volume Sentiment: Sellers, 1.10:1) & $187.48/share (Volume Sentiment: Buyers, 3.15:1) price levels.
DIA, the SPDR Dow Jones Industrial Average ETF inched downward -0.09% last week, as investors were not as eager to exit larger cap stocks as they were other names.
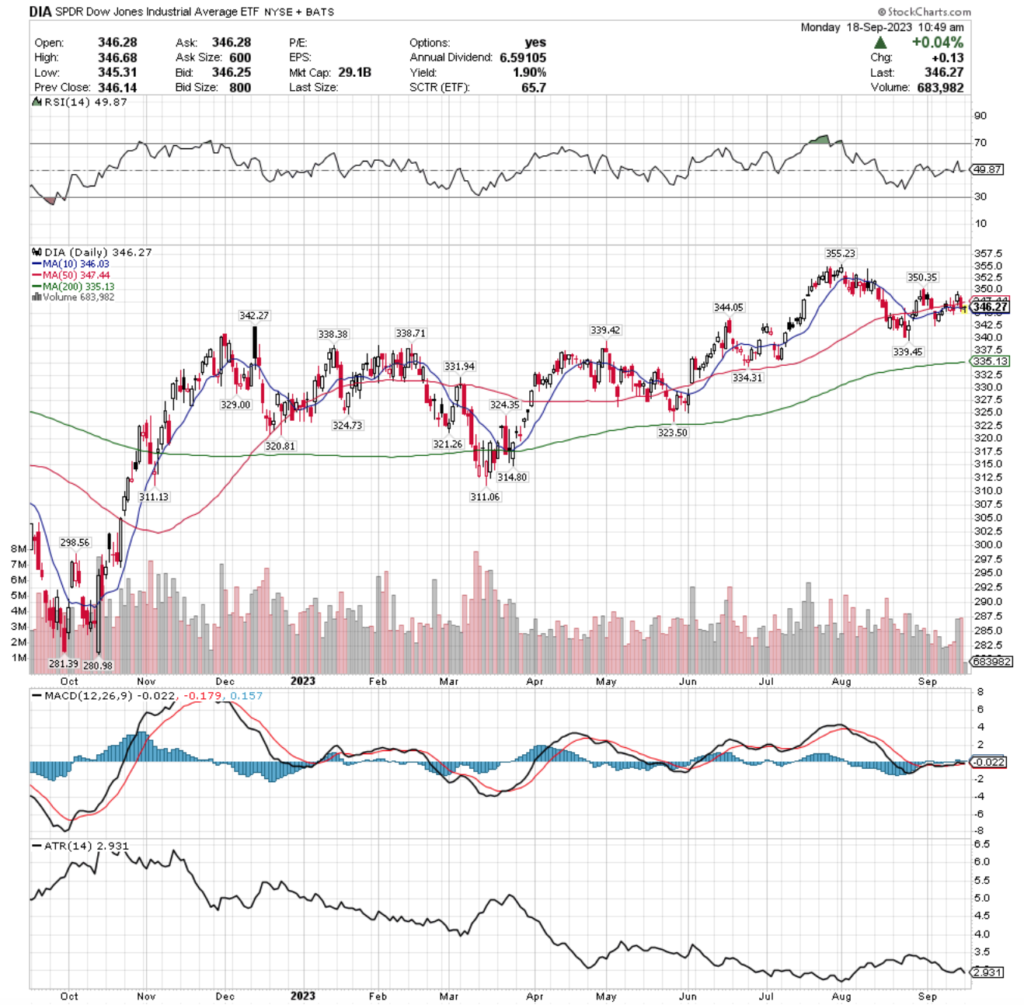
Their RSI is just below the neutral mark at 49.87, but their MACD is signaling a bearish crossover is on the near-term horizon.
Their volume declined -30.37% below average last week compared to the year prior (2,526,420 vs. 3,628,365) as market participants took a mostly wait & see approach to DIA, with exception to Thursday’s pump attempt to break & remain above support & Friday’s risk off profit taking that led the week in terms of highest volume sessions.
Monday’s session was a spinning top that was unable to close over the resistance of the 50 DMA, but was supported by the close by 10 DMA.
Tuesday also had a spinning top, as for a second day investors had feelings of indecision, except the support of the 10 DMA broke down.
Wednesday they attempted to break the 10 & 50 DMAs & were able to temporarily on Thursday before Friday’s session indicated that investors were feeling more risk averse heading into the weekend.
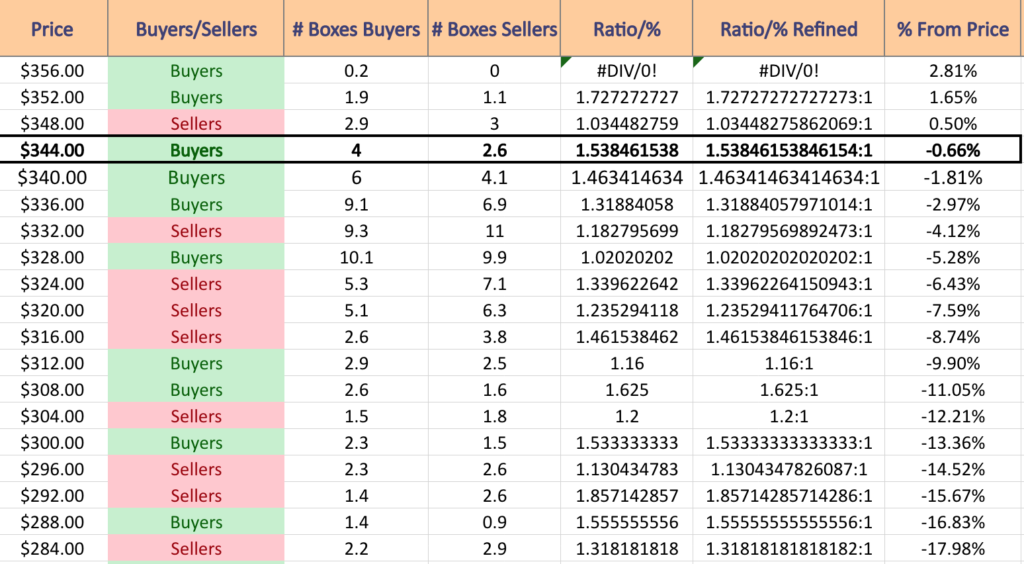
DIA has support at the $346.03 (10 Day Moving Average; Volume Sentiment: Buyers, 1.54:1), $344.05 (Volume Sentiment: Buyers, 1.54:1), $342.27 (Volume Sentiment: Buyers, 1.46:1) & $339.45/share (Volume Sentiment: Buyers, 1.32:1) price levels, with resistance at the $347.44 (50 Day Moving Average; Volume Sentiment: Buyers, 1.54:1), $350.35 (Volume Sentiment: Sellers, 1.03:1), $355.23 (52-Week High; Volume Sentiment: Buyers, 1.73:1) price levels.
Tying It All Together & The Week Ahead
Monday kicks off with Home Builder Confidence Index data at 10 am & Stitch Fix is scheduled to report earnings.
Housing Starts & Building Permits will be reported on Tuesday morning at 8:30 am.
Tuesday’s earnings reports include Apogee Enterprises, AutoZone, Endava & Steelcase.
The Fed Interest Rate Decision will be announced Wednesday at 2 pm, followed by Chairman Powell’s Press Conference at 2:30 pm.
FedEx reports earnings on Wednesday, as well as General Mills & KB Home.
Initial Jobless Claims, Philadelphia Fed Manufacturing Survey & U.S. Current Account Deficit data are reported at 8:30 am Thursday, followed by U.S. Leading Economic Indicators & Existing Home Sales data at 10 am.
Darden Restaurants & FactSet are due to report earnings results on Thursday.
Friday the week winds down with Fed Governor Lisa Cook speaking at 8:30 am, followed by S&P Flash U.S. Services PMI & S&P Flash U.S. Manufacturing PMI at 9:45 am & at 1pm Minneapolis Fed President Neil Kashkari & San Francisco Fed President Mary Daly are scheduled to both speak.
There are no major earnings reports scheduled for Friday.
See you back here next week!
*** I DO NOT OWN SHARES OR OPTIONS CONTRACT POSITIONS IN SPY, QQQ, IWM or DIA AT THE TIME OF PUBLISHING THIS ARTICLE ***