Schlumberger Ltd. stock trades under the ticker SLB & has climbed +83.35% since their 52-week low in September of 2022 (ex-dividends), closely in-line with the advances of OIH who were featured in yesterday’s post.
SLB makes up ~20% of OIH’s total holdings & is also a component of IEZ (22.34%), XLE (4.54%), PXJ (5.02%), XES (4.2%), IYE (4.45%) RSPG (4.41%), DRLL (4.36%) & many other ETFs, hence the similar performance of the stock & the ETF.
As SLB currently sits -2.69% below their 52-week high, it’s worth taking a look into how market participants have behaved in recent history at each price level that they’ve traded at in order to gain insight into how they may behave in the near future.
This will serve as a reference for how strong support & resistance levels may be when they are approached again.
The Price:Volume analysis below seeks to display the volume at specific share-price levels from over the past one-to-two years & is intended to serve as a reference point for how investors viewed SLB stock’s value at each level.
It also includes a list of moving averages, as well as support & resistance levels, which will be marked in bold.
Breaking Down The Technicals & Price:Volume Sentiment For Schlumberger Ltd. SLB Stock
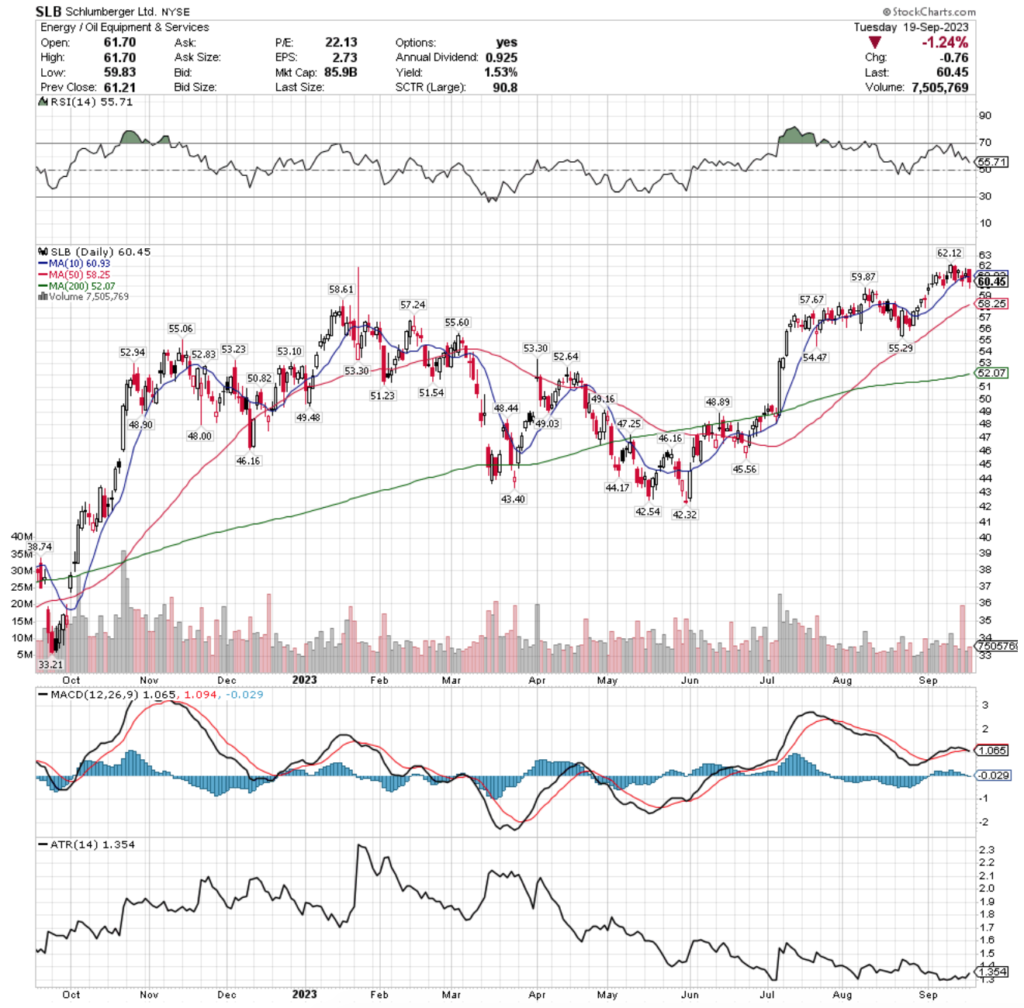
Their RSI is trending back towards neutral & currently sits at 55.71, with a MACD that is about to crossover bearishly in the coming 1-2 days.
SLB’s volumes over the past week & a half have been -6.65% below average compared to the year prior (9,960,342.86 vs. 10.670,062.95), indicating that investors have become hesitant at these high price levels to continue buying & are taking a break during this consolidation range.
One thing of note, Friday’s session had the highest volume in a risk off move into the weekend, where a spinning top candle was unable to break the resistance of the 10 day moving average.
There looks to be a bearish head & shoulders pattern forming that began forming in July/early August, where the head would be the 52-week high’s session.
The profit taking from that +12.35% run up to the high covered a much wider range of prices for the day’s session, but occurred on ~33% of the volume of the highest volume sell off day & the former session was supported by the 10 DMA, whereas the latter was unable to close above it.
This may serve as confirmation that we will see that pattern formation play out in the coming month if the 10 DMA continues to act as resistance in the coming days.
Monday’s session was another spinning top & while bullish, the price action for the day in terms of the open & the close were concentrated around the bottom of the candle, barely above the 10 DMA.
Yesterday’s session closed below the 10 DMA, with the lower shadow of the candle signaling that investors were even more bearish on the day, which looks likely to continue in the near-term.
Looking at their Average True Range (ATR, Bottom Pane of Chart), the ATR is reverting back to the mean as their price deflates, which signals that there is likely going to be more selling over the next couple of weeks before a new consolidation range is established.
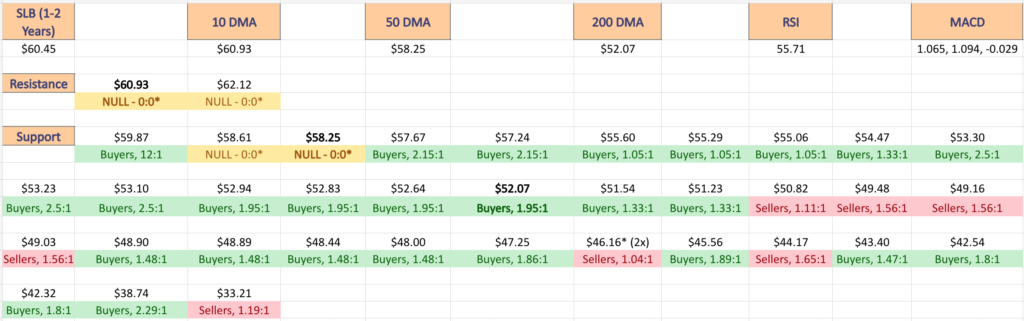
With this in mind, when reading the chart & list below keep in mind the Buyer:Seller sentiment at each price level SLB trades at in the coming weeks to see if there are clues from their past 1-2 years’ of price data for how the markets will react, particularly around key support levels.
The bold prices on the image below denote the moving average levels just listed & the bold entries in the list form of the analysis under the images include other levels of support.
Each corresponding price level using a ratio of Buyers:Sellers (or Sellers:Buyers), NULL values denote that there was not enough data, so the ratio would’ve been 0:0.
Ratios with a 0 for the denominator/constant are denoted with an *, but are reported as is, as we are accounting for volume/sentiment.
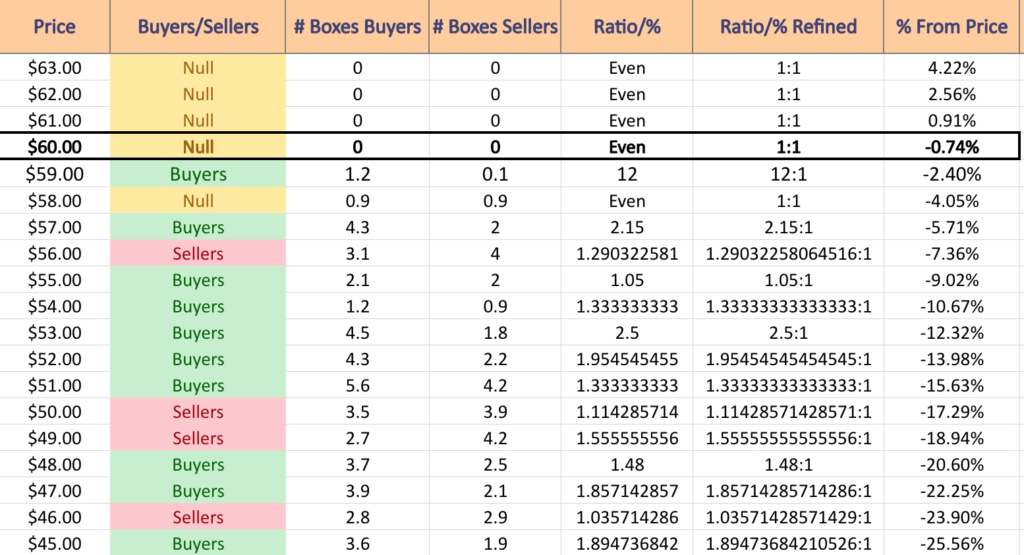
Schlumberger Ltd. SLB Stock’s Volume Sentiment At Each Price Level Over The Past 1-2 Years
$63 – NULL – 0:0*; +4.22% From Current Price
$62 – NULL – 0:0*; +2.56% From Current Price
$61 – NULL – 0:0*; +0.91% From Current Price
$60 – NULL – 0:0*; -0.74% From Current Price – Current Price Level & 10 Day Moving Average
$59 – Buyers – 12:1; -2.4% From Current Price
$58 – NULL – 0:0*; -4.05% From Current Price – 50 Day Moving Average
$57 – Buyers – 2.15:1; -5.71% From Current Price
$56 – Sellers – 1.29:1; -7.36% From Current Price
$55 – Buyers – 1.05:1; -9.02% From Current Price
$54 – Buyers – 1.33:1; -10.67% From Current Price
$53 – Buyers – 2.5:1; -12.32% From Current Price
$52 – Buyers – 1.95:1; -13.98% From Current Price – 200 Day Moving Average
$51 – Buyers – 1.33:1; -15.63% From Current Price
$50 – Sellers – 1.11:1; -17.29% From Current Price
$49 – Sellers – 1.56:1; -18.94% From Current Price
$48 – Buyers – 1.48:1; -20.6% From Current Price
$47 – Buyers – 1.86:1; -22.25% From Current Price
$46 – Sellers – 1.04:1; -23.9% From Current Price
$45 – Buyers – 1.89:1; -25.56% From Current Price
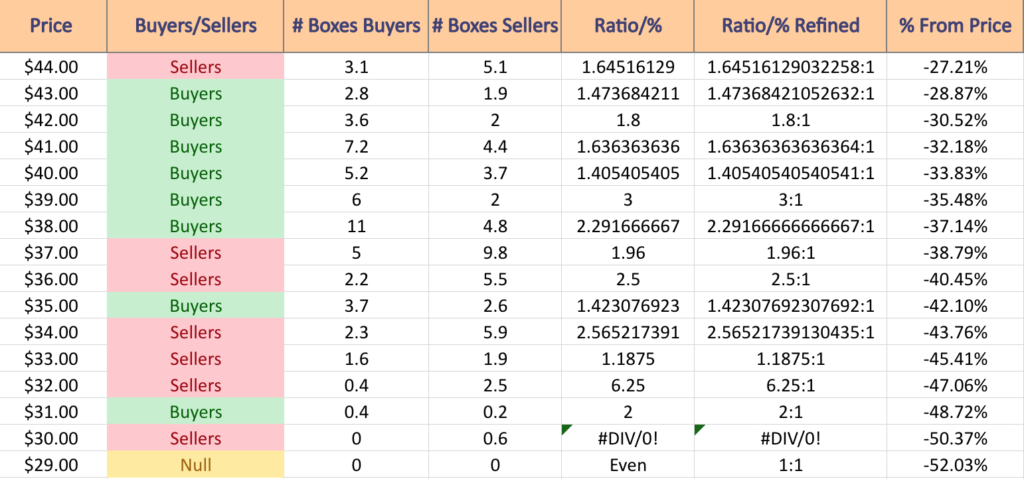
$44 – Sellers – 1.65:1; -27.21% From Current Price
$43 – Buyers – 1.47:1; -28.87% From Current Price
$42 – Buyers – 1.8:1; -30.52% From Current Price
$41 – Buyers – 1.64:1; -32.18% From Current Price
$40 – Buyers – 1.41:1; -33.83% From Current Price
$39 – Buyers – 3:1; -35.48% From Current Price
$38 – Buyers – 2.29:1; -37.14% From Current Price
$37 – Sellers – 1.96:1; -38.79% From Current Price
$36 – Sellers – 2.5:1; -40.45% From Current Price
$35 – Buyers – 1.42:1; -42.1% From Current Price
$34 – Sellers – 2.57:1; -43.76% From Current Price
$33 – Sellers – 1.19:1; -45.41% From Current Price
$32 – Sellers – 6.25:1; -47.06% From Current Price
$31 – Buyers – 2:1; 48.72% From Current Price
$30 – Sellers – 0.6:0*; -50.37% From Current Price
$29 – NULL – 0:0*; -52.03% From Current Price
Tying It All Together
The list & images above paint the picture as to how investors & traders have behaved at various price levels that SLB has been at over the past one-to-two years.
It is not meant to serve as investment/trading advice, and is simply a way to visualize what investor/trader sentiment has been like at each of the price levels mentioned, as well as what it was at levels of support & resistance that are denoted in the image & list.
As always, do your own due diligence before making investing/trading decisions.
For more on the methodology on how the data was collected & put together, please refer to our original Price:Volume analysis.
*** I DO NOT OWN SHARES OR OPTIONS CONTRACT POSITIONS IN SLB AT THE TIME OF PUBLISHING THIS ARTICLE ***