SPY, the SPDR S&P 500 ETF gained +1.13% over the past week, faring second best of the indexes, minus the NASDAQ.
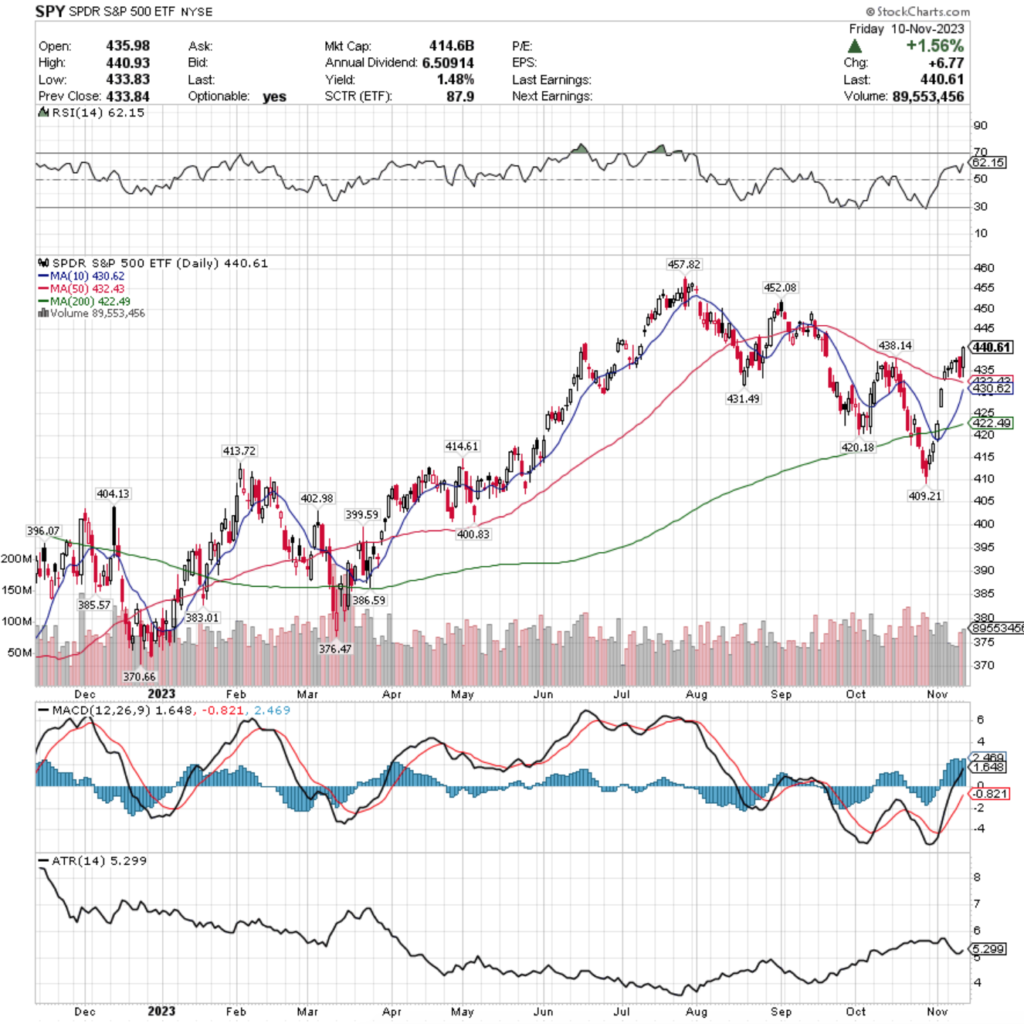
Their RSI is trending towards overbought territory & currently sits at 62.15, while their MACD is still bullish, but beginning to show signs of exhaustion & like it is ready to curl over bearishly in the coming days.
Volumes were -11.14% below average compared to the year prior (73,294,080 vs. 82,484,337), which is not a signal of strength, particularly when you break down the weak volume Monday-Wednesday before Thursday when participants took their chips off of the table.
The week kicked off with a dragonfly doji in line with the range that was set up by last Friday’s gap up session that held support above the 50 day moving average.
Volume declined on Tuesday’s light advance session, and declined further for Wednesday’s session, which resulted in another dragonfly doji, indicating uncertainty & some fear on the part of market participants.
Thursday the volume advanced notably on a bearish engulfing candle that eclipsed the entire week ‘s price ranges leading up to it, as investors were eager to take profits off the table to safety.
Friday’s session squeezed out a +1.56% advance, which could be a squeeze before a slew of Fed speakers take to the stages this week, as prices closed in a no-man’s land area where there is limited support & resistance compared to the price action that has taken place there over the past 4-5 months.
Their Average True Range is reverting back towards its mean after the Advance of Friday, but when the calculation period is taken into account & the days of the coming week are factored in & the old days are dropped from the range, there looks to be more near-term downside risk.
The gaps of last week have left some windows that do not have much support near them open which may accelerate declines.
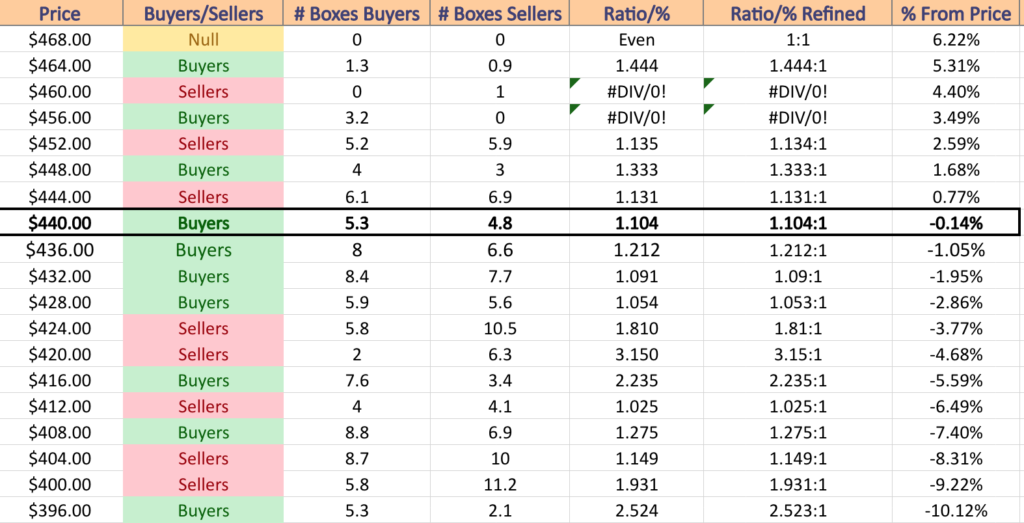
Something of note to keep an eye on too is the volume sentiment at their near-term support levels.
For the next ~3% there have been more buyers than sellers in the nearest support levels, however they weaken the further away from the current price that SPY falls, as shown in the table, before sellers take back over control at a clip of 1.81:1 after the price hits $427.99 & below.
The good news though is that after a -9.22% decline there will be some solid support once the $399.99/share level is reached, where Buyers have dominated the price zone 2.52:1 over the past 2-3 years.
SPY has support at the $438.14 (Volume Sentiment: Buyers, 1.21:1), $432.43 (50 Day Moving Average; Volume Sentiment: Buyers, 1.09:1), $431.49 (Volume Sentiment: Buyers, 1.05:1) & $430.62/share price level (10 Day Moving Average; Volume Sentiment: Buyers, 1.05:1), with resistance at the $452.08 (Volume Sentiment: Sellers, 1.13:1) & $457.82/share price levels (52-Week High; Volume Sentiment: Buyers, 3.2:0*).
QQQ, the Invesco QQQ Trust ETF advanced +2.49% over the past week, having the strongest performance of the major indexes.
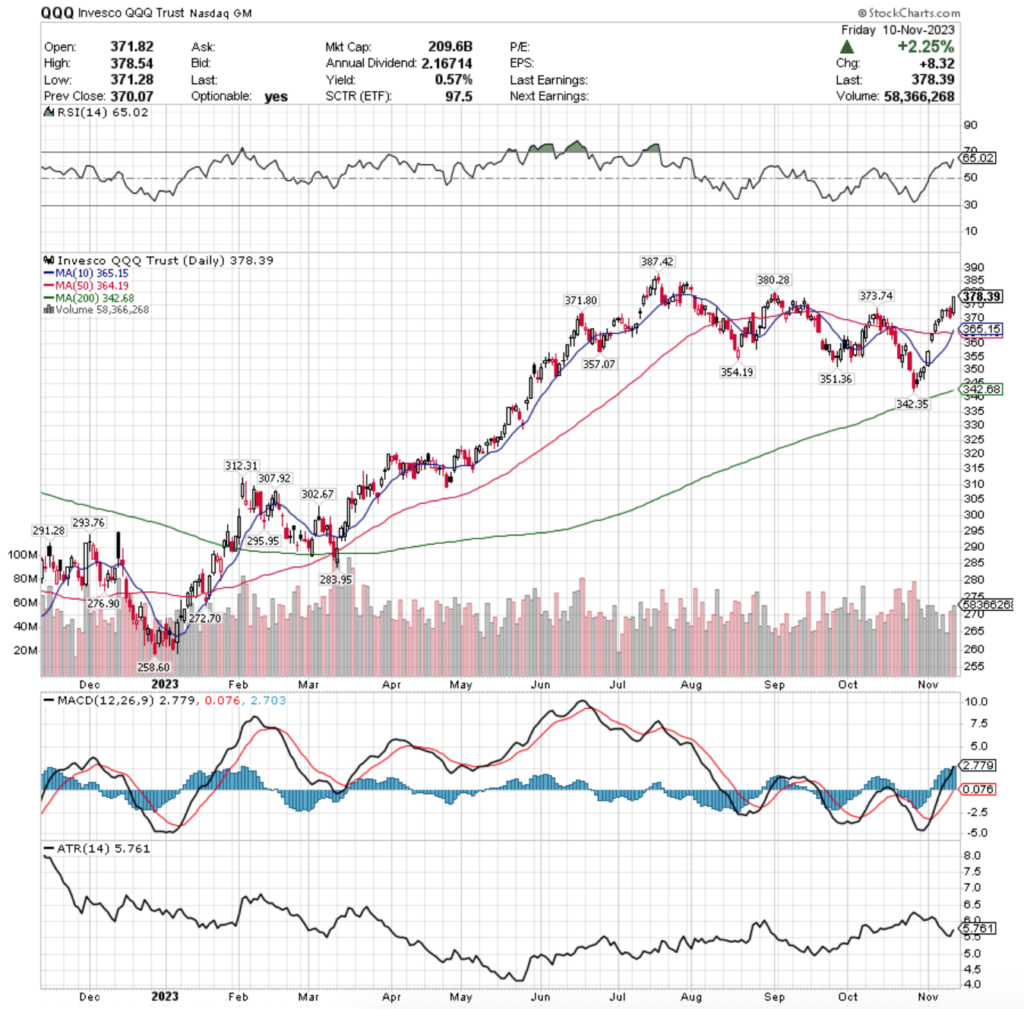
Their RSI is also trending towards overbought levels & sits at 65.02, with a MACD that is also signaling exhaustion & beginning to curl over bearishly, much like SPY.
Volumes were -10.83% below average compared to the year prior (47,491,740 vs. 53,261,799), which is troubling as Thursday’s declining volume was the second highest volume of the week, as money was taken off of the table following the rangebound trading of the earlier week.
Monday kicked the week off with a spinning top candlestick that was tightly tied to Friday’s candle, with the open occurring in Friday’s upper shadow, some of Friday’s real body being tested throughout the day, but ultimately prices closed higher.
Tuesday saw market participants rush in & push QQQ higher, but Wednesday’s dragonfly doji that fell within Tuesday’s daily range brought the uncertainty back to the fore.
Thursday resulted in a bearish engulfing candle, confirming that the first three bullish days of the week were on shaky grounds & uncertainty & Friday’s session saw advances, likely somewhat caused by the 10 & 50 DMA’s crossing bullishly, but the $380.28/share resistance level is going to be a more important test in the near-term.
Their ATR will be something to watch as the next week removes some of the lower, wider range sessions from the calculation & it will be imperative to factor in how the new sessions that replace them impact the calculation.
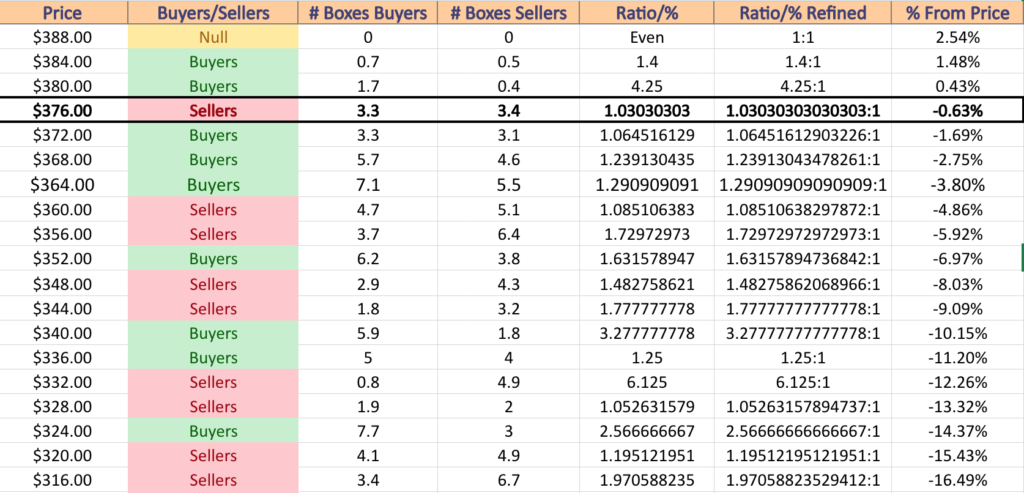
Unlike SPY, the strength of the supporting price levels within the next -3-4% leg lower do not get weaker in sentiment as we decline, however they’re not the stablest looking either & will be worth keeping a close look on, as 4 of the next 5 lower price zones are dominated by sellers & at more heavy ratios than the buyer dominated zones (except for the $360-363.99 zone).
There is a strong buyer sentiment ~9-10% below the current price though, where over the past 1-2 years Buyers have eclipsed sellers at a rate of 3.28:1.
QQQ has support at the $373.74 (Volume Sentiment: Buyers, 1.06:1), $371.80 (Volume Sentiment: Buyers, 1.24:1), $364.19 (50-Day Moving Average; Volume Sentiment: Buyers, 1.29:1) & $365.15/share price level (10 Day Moving Average; Volume Sentiment: Buyers, 1.29:1), with resistance at the $380.28 (Volume Sentiment: Buyers, 4.25:1) & $387.42/share price levels (52-Week High; Volume Sentiment: Buyers, 1.4:1).
IWM, the iShares Russell 2,000 ETF declined -1.86% over the past week, as investors fled small cap names in favor of larger cap stocks & the tech-heavy NASDAQ.
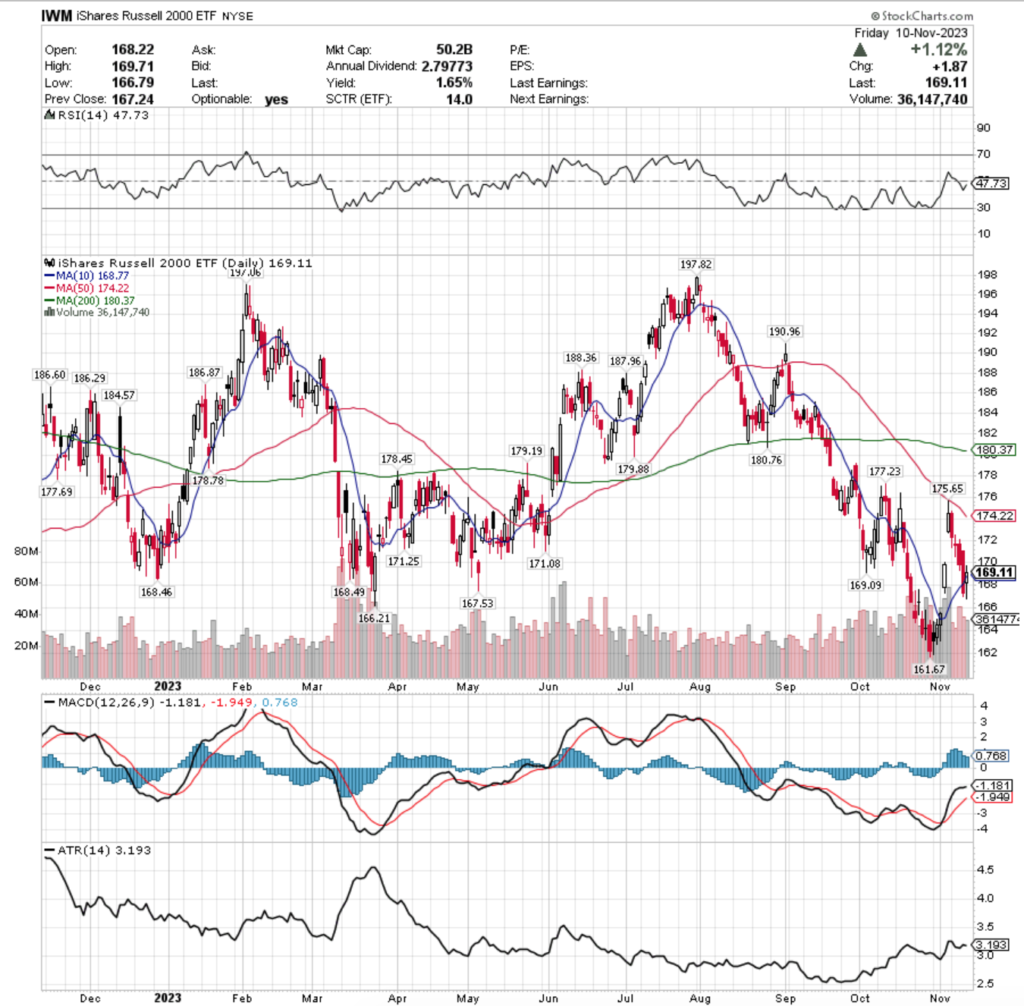
Their RSI is trending back towards neutral & currently sits at 47.73, while their MACD is looking flat (but still bullish, currently) & set to cross bearish any day now.
Volumes were +28% above average last week compared to the year prior (37,220,120 vs. 29,079,302), which is cause for concern given that the week had 4 declining sessions, two of which were higher volume than Friday’s advancing session.
After last Friday’s session was unable to break the resistance of the 50 day moving average, Monday continued the decline with a wide daily range session, followed by a doji on Tuesday that carried the declines further.
Despite the uncertainty of the doji, Wednesday continued lower to begin testing the $169.09 support level, which was broken on Thursday’s wide range day, but Friday’s session was able to bring the price level back above the $169.09 & 10 DMA support levels.
The volume for Friday was not convincing in terms of being indicative of a reversal in price though & the fact that most of the past few weeks’ highest advancing volumes occurred on gap days that left wide price windows with limited support around is cause for concern.
Their Average True Range is hinting that they may continue to slowly decline/consolidate in the near-term, as they try to break above the 10 DMA’s resistance level (currently it’s a support level, but would not remain one for long after a slight downwards move).
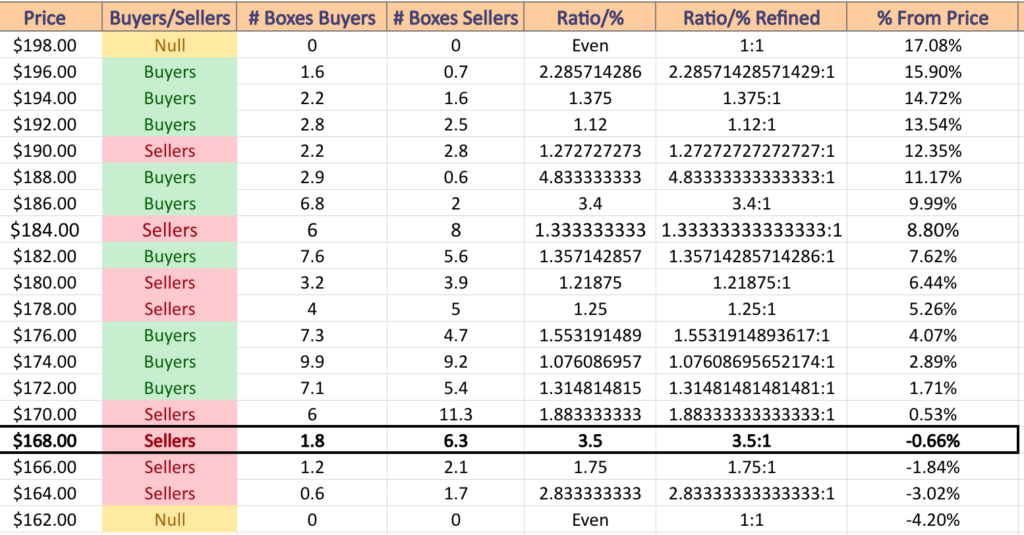
Their price:volume sentiment is also concerning, as while they are near their 52-week low & lack much support here (which will make the numbers appear more seller oriented), the two seller zones beneath the current price level contain some of the heaviest ratio’d levels on their past 1-2 year chart.
IWM has support at the $169.09 (Volume Sentiment: Sellers, 3.5:1), $168.77 (10 Day Moving Average; Volume Sentiment: Sellers, 3.5:1), $168.49 (Volume Sentiment: Sellers, 3.5:1) & $168.46/share price level (Volume Sentiment: Sellers, 3.5:1), with resistance at the $171.08 (Volume Sentiment: Sellers, 1.88:1), $171.25 (Volume Sentiment: Sellers, 1.88:1), $174.22 (50 Day Moving Average; Volume Sentiment: Buyers, 1.08:1) & $175.65/share price levels (Volume Sentiment: Buyers, 1.08:1).
DIA, the SPDR Dow Jones Industrial Average ETF added +0.58% over the past week, with only the Russell 2,000 faring worse for the week.
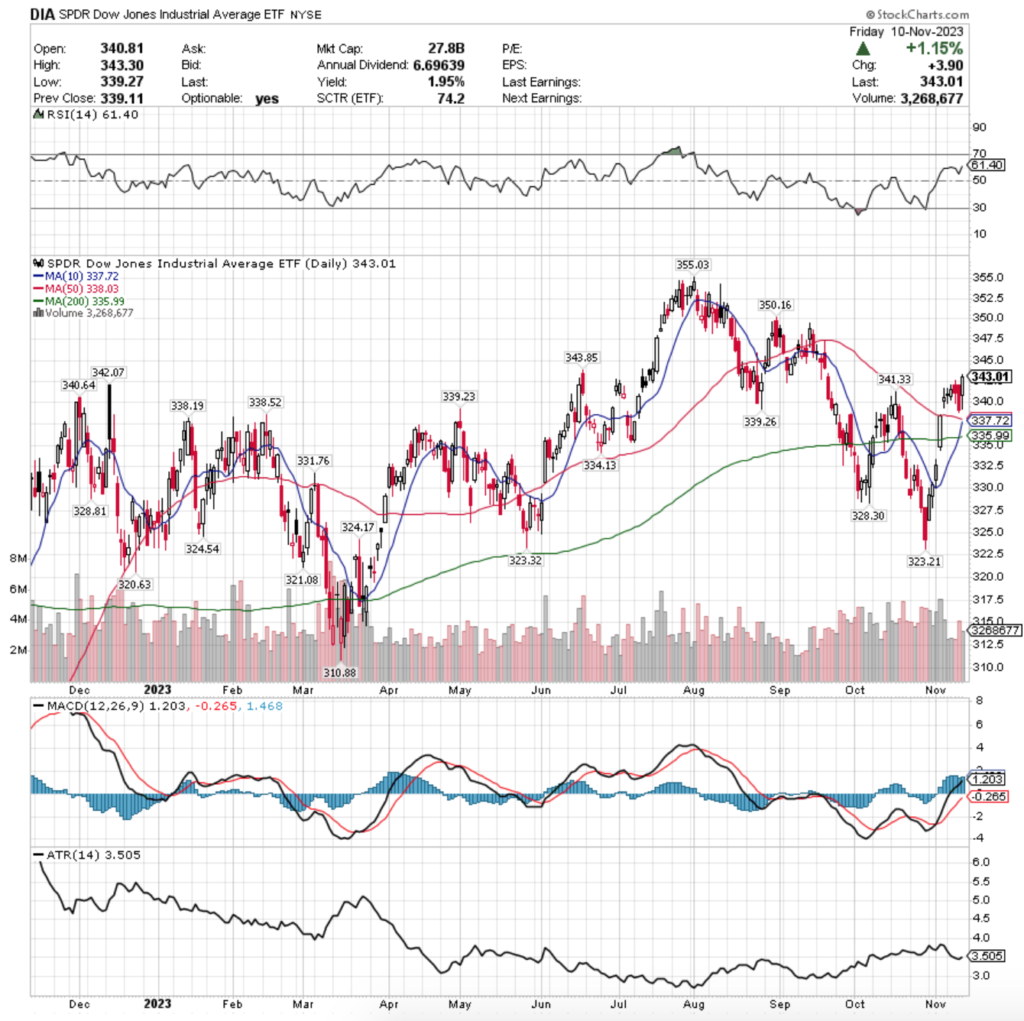
Their RSI is trending towards overbought levels & currently sits at 61.4, while their MACD is beginning to curl over bearishly & will be something to keep an eye on over the coming week.
Volumes declined -12.24% last week compared to the year prior’s average (3,111,380 vs. 3,545,435), signaling a lack of enthusiasm & that market participants are more eager to “wait & see” what happens next, rather than deploy capital.
Monday kicked the week off on an uncertain note, as the session resulted in a doji that inched higher above Friday’s previous close.
Tuesday we saw a further advance, but Wednesday’s declining session signaled trouble on the horizon & was followed by a wide range declining session Thursday, which was near the volume levels of Monday’s advancing session, which hints that the resilient DJIA may finally be losing its luster to market participants, despite having been a haven for many months.
Friday’s session added a new support level for this week, but looking at their ATR it appears that there may be some congestion around the price levels where their 10, 50 & 200 day moving averages sit currently in the event of a consolidation.
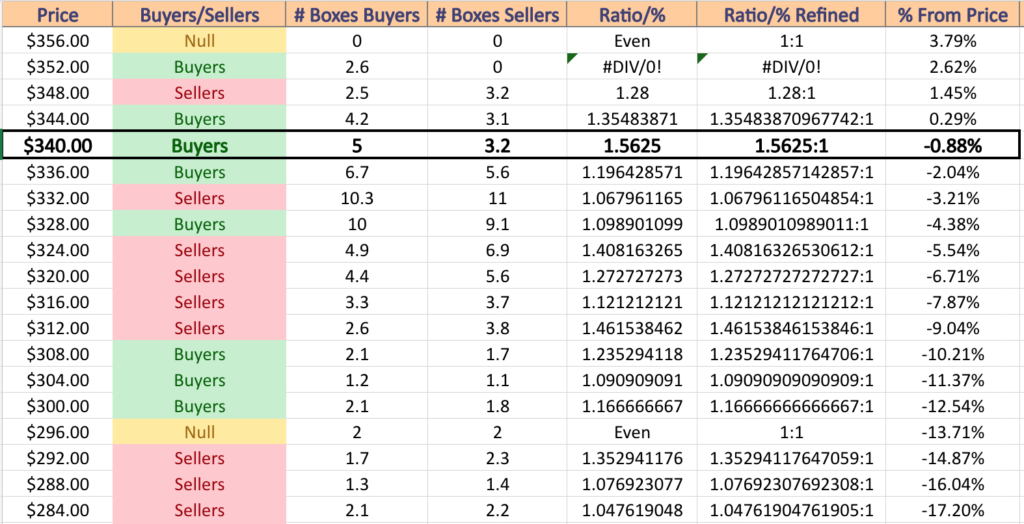
DIA’s price:volume sentiment from the past 3-4 years is another key area to be watching, particularly if they do begin to test the downside.
They currently have close by support levels in buyer dominated zones, however the sellers occupy 5 of the next 7 price zones, signaling that the rug may be easily pulled out from under DIA.
DIA has support at the $342.07 (Volume Sentiment: Buyers, 1.56:1), $341.33 (Volume Sentiment: Buyers, 1.56:1), $340.64 (Volume Sentiment: Buyers, 1.56:1) & $339.26/share price level (Volume Sentiment: Buyers, 1.2:1), with resistance at the $343.85 (Volume Sentiment: Buyers, 1.56:1), $350.16 (Volume Sentiment: Sellers, 1.28:1) & $355.03/share price levels (52-Week High; Volume Sentiment: Buyers, 2.6:0*).
Let’s dive into some of the best & worst performing industries & geo-locations in the market!
Japan Small Capped Equities (DXJS), S&P 500 Quality (SPHQ), Latin America 40 (ILF) & Brazil Small Caps (BRF) Are All Bullishly Leading The Market
DXJS, the WisdomTree Japan Hedged Small Cap Equity Fund ETF has advanced +37.34% over the past year, gaining +33.23% since their 52-week low in January of 2023 (ex-distributions).
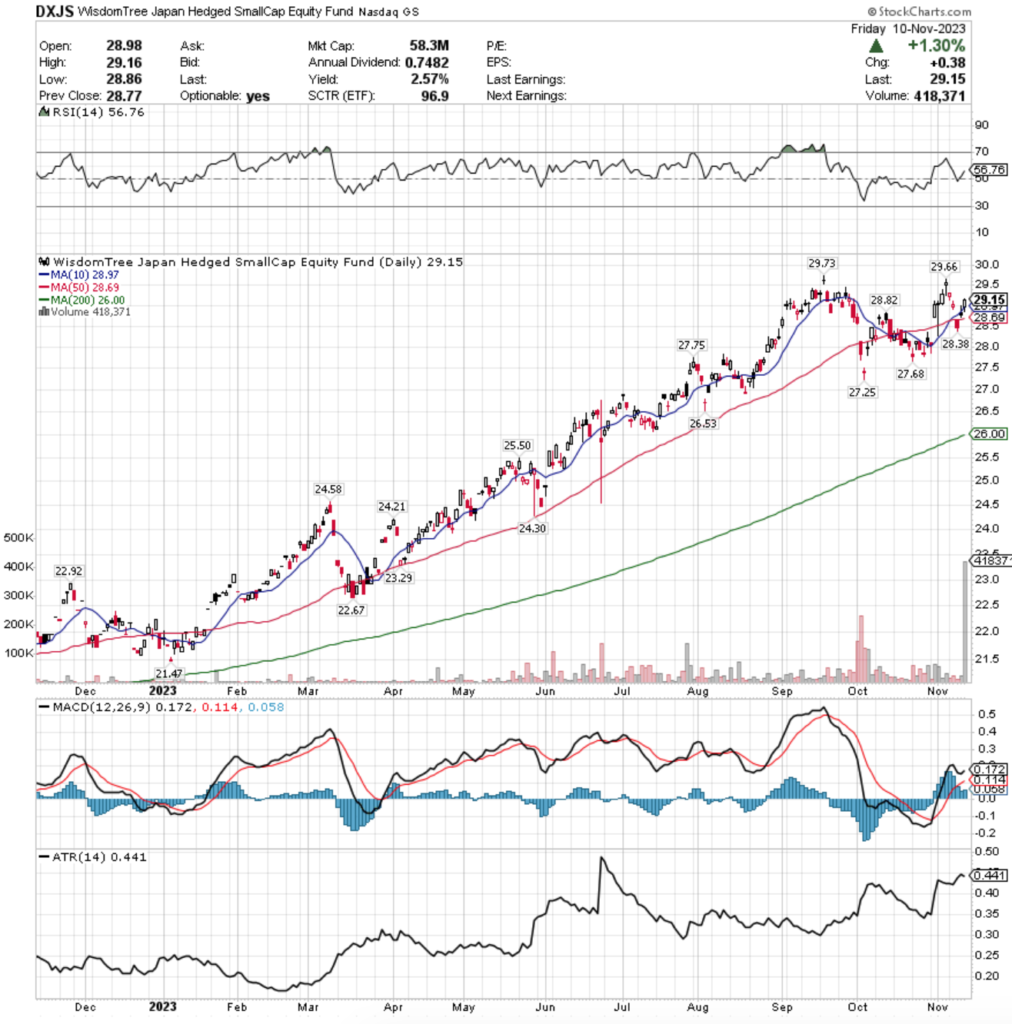
Their RSI is on the overbought end of the neutral range, sitting at 56.76, while their MACD remains bullish, but is beginning to flatten out & flash signals of a cool down period in the near-term, while prices remain just below their 52-week high.
Volumes were +396.24% above average last week compared to the year prior (97,540 vs. 19,655.78), almost entirely due to Friday’s session which eclipsed the volume levels of the previous year.
Monday kicked off with a declining hammer candle that continued lower on Tuesday, whose session resulted in a spinning top & a gap down, signaling uncertainty among market participants, with strong bearish sentiment in the air.
Wednesday is where things get particularly interesting though, as the day opened on a gap down that was not supported by the 10 & 50 day moving averages, tested lower, but resulted in a hammer candle on weak volume compared to the rest of the week, which indicates that the hammer signal may not be that strong.
Thursday’s spinning top advanced higher, however t remained contained by the 10 DMA’s resistance, and Friday’s session was able to break above the 10 DMA & close above it on strong volume, but I would be watching for profit taking in the coming few days.
While DXJS offers a 2.57% distribution yield for long-term holders, it would be wise to begin thinking of taking some profits or looking into a hedging strategy for existing positions, particularly as it appears less & less likely that they have the support from their moving averages to take another run at the 52-week high & their ATR suggests that a consolidation is on the horizon.
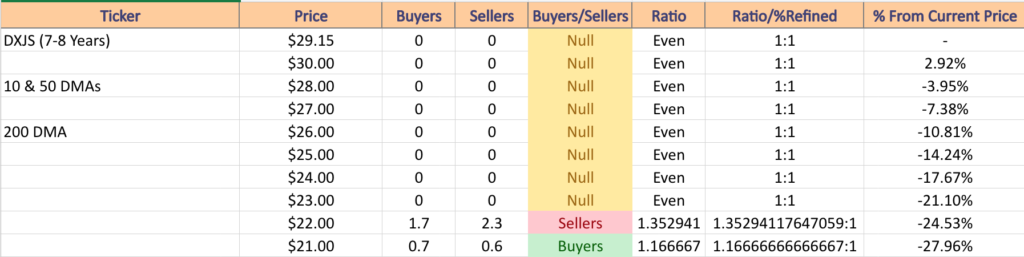
DXJS has support at the $28.97 (10 Day Moving Average; Volume Sentiment: NULL, 0:0*), $28.82 (Volume Sentiment: NULL, 0:0*), $28.69 (50 Day Moving Average; Volume Sentiment: NULL, 0:0*) & $28.38/share price level (Volume Sentiment: NULL, 0:0*), with resistance at the $29.66 (Volume Sentiment: NULL, 0:0*) & $29.73/share price levels (52-Week High;Volume Sentiment: NULL, 0:0*).
SPHQ, the Invesco S&P 500 Quality ETF has climbed +14.04% over the past year, adding +18.4% since their 52-week low in December of 2022 (ex-distributions).
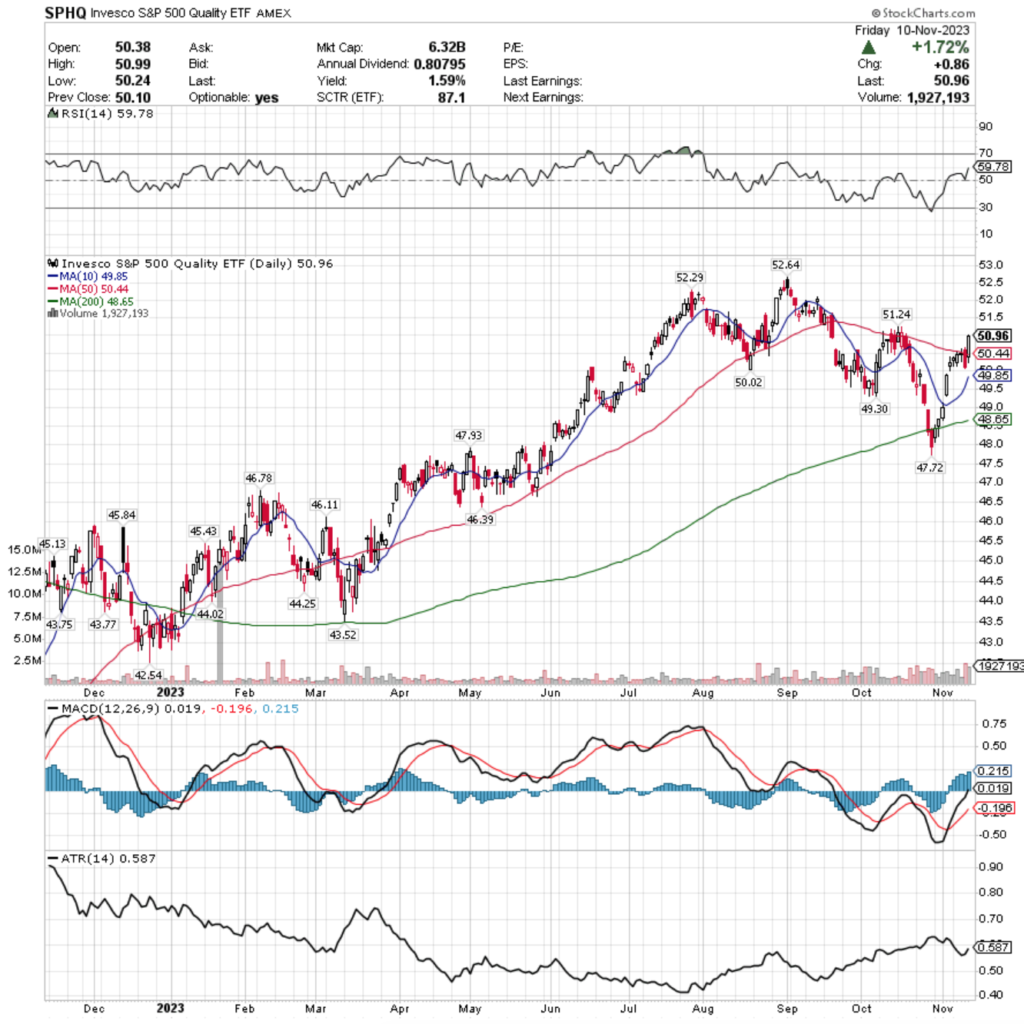
Their RSI is trending towards overbought & currently sits at 59.78, while their MACD remains bullish, but is beginning to look overextended & like it may be time for a near-term consolidation.
Volumes were +110.28% above average last week compared to the year prior (1,501,160 vs. 713,870.92), which is interesting as the highest volume session was on Thursday, a declining day where market participants were taking their profits & mitigating risk.
Monday kicked off with an slightly advancing day but signaled indecision based on the spinning top candlestick.
Tuesday there was a glimmer of hope with a bearish engulfing candlestick, but Wednesday’s doji session was unable to close above the 50 day moving average.
Thursday was a wide range declining session, which as noted above the day’s volume really reiterated the bearish sentiment as prices dipped below the 50 DMA.
Friday opened below the 50 DMA but broke resistance & climbed higher, but the bullish volume did not manage to come too close to the day prior’s declining volume, which is not a bullish signal.
Unfortunately, SPHQ only offers a 1.59% distribution yield to long-term holders, which does minimal against potential losses in terms of providing a cushion, making it worth examining hedging strategies in the near-term.
Prices appear to be ready to continue descending, unless we see the $51.24/share resistance level broken & upheld as a support level.
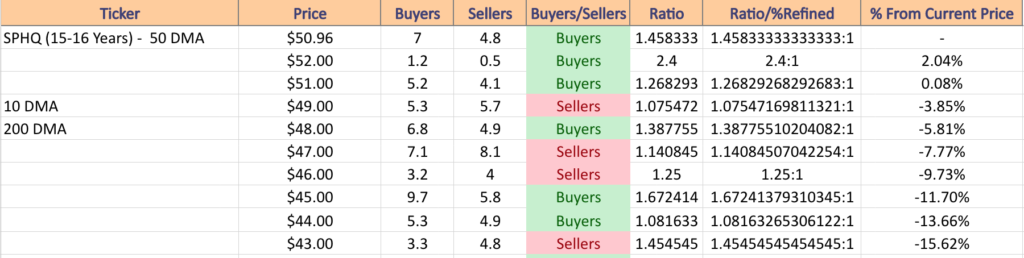
Sellers have a lot of power in the near-term support levels historically, which will be something to keep an eye on moving into this week.
SPHQ has support at the $50.44 (50-Day Moving Average; Volume Sentiment: Buyers, 1.46:1), $50.02 (Volume Sentiment: Buyers, 1.46:1), $49.85 (10 Day Moving Average; Volume Sentiment: Sellers, 1.08:1) & $49.30/share price level (Volume Sentiment: Sellers, 1.08:1), with resistance at the $51.24 (Volume Sentiment: Buyers, 1.27:1), $52.29 (Volume Sentiment: Buyers, 2.4:1) & $52.64/share price levels (52-Week High; Volume Sentiment: Buyers, 2.4:1).
ILF, the iShares Latin America 40 ETF has notched +15.2% over the past year, climbing +22.21% since their 52-week low in December of 2022 (ex-distributions).
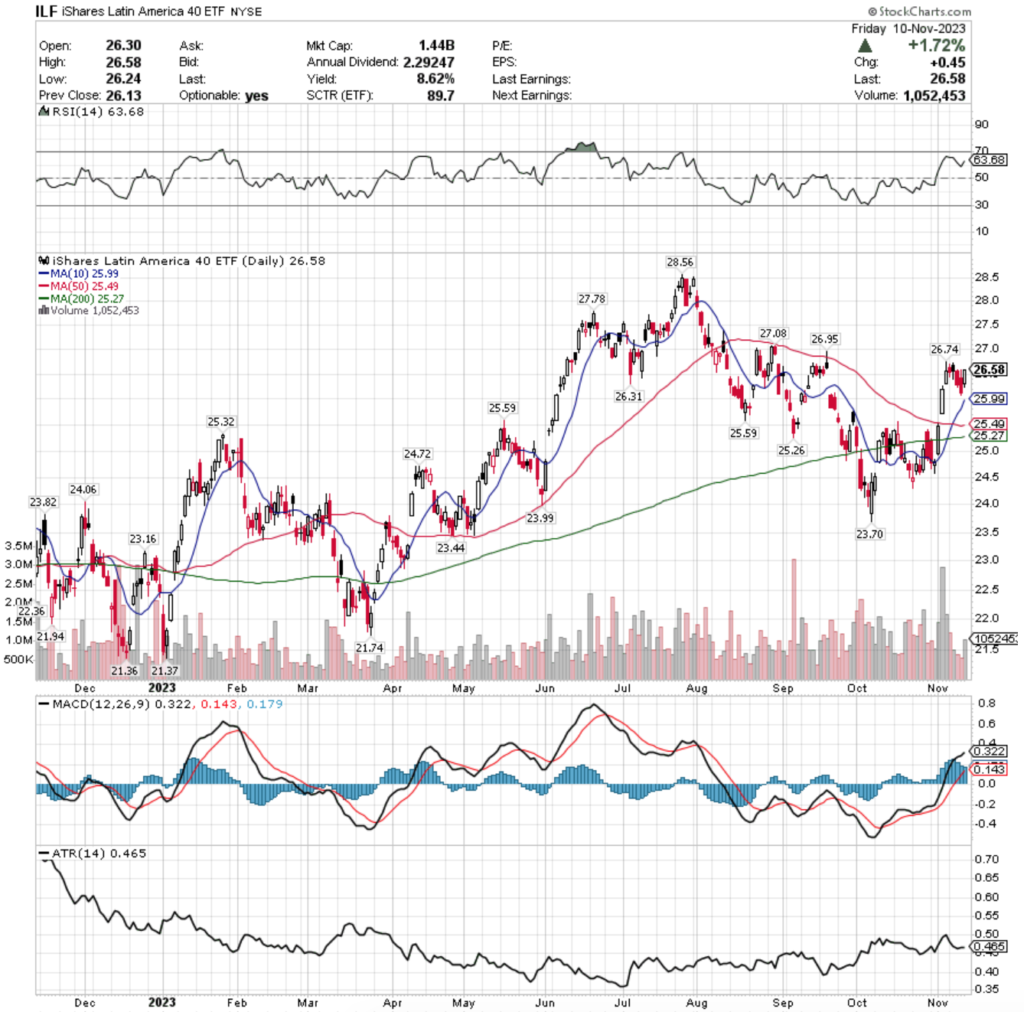
Their RSI is trending towards overbought at 63.68, while their MACD remains bullish but has begun to show significant loss of steam & looks ready for a bearish crossover in the near-term.
Volumes were -8.57% below average last week compared to the year prior (851,380 vs. 931,196.41), which was led by Monday’s declining volume being the highest day, which does not have bullish sentiment.
Monday’s session also resulted in a spinning top that closed just below Friday’s bullish close on a session that had a long upper shadow for the candle, which further confirms that there is bearish sentiment in the air now for ILF.
Tuesday tried to become bullish & did advance, but the day closed lower than it opened, setting the stage for Wednesday & Thursday’s declines, with Friday’s session advancing back up to the early-week price range.
Their ATR does not confirm much strength in the existing trend, and while they offer a hefty 8.62% distribution yield, it may be wise to begin thinking of hedging strategies & or taking some profits from existing positions.
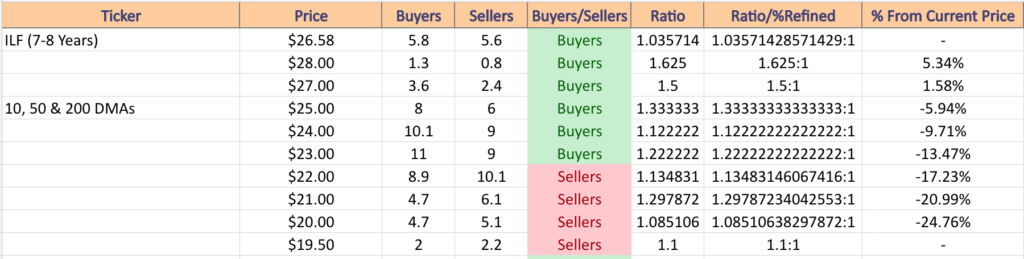
Their next support levels are all in buyer dominated price zones, however should they cool down 13% they enter 4 zones that are seller dominated.
ILF has support at the $26.31 (Volume Sentiment: Buyers, 1.04:1), $25.99 (10 Day Moving Average; Volume Sentiment: Buyers, 1.33:1), $25.59 (2 Touch-points; Volume Sentiment: Buyers, 1.33:1) & $25.49/share price level (50 Day Moving Average; Volume Sentiment: Buyers, 1.33:1), with resistance at the $26.74 (Volume Sentiment: Buyers, 1.04:1), $26.95 (Volume Sentiment: Buyers, 1.04:1), $27.08 (Volume Sentiment: Buyers, 1.5:1) & $27.78/share price levels (Volume Sentiment: Buyers, 1.5:1).
BRF, the VanEck Vectors Brazil Small-Cap ETF has advanced +13.29% over the past year, gaining +34.54% since their 52-week low in March of 2023 (ex-distributions).
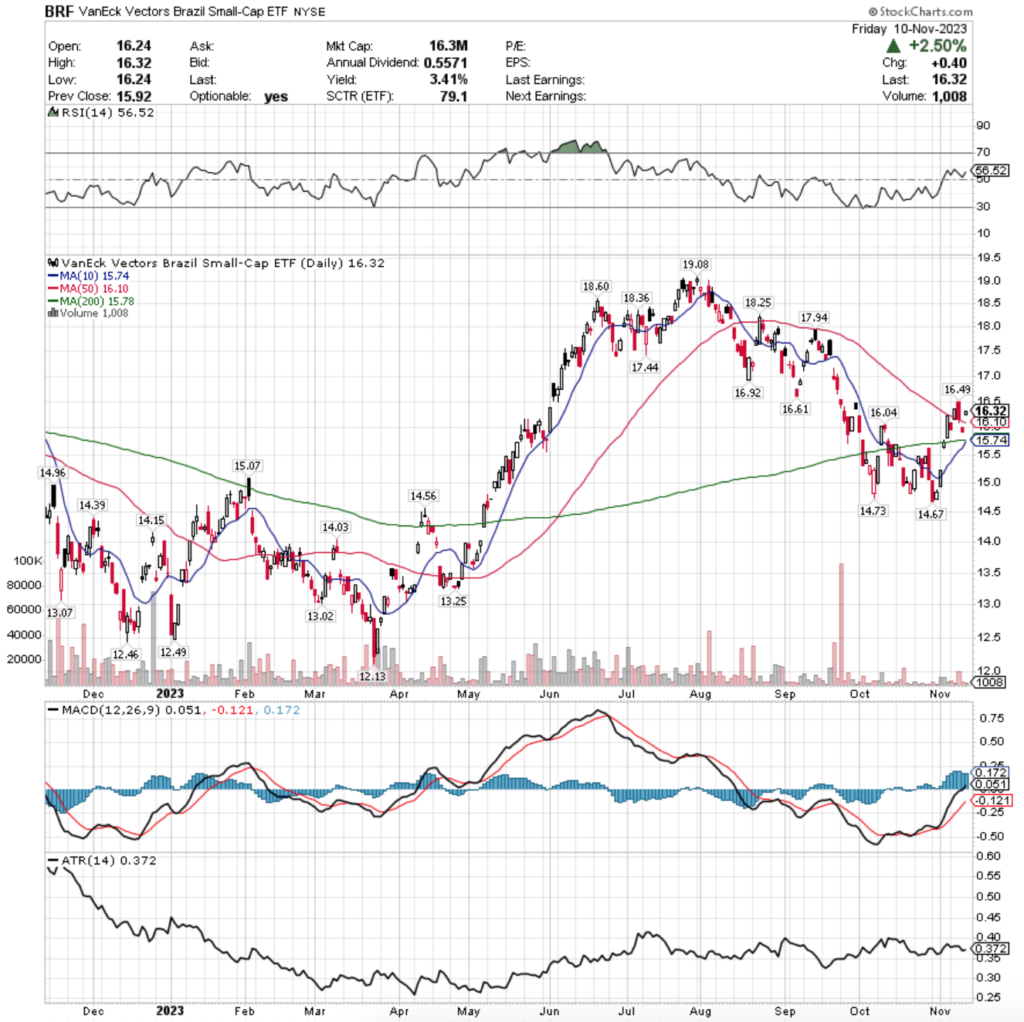
Their RSI is trending towards overbought at 56.52, but their MACD is beginning to curl over already & starting to signal that there may be a bearish crossover in the coming week.
Volumes were -57.31% below average last week compared to the year prior (4,780 vs. 11,196.41), as market participants were not exactly eager to move one way or the other last week, which is also not a signal of strength (even aside from the highest volume day being declining volume).
Their price action last week mostly just stuck to around the 50 DMA, with a handful of gaps that have created windows that have limited support around.
Despite their 3.41% distribution yield which may provide some cushion against losses, this is one to be keeping a close eye on in the coming weeks, as there does not appear to be much strength currently.
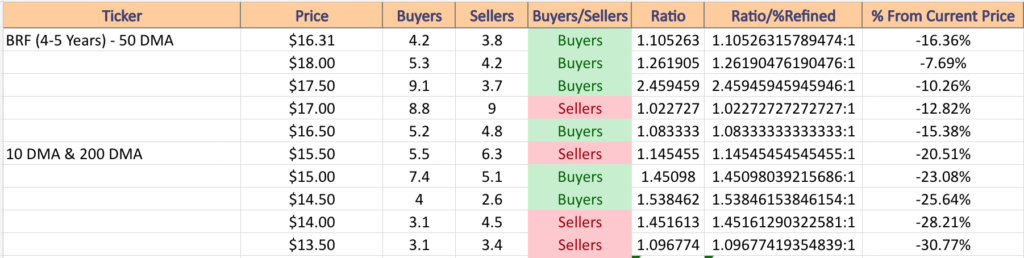
BRF has support at the $16.10 (50 Day Moving Average; Volume Sentiment: Buyers, 1.11:1), $16.04 (Volume Sentiment: Buyers, 1.11:1), $15.78 (200 Day Moving Average; Volume Sentiment: Sellers, 1.15:1) & $15.74/share price level (10 Day Moving Average; Volume Sentiment: Sellers, 1.15:1), with resistance at the $16.49 (Volume Sentiment: Buyers, 1.11:1), $16.61 (Volume Sentiment: Buyers, 1.08:1), $16.92 (Volume Sentiment: Buyers, 1.08:1) & $17.44/share price levels (Volume Sentiment: Sellers, 1.02:1).
Cannabis (THCX), Retail (RETL), Self-Driving EV & Tech (IDRV) & South Korea (KORU) Are All Bearishly Lagging The Market
THCX, the Cannabis ETF has declined -52.67% over the past year, falling -56.29% from their 52-week high in December of 2022, while reclaiming +5.02% from their 52-week low in October of 2023 (ex-distributions).
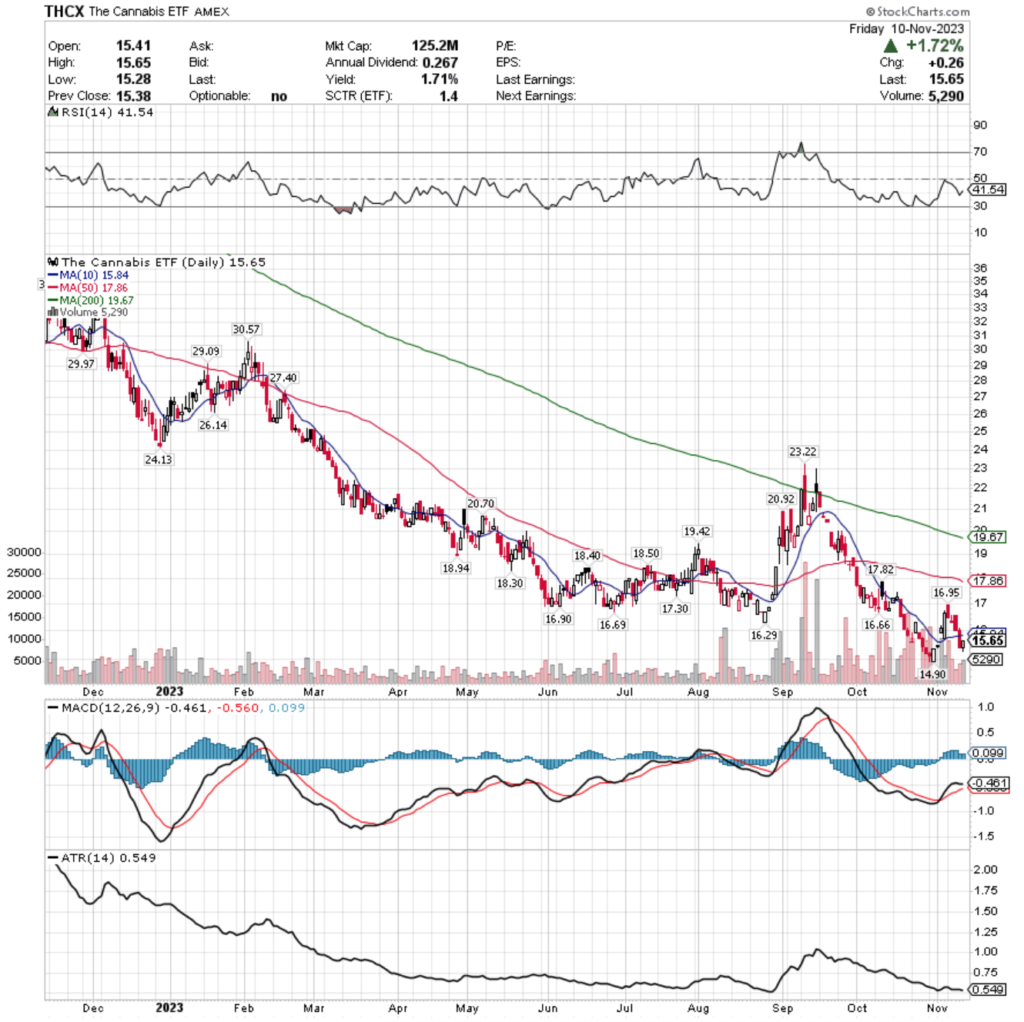
Their RSI is trending back towards neutral & currently sits at 41.54, while their MACD is about to bearishly crossover during the next session or two.
Volumes were +48.6% above average last week compared to the year prior (5,520 vs. 3,714.66), as market participants were eager to hop out of the pool with some money before they potentially retest their 52-week low in the coming weeks.
Investors would be wise to keep an eye on the 10 DMA & how it acts as resistance & pushes the price back towards the 52-week low, as there is limited support of any kind right now for THCX.
Once they are able to reverse course, it will be imperative to see how the 10 DMA functions as support, but that likely will not be for some time.
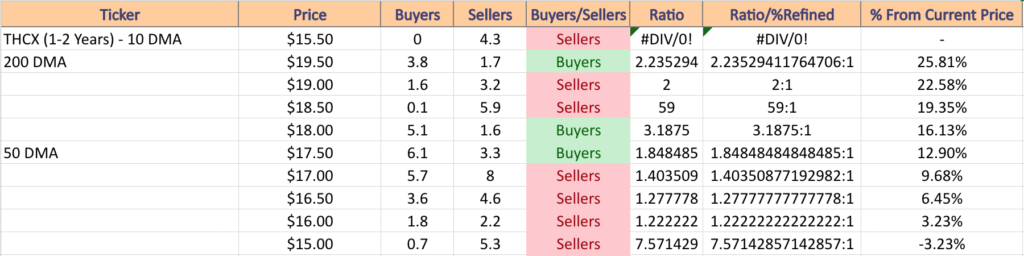
While they offer a 1.71% distribution yield, that isn’t enough cushion to take risks with something so close to their 52-week low & with limited enthusiasm at their last level of support.
THCX has support at the $14.90/share price level (52-Week Low; Volume Sentiment: NULL, 0:0*), with resistance at the $15.84 (10 Day Moving Average; Volume Sentiment: Sellers, 4.3:0*), $16.29 (Volume Sentiment: Sellers, 1.22:1), $16.66 (Volume Sentiment: Sellers, 1.28:1) & $16.69/share price levels (Volume Sentiment: Sellers, 1.28:1).
RETL, the Direxion Daily Retail Bull 3x Shares ETF has fallen -39.49% over the past year, losing -59.29% since their 52-week high in February of 2023, while reclaiming +11.18% since their 52-week low in November of 2023 (ex-distributions).
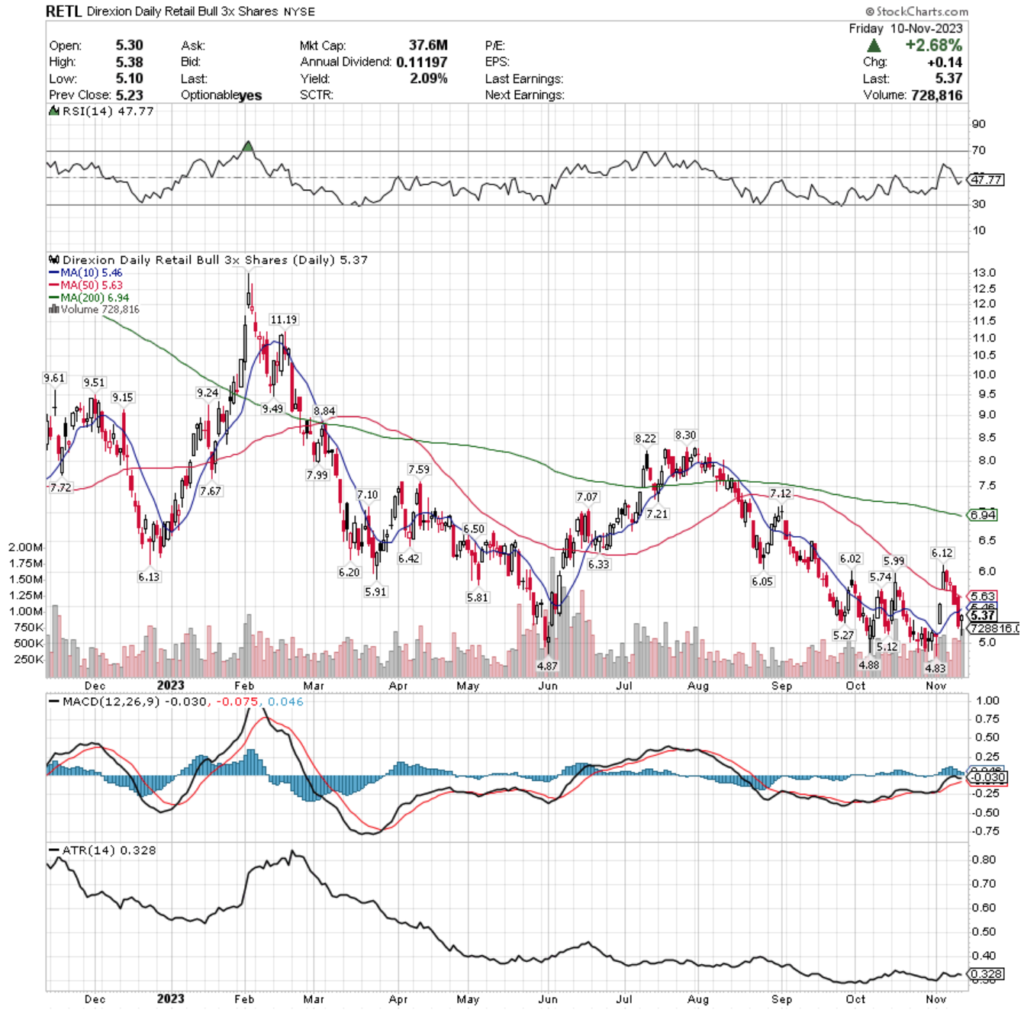
Their RSI is around neutral at 47.77, while their MACD is signaling a bearish crossover will take place by mid-week.
Volumes were +11.98% above average last week compared to the year prior (505,440 vs. 451,369.72), as after 4 days of profit taking, Friday’s session managed to close on decent advancing volume.
While it was advancing volume & the highest volume day of the week, it is not an invitation to turn bullish just yet.
Investors will need to keep an eye on how the 10 & 50 DMAs function as resistance in the coming week, while also noting how the window that Friday’s session’s lower shadow tested holds up or gets filled.
RETL does have some support in the consolidation zone below their current price that was established in September/October, but a cool off from November’s early pop days that resulted in gap ups appears near.
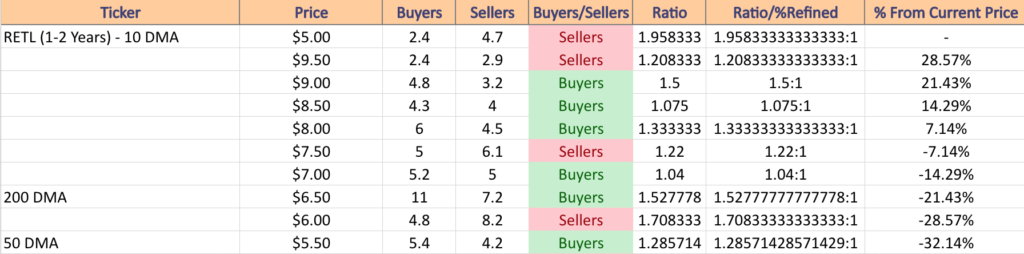
Being so close to the 52-week low & only offering a 2.09% distribution yield makes it risky to begin looking at RETL just yet & it would be wisest to wait & see how the floor beneath them holds up before experimenting with a new position, especially given that they’re in the lowest price zone with sentiment that favors Sellers 1.96:1 from the past 1-2 years.
RETL has support at the $5.27 (Volume Sentiment: Sellers, 1.96:1), $5.12 (Volume Sentiment: Sellers, 1.96:1), $4.88 (Volume Sentiment: NULL; 0:0*) & $4.87/share price level (Volume Sentiment: NULL; 0:0*), with resistance at the $5.46 (10 Day Moving Average; Volume Sentiment: Sellers, 1.96:1), $5.63 (50 Day Moving Average; Volume Sentiment: Sellers, 1.96:1), $5.74 (Volume Sentiment: Sellers, 1.96:1) & $5.81/share price levels (Volume Sentiment: Sellers, 1.96:1).
IDRV, the iShares Self-Driving EV & Tech ETF has lost -16.5% over the past year, declining -29.86% since their 52-week high in July of 2023, and has advanced +3.62% since their 52-week low in November of 2023 (ex-distributions).
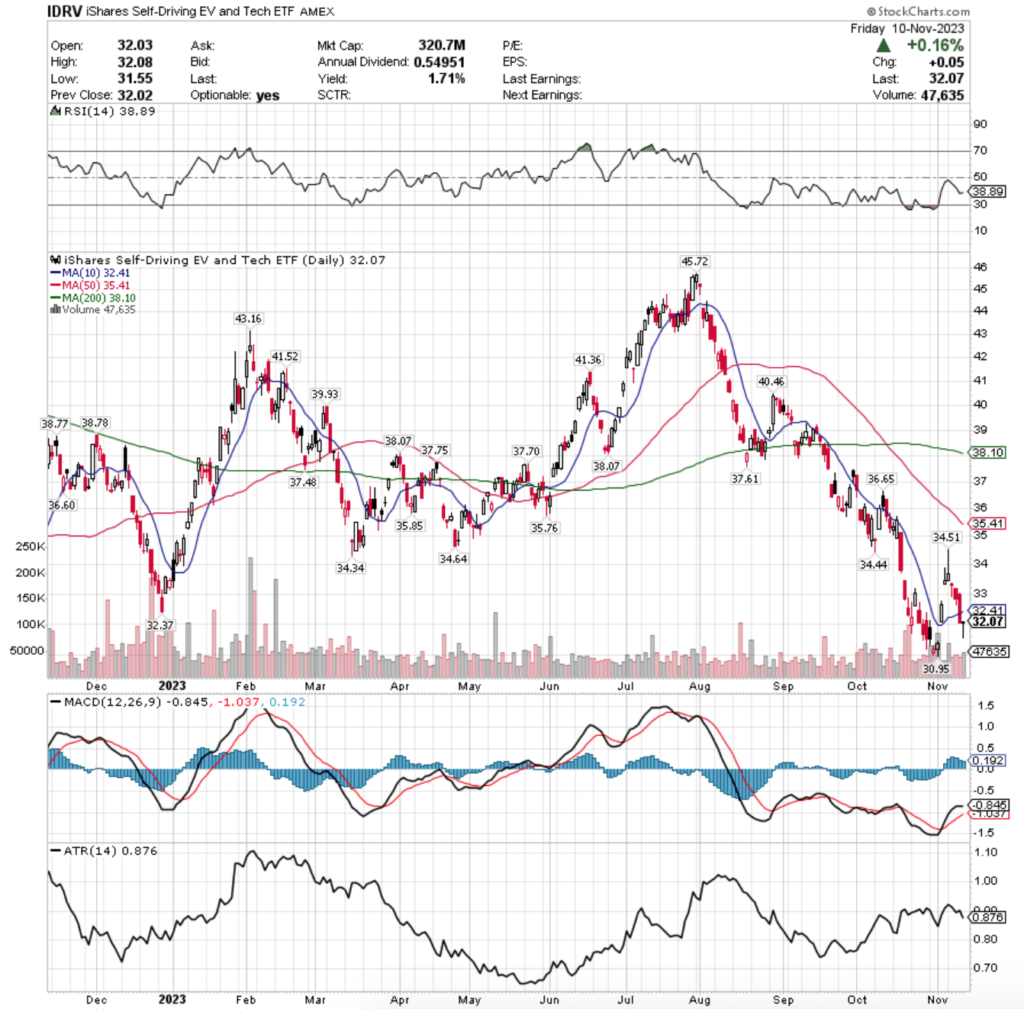
Their RSI is trending towards oversold & currently sits at 38.89, while their MACD is currently bullish, but flat, and will likely see a bearish crossover in the near-term, unless Friday’s dragonfly doji is able to actually spur a reversal.
Volumes last week were -0.29% below average compared to the year prior (47,000 vs. 47,134.66), showing that investors were indeed eager to take money off of the table following the gaps up of last Thursday & Friday’s sessions.
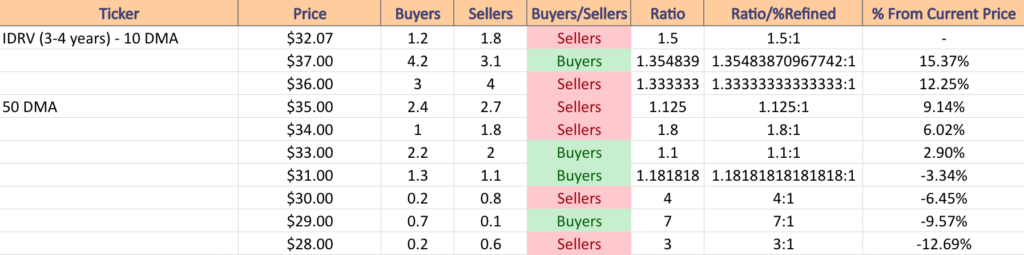
Given their proximity to their 52-week low & their modest 1.71% distribution yield, all eyes should be on the 10 DMA & their 52-week low as we enter the next few weeks before any positions are taken, especially given that this current price zone they are in is historically favoring the Sellers, 4:1.
While the $29-29.99 zone is heavily buyer favored (7:1), it would be wise to keep a close eye on your charts, as if that doesn’t hold up the next zone is dominated by sellers 3:1, which may signal a consolidation zone in the $29-29.99 range that appears down the line.
IDRV has support at the $30.95/share price level (52-Week Low; Volume Sentiment: Sellers, 4:1), with resistance at the $32.37 (Volume Sentiment: Sellers, 1.5:1), $32.41 (10 Day Moving Average; Volume Sentiment: Sellers, 1.4:1), $34.34 (Volume Sentiment: Sellers, 1.8:1) & $34.44/share price levels (Volume Sentiment: Sellers, 1.8:1).
KORU, the Direxion Daily South Korea Bull 3x Shares ETF has fallen -23.63% over the past year, declining -38.07% since their 52-week high in January of 2023, while gaining +32.4% since their 52-week low in October of 2023 (ex-distributions).
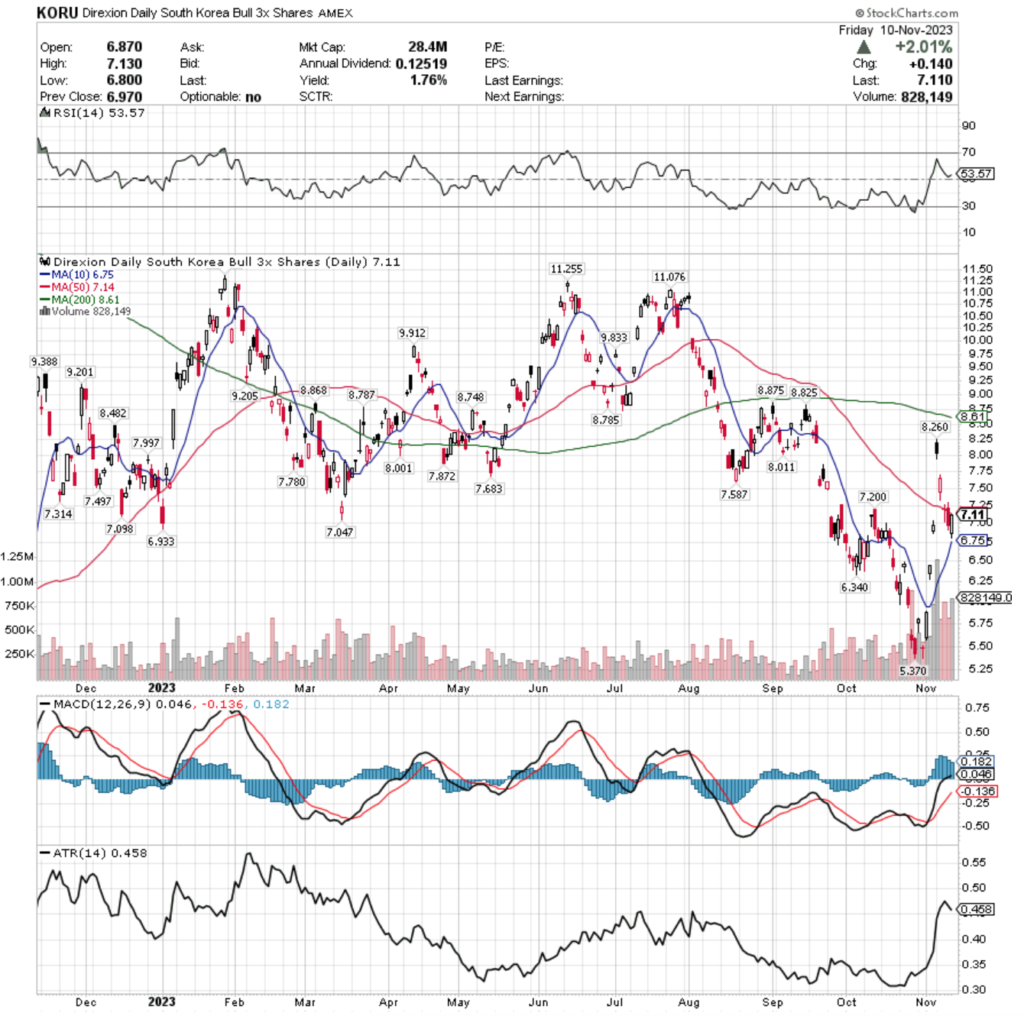
Their RSI is just above the neutral level of 50 & sits at 53.57, while their MACD looks set to bearishly crossover by the end of the week, unless they are able to consolidate further into the range that they tried to establish towards the end of last week.
Volumes were +214.49% above average last week vs. the year prior’s average (818,960 vs. 260,410.36), which should be viewed with caution, given that the highest volume day was Monday’s astronomical gap up session, which quickly deflated throughout the rest of the week.
Tuesday & Wednesday’s gap downs paired with the dragonfly doji of Wednesday signaled that there is still a lot of uncertainty in the air & the 50 day moving average has provided adequate strength as a resistance level recently.
Friday’s session tried to advance, however the 50 DMA turned it down, which will lead to an interesting week as the 10 DMA is moving towards the lower end of Friday’s candle to act as support.
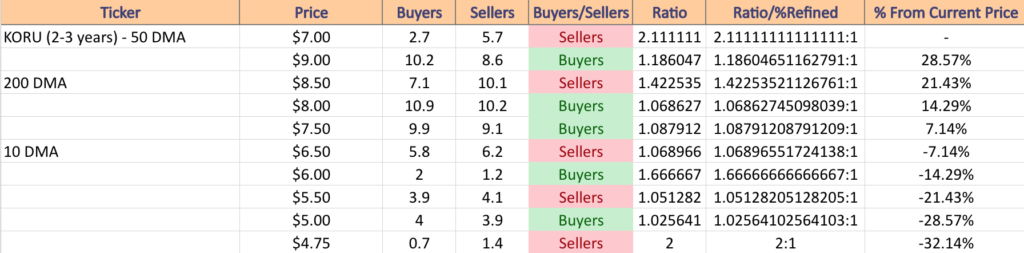
Their 1.76% distribution yield is not much cushion for entering a new position now, and volume sentiments should be watched closely as they interact with support & resistance levels in the coming week, as there could be more volatility in store.
KORU has support at the $7.09-7.10 (Volume Sentiment: Sellers, 2.11:1), $7.05 (Volume Sentiment: Sellers, 2.11:1), $6.93 (Volume Sentiment: Sellers, 1.07:1) & $6.75/share price level (10 Day Moving Average; Volume Sentiment: Sellers, 1.07:1), with resistance at the $7.14 (50 Day Moving Average; Volume Sentiment: Sellers, 2.11:1), $7.20 (Volume Sentiment: Sellers, 2.11:1), $7.31 (Volume Sentiment: Sellers, 2.11:1) & $7.50/share price levels (Volume Sentiment: Buyers, 1.09:1).
The Week Ahead
The week ahead kicks off with Fed Governor Lisa Cook speaking at 8:50 am, followed by Monthly U.S. Federal Budget data at 2 pm.
Monday’s earnings reports include AECOM, Fortrea, Genius Sports, Harrow, Henry Schein, Monday.com, The Beauty Health Company, Sun Life, Tower Semiconductor & Tyson Foods.
Tuesday gets busier, with New York Fed President John Williams speaking at 3 am, Fed Vice Chair Philip Jefferson speaking at 5:30 am, NFIB Optimism Index reported at 6 am, Consumer Price Index, Core CPI, CPI Year-Over-Year & Core CPI Year-Over-Year reported at 8:30 am, Fed Vice Chair For Supervision Michael Barr testifying to s Senate panel at 10 am & Chicago Fed President Austan Goolsbee speaking at 12:45 pm.
Home Depot, Alcon, Aramark, CAE, Canadian Solar, Energizer, HUYA, IHS Holding Limited, Oaktree Specialty Lending, On, Paysafe, Sally Beauty, Sea Ltd., Tencent Music, Varex Imaging, Vipshop & WalkMe are all due to report earnings on Tuesday.
8:30 am Wednesday is packed with data, including the Producer Price Index, Core PPI, PPI Y-o-Y, Core PPI Y-o-Y, U.S. Retail Sales, Retail Sales minus Autos & Empire State Manufacturing Survey data, followed by New York Fed President John Williams Speaking at 9:25 am, Business Inventories data released & Michael Barr testifying before a House panel at 10 am & Richmond Fed President Tom Barkin speaking at 3:30 pm.
Wednesday’s earnings calls feature Cisco Systems, Advance Auto Parts, Catalent, Cisco Systems, Copa Holdings, Endava, Hillenbrand, J&J Snack Foods, JD.com, Kulicke & Soffa, Palo Alto Networks, Sonos, Target, Tetra Tech & TJX.
Thursday kicks off with Fed Vice Chair for Supervision Michael Barr speaking at 7:10 am, Initial Jobless Claims, Import Price Index, Import Price Index Minus Fuel, Philadelphia Fed Manufacturing Survey data & Cleveland Fed President Loretta Mester speaking at 8:30 am, Industrial Production & Capacity Utilization reports at 9:15 am, NY Fed President John Williams speaking at 9:25 am, Home Builders Confidence Index data at 10 am, Fed Governor Waller speaking at 10:30, Michael Barr speaking again at 10:35 am & Fed Governor Lisa Cook speaking at 12pm.
Walmart, Alibaba Group Holding, Applied Materials, Bath & Body Works, Beazer Homes, Berry Global, Borr Drilling, Brady, BrightView, Dolby Labs, Dole, Gap, Macy’s, Post, Ross Stores, Shoe Carnival, Stratasys, UGI Corp, Warner Music Group & ZTO Express report earnings on Thursday.
Housing Starts & Building Permits data is released Friday at 8:30 am, followed by Boston Fed President Susan Collins speaking at 8:45 am, Michael Barr & Chicago Fed President Goolsbee speaking at 9:45 am & San Francisco Fed President Daly speaking at 10 am.
Friday we get earnings reports from BJ’s Wholesale, Buckle, Spectrum Brands & Twist Bioscience.
See you back here next week!
*** I DO NOT OWN SHARES OR OPTIONS CONTRACT POSITIONS IN SPY, QQQ, IWM, DIA, DXJS, SPHQ, ILF, BRF, THCX, RETL, IDRV or KORU AT THE TIME OF PUBLISHING THIS ARTICLE ***