Last week indexes all began to show weakness, as volumes told the tale that investors & market participants are beginning to become fearful & head towards the exits.
At times like these it is important to have an understanding of how market participants have behaved at similar price levels in recent history, as we have posted on here before in prior price:volume sentiment analyses.
This document will provide a brief overview of current technical conditions for the S&P 500 (SPY), NASDAQ (QQQ), Russell 2000 (IWM) & Dow Jones Industrial Average (DIA), and provide a list of their historic volume sentiments at each price level that they’ve traded at in the past few years.
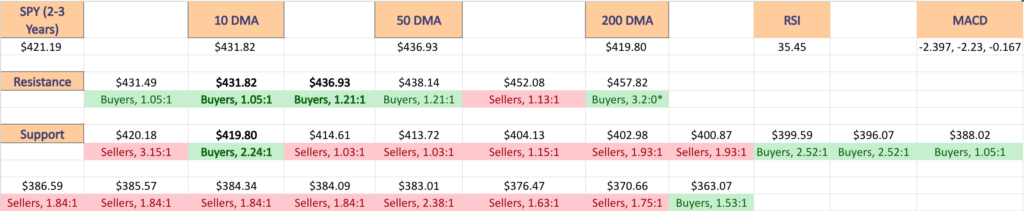
The first image of the price:volume sentiment images will contain their support & resistance levels over the past year & how the price:volume sentiment stands at each, followed by a broader list of price levels & their respective sentiments.
Below those items will also be a text version of the list, where the moving averages & current price levels will be annotated, and any support/resistance levels will be in BOLD text.
This will be in place of my usual weekend post.
Technical Analysis & Price:Volume Sentiment For SPY (S&P 500)
SPY, the SPDR S&P 500 ETF, declined -2.39% over the past week, as the cracks we’ve been seeing over the past couple of months finally began to give way & are set to retest the $420.18/share support set in early October.
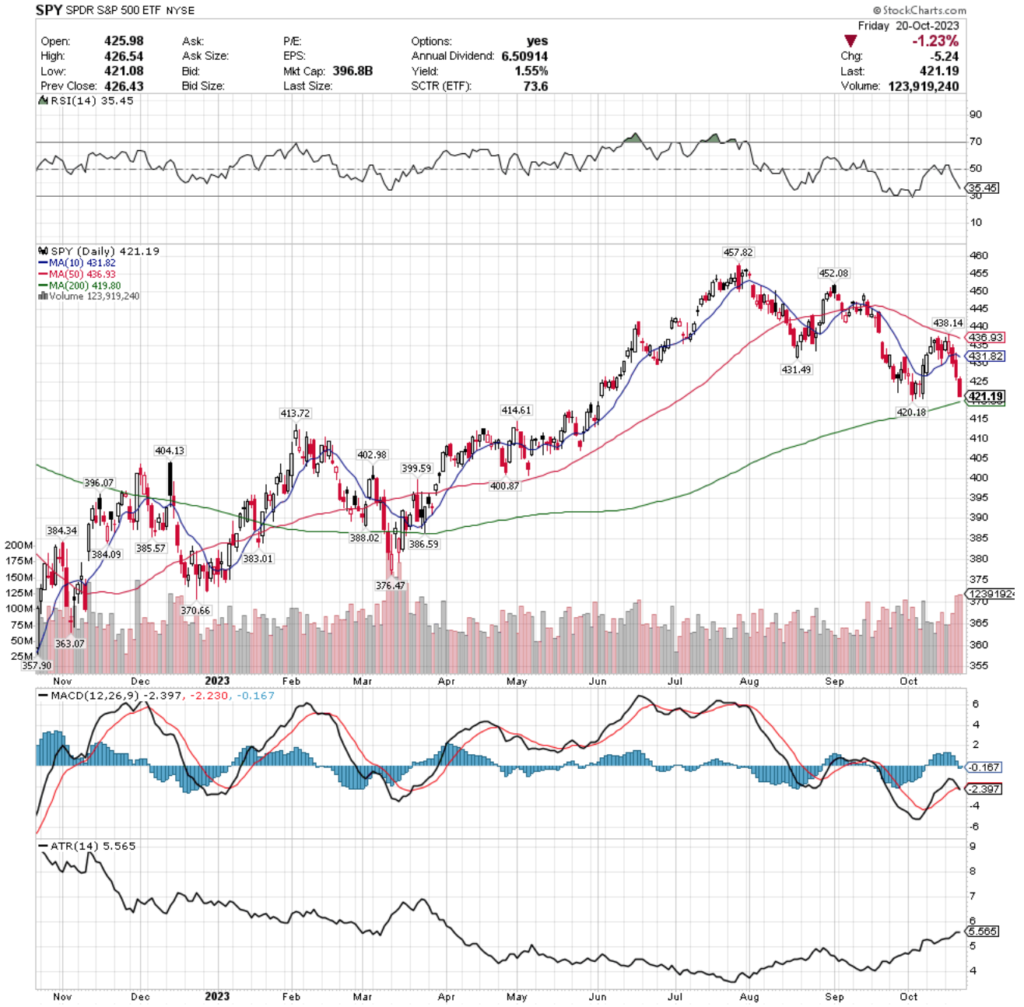
Their RSI is currently bounding towards the oversold mark of 30 & sits at 35.45, while their MACD has just bearishly crossed over, signaling more near-term declines are on the horizon.
Most alarming for SPY was that their volume last week was +17.33% above average compared to the year prior (97,438,267 vs. 83,046,224), as bearish sentiment has begun to take over just as the share price tests the support of the 200 Day Moving Average.
Monday the week kicked off on a slightly bullish note, however the session’s high was nowhere near testing the resistance of the 50 day moving average & the volume was very weak, which is troubling for the only bullish day on a very bearish week.
Tuesday resulted in a decline that did test the 50 DMA, but that ultimately also tested the support of the 10 day moving average & the candles real body wound up being wedged between the two moving averages, again on similarly light volume to Monday, which was a bad omen.
Wednesday we got the confirmation that things had taken a turn for the worst, with a bearish session that neither tested the 50 DMA again, nor that could stay above the 10 DMA’s support level, as the 10 DMA ended up being halfway through the wide-range candle’s real body by the close.
Thursday briefly attempted to test the 10 DMA’s resistance, but the open & closing price action on the candle tell the whole story, market participants were not interested in price levels being that high, which lead to Friday’s bearish session that closed hovering just above the 200 DMA’s support.
SPY’s Average True Range signals that there will be more volatility in the near-term, with a slight chance of a brief consolidation for a day or two this week, only if the 200 DMA support level holds up.
If it fails to, it will be imperative to understand how prior trading took place at each price level, so that market participants can gauge what sentiment may be like at the support levels it tests in the coming weeks.
SPY’s $416/share block is currently Buyer dominated over the past 2-3 years 2.24:1, but there is plenty of seller sentiment mixed into the price blocks down -8.83% from their current share price, before it becomes a steep slope of sellers until a ~13-14% decline from their current price has occurred.
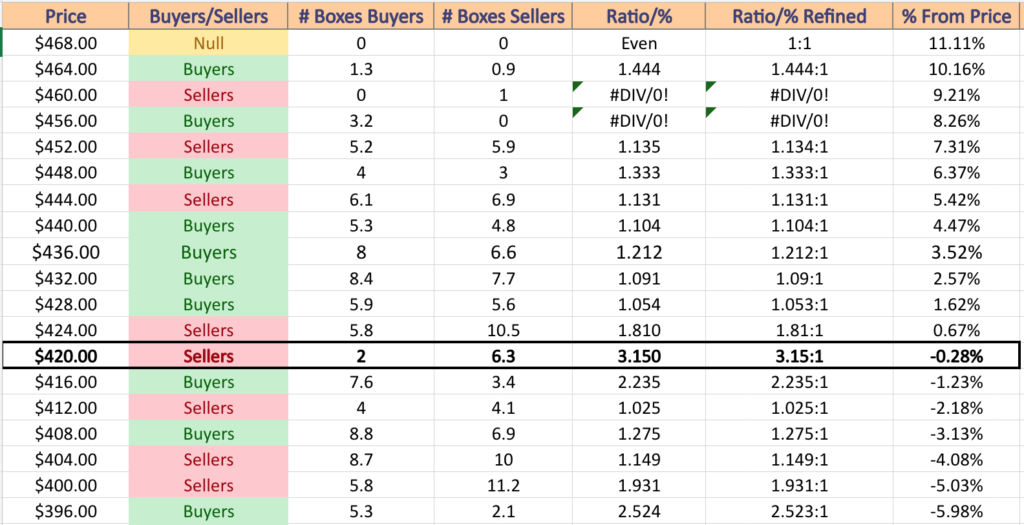
SPY ETF’s Price:Volume Sentiment Over The Past 2-3 Years
$468 – NULL – 0:0*; +11.11% From Current Price Level
$464 – Buyers – 1.44:1; +10.16% From Current Price Level
$460 – Sellers – 1:0*; +9.21% From Current Price Level
$456 – Buyers – 3.2:0*; +8.26% From Current Price Level
$452 – Sellers – 1.13:1; +7.31% From Current Price Level
$448 – Buyers – 1.33:1; +6.37% From Current Price Level
$444 – Sellers – 1.13:1; +5.42% From Current Price Level
$440 – Buyers – 1.10:1; +4.47% From Current Price Level
$436 – Buyers – 1.21:1; +3.52% From Current Price Level
$432 – Buyers – 1.09:1; +2.57% From Current Price Level
$428 – Buyers – 1.05:1; +1.62% From Current Price Level – 10 & 50 Day Moving Averages**
$424 – Sellers – 1.81:1; +0.67% From Current Price Level
$420 – Sellers – 3.15:1; -0.28% From Current Price Level; Current Price Block*
$416 – Buyers – 2.24:1; -1.23% From Current Price Level – 200 Day Moving Average*
$412 – Sellers – 1.03:1; -2.18% From Current Price Level
$408 – Buyers – 1.28:1; -3.13% From Current Price Level
$404 – Sellers – 1.15:1; -4.08% From Current Price Level
$400 – Sellers – 1.93:1; -5.03% From Current Price Level
$396 – Buyers – 2.52:1; -5.98% From Current Price Level
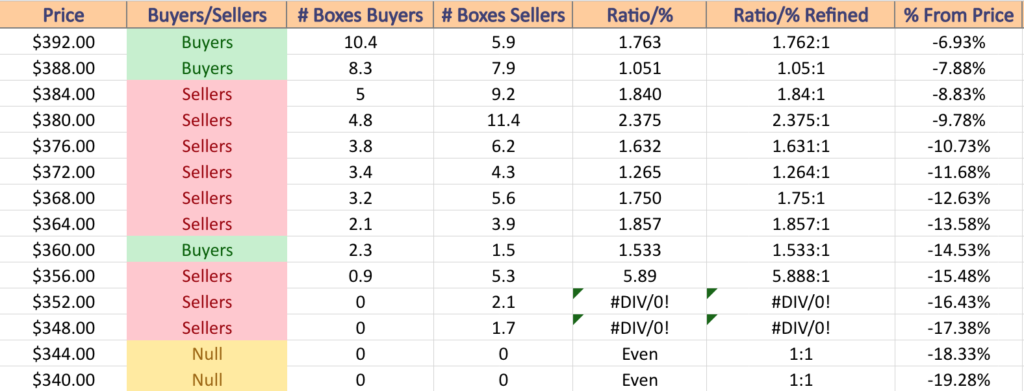
$392 – Buyers – 1.76:1; -6.93% From Current Price Level
$388 – Buyers – 1.05:1; -7.88% From Current Price Level
$384 – Sellers – 1.84:1; -8.83% From Current Price Level
$380 – Sellers – 2.38:1; -9.78% From Current Price Level
$376 – Sellers – 1.63:1; -10.73% From Current Price Level
$372 – Sellers – 1.26:1; -11.68% From Current Price Level
$368 – Sellers – 1.75:1; -12.63% From Current Price Level
$364 – Sellers – 1.86:1; -13.58% From Current Price Level
$360 – Buyers – 1.53:1; -14.53% From Current Price Level
$356 – Sellers – 5.89:1; -15.48% From Current Price Level
$352 – Sellers – 2.1:0*; -16.43% From Current Price Level
$348 – Sellers – 1.7:0*; -17.38% From Current Price Level
$344 – NULL – 0:0*; -18.33% From Current Price Level
$340 – NULL – 0:0*; -19.28% From Current Price Level
Technical Analysis & Price:Volume Sentiment For QQQ (NASDAQ)
QQQ, the Invesco QQQ Trust ETF fell -2.92% last week, taking the largest hit of the major indexes.
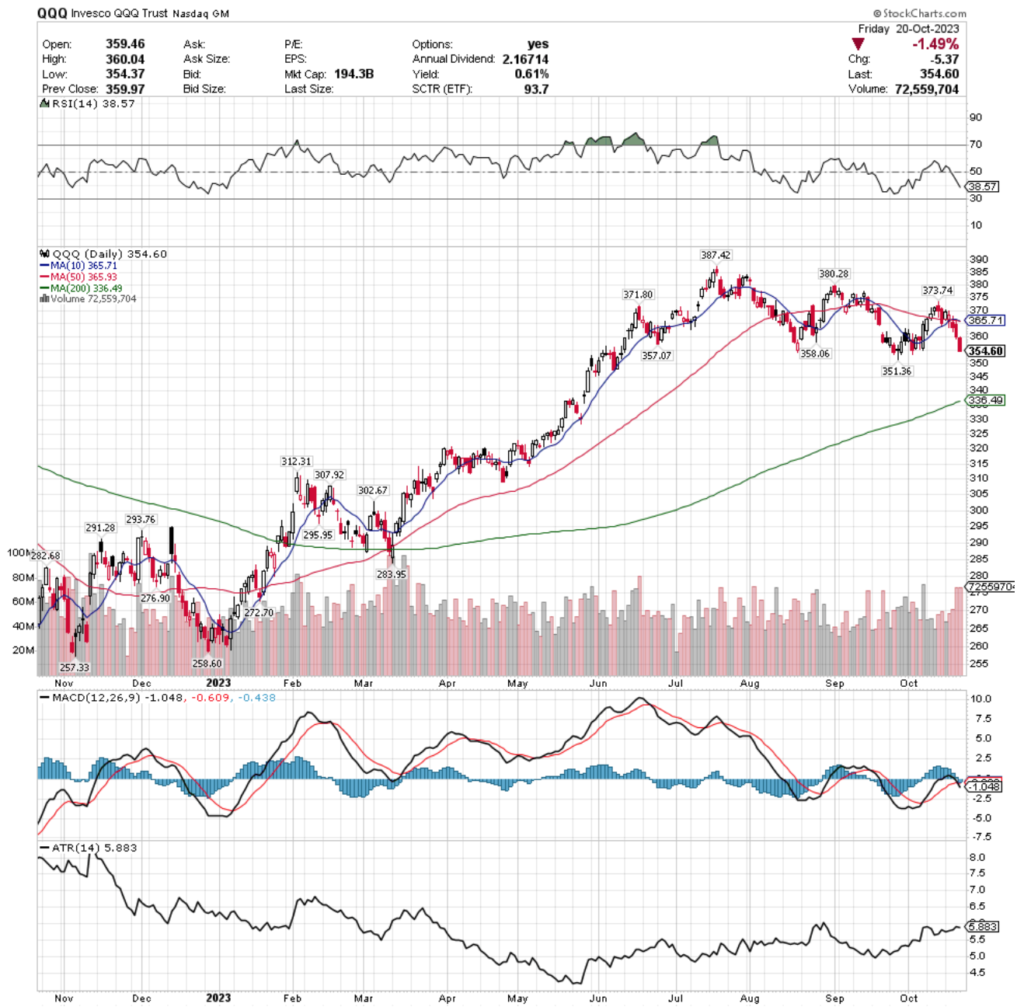
Their RSI is aggressively moving towards the oversold mark at 30 & sits currently at 38.57, while their MACD has recently crossed over bearishly & is currently in freefall.
Volumes were +7.26% higher than average last week compared to the year prior (57,765,767 vs. 53,856,939), but Thursday & Friday’s near matching bearish volumes are a cause for concern, given that they were the highest volume sessions of the week.
Friday at such a level would be expected, as it would be a risk-off move going into the weekend, but the fact that Thursday’s volumes were near-identical signals that there is more than just a little fear out in the markets & indicative of more risk-off behavior in the near-future.
Much like SPY, QQQ kicked off the week on a bullish note, opening at the 50 day moving average’s support & closing up on the day, before Tuesday’s declining day which showed a hint of optimism, opening at the same support level, joined by the 10 DMA for support & closing slightly above their open, despite declining overall.
However, Wednesday’s session opened beneath the 10 & 50 DMA’s resistance levels, and while they briefly broke above it mid-day, prices focused on the lower range of the day’s prices & tested even below their close, foreshadowing the weakness of Thursday & Friday.
Thursday again attempted to break the resistance of the 10 & 50 DMAs, but resulted in declines, which led to Friday’s additional day of declines as fear officially crept into the market.
Like SPY, QQQ has limited support anywhere near their current price, which signals that they may see sharper declines than SPY in the near-term & making their Average True Range reading harder to rely on, as it signals a brief consolidation is warranted in the near-term, but there are few places with strong support levels near their price, as until the $340 block begins at $343.99, it is a seller dominated zone (making it a -4.12% decline before any sturdy footing, historically).
Even should QQQ find brief footing in the $340 (Buyers, 3.28:1) & $336 (Buyers, 1.25:1), the next two blocks are Seller dominated before one last Buyer stand in the $324/share block, which is -8.63% below the current price level, before the sellers take over again.
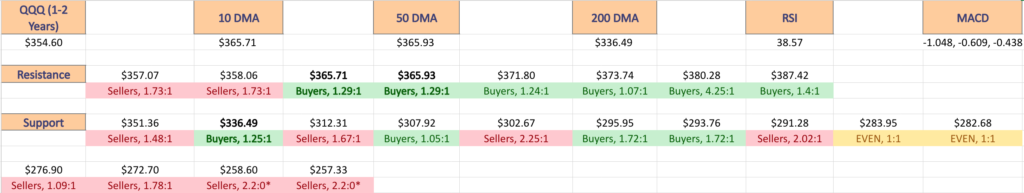
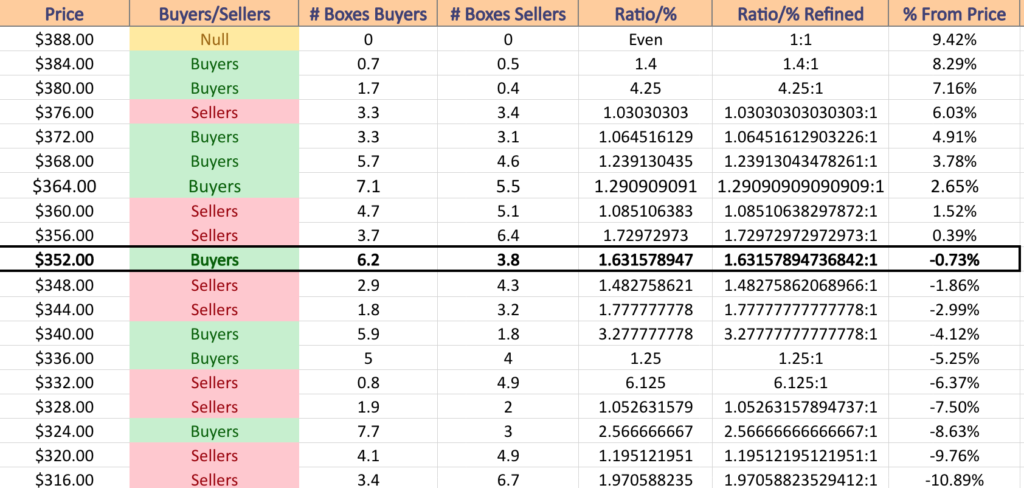
QQQ ETF’s Price:Volume Sentiment Over The Past 1-2 Years
$388 – NULL – 0:0*; +9.42% From Current Price Level
$384 – Buyers – 1.4:1; +8.29% From Current Price Level
$380 – Buyers – 4.25:1; +7.16% From Current Price Level
$376 – Sellers – 1.03:1; +6.03% From Current Price Level
$372 – Buyers – 1.07:1; +4.91% From Current Price Level
$368 – Buyers – 1.24:1; +3.78% From Current Price Level
$364 – Buyers – 1.29:1; +2.65% From Current Price Level – 10 & 50 Day Moving Averages**
$360 – Sellers – 1.09:1; +1.52% From Current Price Level
$356 – Sellers – 1.73:1; +0.39% From Current Price Level
$352 – Buyers – 1.63:1; -0.73% From Current Price Level; Current Price Block*
$348 – Sellers – 1.48:1; -1.86% From Current Price Level
$344 – Sellers – 1.78:1; -2.99% From Current Price Level
$340 – Buyers – 3.28:1; -4.12% From Current Price Level
$336 – Buyers – 1.25:1; -5.25% From Current Price Level – 200 Day Moving Average*
$332 – Sellers – 6.13:1; -6.37% From Current Price Level
$328 – Sellers – 1.05:1; -7.5% From Current Price Level
$324 – Buyers – 2.57:1; -8.63% From Current Price Level
$320 – Sellers – 1.2:1; -9.76% From Current Price Level
$316 – Sellers – 1.97:1; -10.89% From Current Price Level
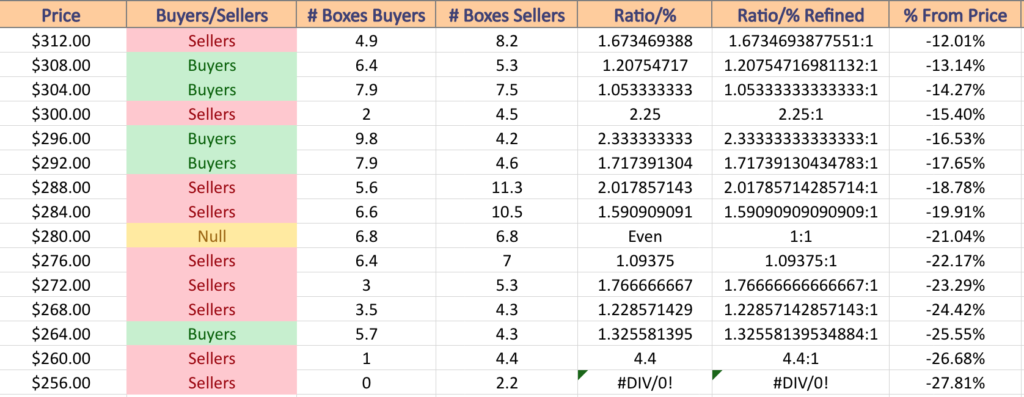
$312 – Sellers – 1.67:1; -12.01% From Current Price Level
$308 – Buyer s- 1.21:1; -13.14% From Current Price Level
$304 – Buyers – 1.05:1; -14.27% From Current Price Level
$300 – Sellers – 2.25:1; -15.4% From Current Price Level
$296 – Buyers – 2.33:1; -16.53% From Current Price Level
$292 – Buyers – 1.72:1; -17.65% From Current Price Level
$288 – Sellers – 2.02:1; -18.78% From Current Price Level
$284 – Sellers – 1.59:1; -19.91% From Current Price Level
$280 – Even; 1:1; -21.04% From Current Price Level
$276 – Sellers – 1.09:1; -22.17% From Current Price Level
$272 – Sellers – 1.77:1; -23.29% From Current Price Level
$268 – Sellers – 1.23:1; -24.42% From Current Price Level
$264 – Buyers – 1.33:1; -25.55% From Current Price Level
$260 – Sellers – 4.4:1; -26.68% From Current Price Level
$256 – Sellers – 2.2:0*; -27.81% From Current Price Level
Technical Analysis & Price:Volume Sentiment For IWM (Russell 2000)
IWM, the iShares Russell 2000 ETF lost -2.25% last week, after being in a steady decline since August & is approaching their 52-week low, which was set almost one year ago.
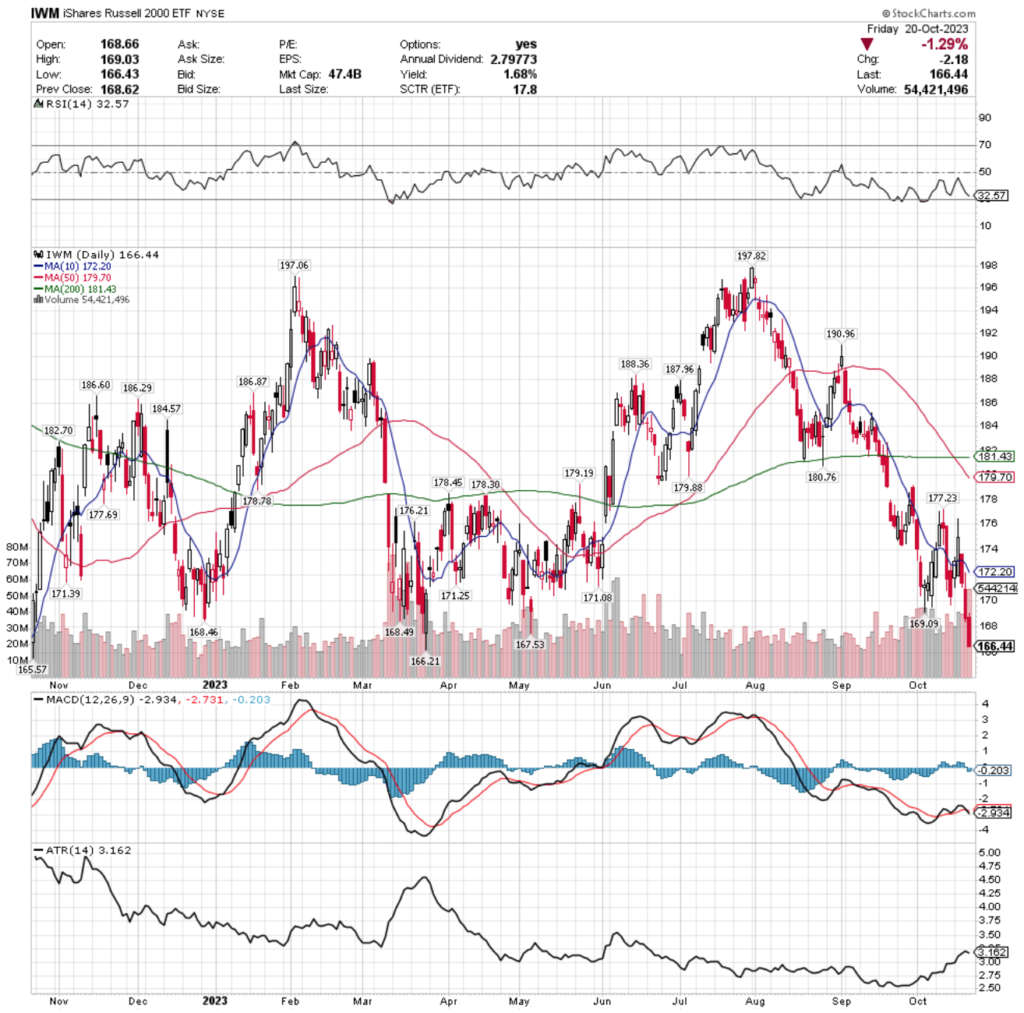
Their RSI is approaching the oversold mark & sits currently at 32.57, while their MACD crossed over bearishly a few days ago.
Most alarming for IWM is the strength of the outflow volume last week, which was +46.01% higher than average when compared to the average volumes for the year prior (41,537,250 vs. 28,447,780), as this indicates a bit more than profit taking was going on & is a signal of broader weakness.
Monday of last week showed hope for the bulls, as IWM was able to break & close above the resistance of the 10 day moving average & the momentum was able to carry into Tuesday for another day of gains.
Tuesday flashed warning signs however, as the day’s price action was all centered around the lower end of the candle, but the upper shadow ran up beyond the $176/share level, but was unable to close near it.
Wednesday the mudslide began & the support of the 10 DMA was broken down, leading way to Thursday & Friday’s declines as well.
Their ATR signals that there may be a brief consolidation on the horizon, unless there is an outright steep decline this week, as all eyes look to see how the support of their 52-week low holds up from about one year ago.
Sellers are currently in control on the $166 price block 1.75:1, with the next lower block of $164 being the lowest level with data for the past 2-3 years being seller dominated at a rate of 2.83:1.
Any further declines will be into uncharted territory from this analysis’s perspective, as $162/share & lower are denoted NULL (not enough volume to report on, but not no volume at all).
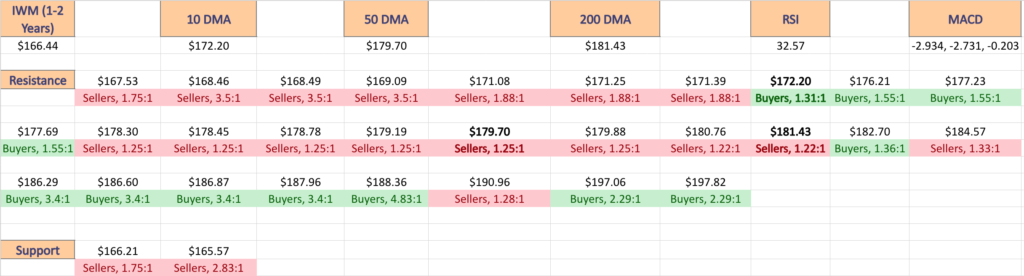
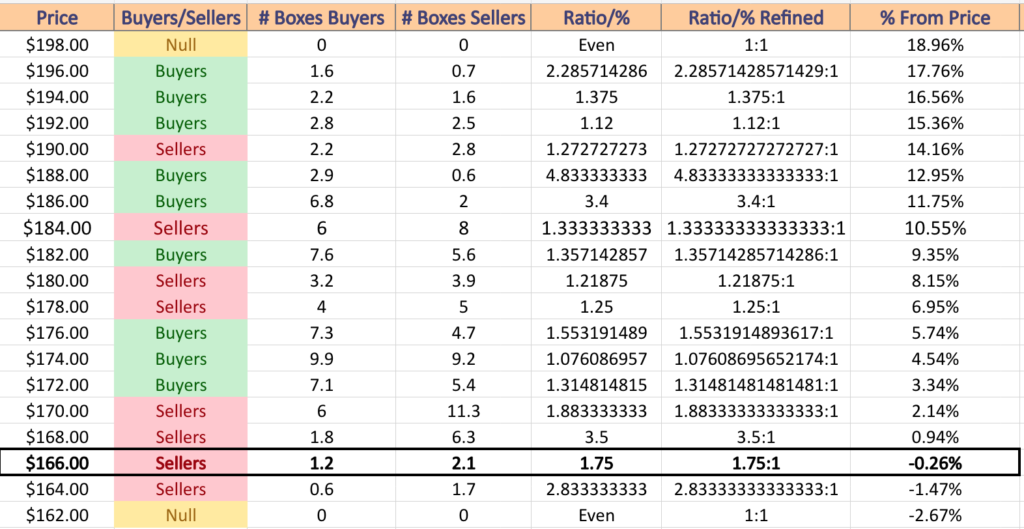
IWM ETF’s Price:Volume Sentiment Over The Past 1-2 Years
$198 – NULL – 0:0*; +18.96% From Current Price Level
$196 – Buyers – 2.29:1; +17.76% From Current Price Level
$194 – Buyers – 1.38:1; +16.56% From Current Price Level
$192 – Buyers – 1.12:1; +15.36% From Current Price Level
$190 – Sellers – 1.27:1; +14.16% From Current Price Level
$188 – Buyers – 4.8:1; +12.95% From Current Price Level
$186 – Buyers – 3.4:1; +11.75% From Current Price Level
$184 – Sellers – 1.33:1; +10.55% From Current Price Level
$182 – Buyers – 1.36:1; +9.35% From Current Price Level
$180 – Sellers – 1.22:1; +8.15% From Current Price Level – 200 Day Moving Average*
$178 – Sellers – 1.25:1; +6.95% From Current Price Level – 50 Day Moving Average*
$176 – Buyer s- 1.55:1; +5.74% From Current Price Level
$174 – Buyers – 1.08:1; +4.54% From Current Price Level
$172 – Buyers – 1.31:1; +3.34% From Current Price Level – 10 Day Moving Average*
$170 – Sellers – 1.88:1; +2.14% From Current Price Level
$168 – Sellers – 3.5:1; +0.94% From Current Price Level
$166 – Sellers – 1.75:1; -0.26% From Current Price Level; Current Price Block*
$164 – Sellers – 2.83:1; -1.47% From Current Price Level
$162 – NULL – 0:0*; -2.67% From Current Price Level
Technical Analysis & Price:Volume Sentiment For DIA (Dow Jones Industrial Average)
DIA, the SPDR Dow Jones Industrial Average ETF fared the best of the major indexes last week, dropping -1.52% as investors still maintained faith in the larger cap names.
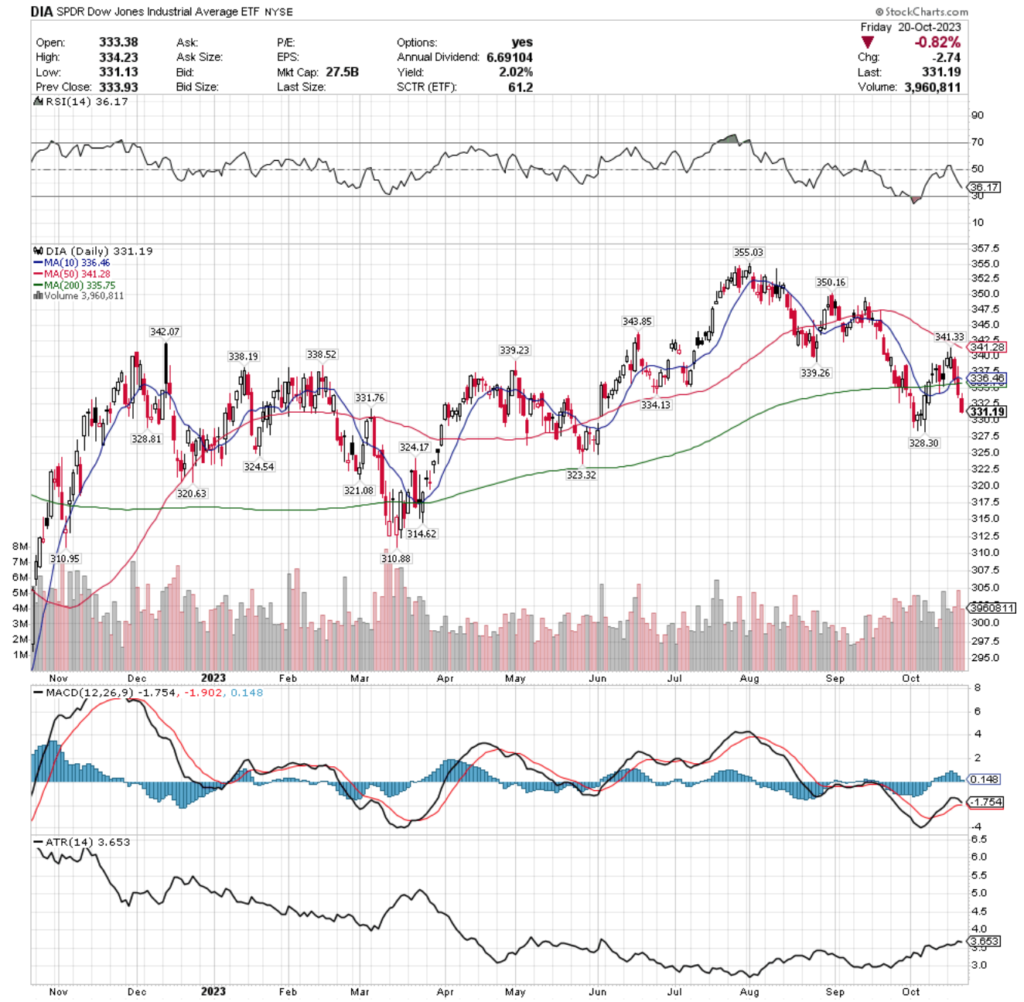
Their RSI is nosediving towards oversold & sits currently at 36.17, with a MACD that is set for a bearish crossover tomorrow or Tuesday.
Volumes were still an area of concern for DIA though, with last week’s volume being +20.45% above average compared to the year prior (4,367,283 vs. 3,625,732) & Thursday was the largest volume day, on a decline that broke the support of the 10 & 200 day moving averages, signaling that there is a sense of panic now for the index that has remained the most resilient recently.
Monday kicked off with a candle that is slightly larger bodied than a spinning top & remained relatively range-bound, indicating hesitance on the part of market participants & Tuesday’s candle’s real body remained in the same range, despite the upper shadow extending higher, indicating that there was limited interest in going above the range.
Wednesday’s decline was supported by the 10 day moving average, before Thursday’s aggressive decline (by volume) broke through the 10 & 200 DMA, leading to Friday’s decline that broke down the $331.76/share support level to close lower.
All eyes will be on the $328/share range, which has historically been dominated by buyers over the past 3-4 years at a rate of 1.1:1.
After that the sellers take control for another -7% of downside before buyers step back into control historically, as the data below shows.
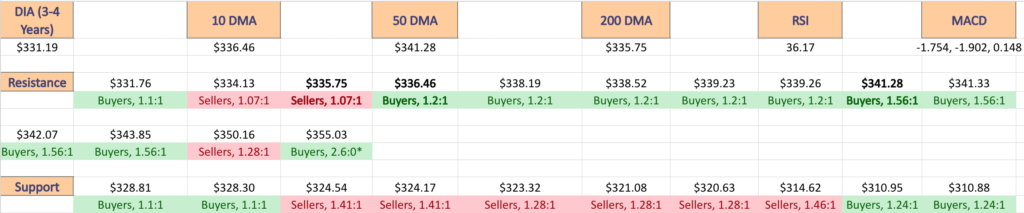
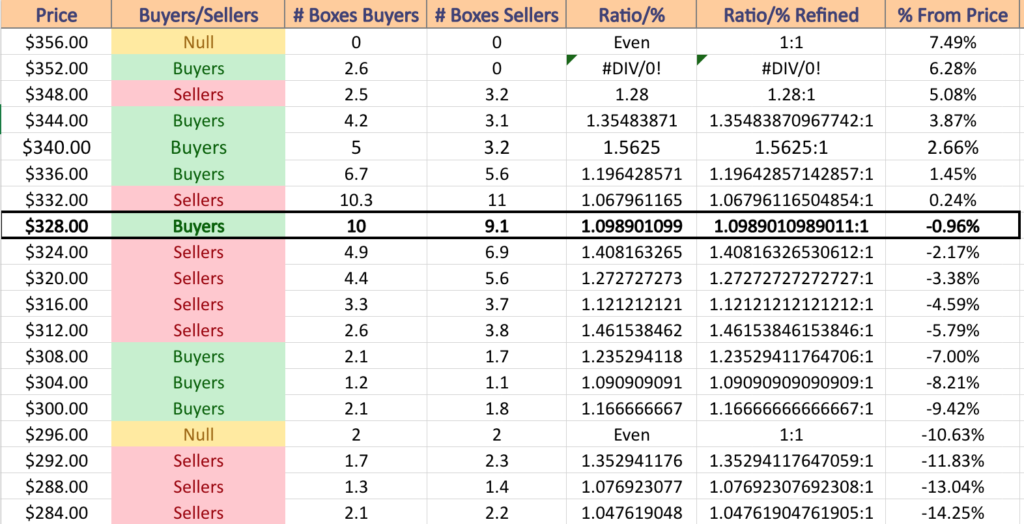
DIA ETF’S Price:Volume Sentiment Over The Past 3-4 Years
$356 – NULL – 0:0; +7.49% From Current Price Level
$352 – Buyers – 2.6:0*; +6.28% From Current Price Level
$348 – Sellers – 1.28:1; +5.08% From Current Price Level
$344 – Buyers – 1.35:1; +3.87% From Current Price Level
$340 – Buyers – 1.56:1; +2.66% From Current Price Level – 50 Day Moving Average*
$336 – Buyers – 1.2:1; +1.45% From Current Price Level – 10 Day Moving Average*
$332 – Sellers – 1.07:1; +0.24% From Current Price Level – 200 Day Moving Average*
$328 – Buyers – 1.1:1; -0.96% From Current Price Level; Current Price Block*
$324 – Sellers – 1.41:1; -2.17% From Current Price Level
$320 – Sellers – 1.27:1; -3.38% From Current Price Level
$316 – Sellers – 1.12:1; -4.59% From Current Price Level
$312 – Sellers – 1.46:1; -5.79% From Current Price Level
$308 – Buyers – 1.24:1; -7% From Current Price Level
$304 – Buyers – 1.09:1; -8.21% From Current Price Level
$300 – Buyer s – 1.17:1; -9.24% From Current Price Level
$296 – Even – 1:1; -10.63% From Current Price Level
$292 – Sellers – 1.35:1; -11.83% From Current Price Level
$288 – Sellers – 1.08:1; -13.04% From Current Price Level
$284 – Sellers – 1.05:1; -14.25% From Current Price Level
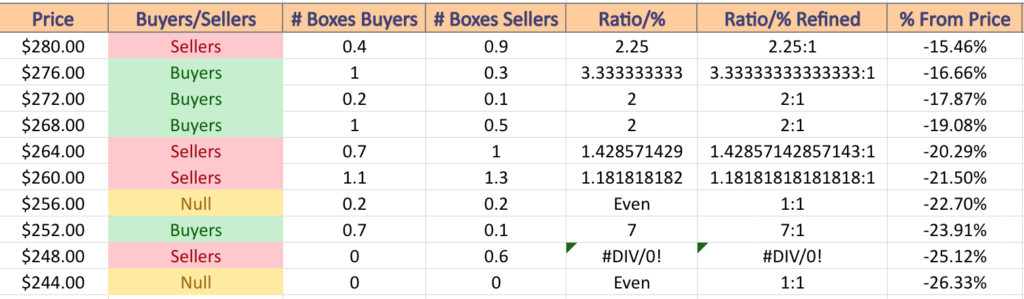
$280 – Sellers – 2.25:1; -15.46% From Current Price Level
$276 – Buyers – 3.33:1; -16.66% From Current Price Level
$272 – Buyers – 2:1; -17.87% From Current Price Level
$268 – Buyers – 2:1; -19.08% From Current Price Level
$264 – Sellers – 1.43:1; -20.29% From Current Price Level
$260 – Sellers – 1.18:1; -21.5% From Current Price Level
$256 – Even – 1:1; -22.7% From Current Price Level
$252 – Buyers – 7:1; -23.91% From Current Price Level
$248 – Sellers – 0.6:0*; -25.12% From Current Price Level
$244 – NULL – 0:0*; -26.33% From Current Price Level
The Week Ahead
Let’s take a look at some of the things that may move the markets in the coming week.
Monday has no economic data scheduled for reporting, but Agilysys, Alexandria Real Estate Equities, Brown & Brown, Cadence Bank, Calix Networks, Cleveland-Cliffs, Crane, Medpace, Packaging Cor of America, Simpson Manufacturing, W.R. Berkley & WSFS Financial are all scheduled to report earnings.
Tuesday brings us the S&P Case-Schiller Home Price Index (20 Cities) at 9 am, S&P Flash U.S. Services PMI & S&P Flash U.S. Manufacturing PMI data at 9:45 am.
Tuesday’s earnings calls include Microsoft, 3M, Alphabet, Archer-Daniels-Midland, Ares Capital, Boyd Gaming, Canadian National Railway, Centene, Coca-Cola, Chubb, Corning, Danaher, Dover, Dow, Encore Wire, F5 Networks, Franklin Electric, General Electric, General Motors, Halliburton, Hawaiian Holdings, Illinois Tool Works, Invesco, JBT Corp, Kimberly-Clark, Matador Resources, NextEra Energy, Nucor, Old National Bancorp, PACCAR, PacWest Bancorp, Pentair, Polaris Industries, PulteGroup, Quest Diagnostics, Range Resources, Robert Half, RTX, Sherwin-Williams, Simply Good Foods, Snap, Spotify, Synchrony Financial, Teck Resources, Teladoc Health, Texas Instruments, TransUnion, Verizon Communications, Vicor, Visa, Waste Management & Xerox.
Wednesday we get New Home Sales data at 10 am, as well as earnings reports from Meta Platforms, Agnico-Eagle Mines, Alamos, Align Technology, Amphenol, Antero Resources, AptarGroup, Automatic Data, AvalonBay, Avery Dennison, Baker Hughes, Boeing, BOK Financial, Canadian Pacific Kansas City, Chemed, Churchill Downs, CME Group, CNX Resources, Community Health, Edwards Lifesciences, Element Solutions, EQT Corp., Equinix, Ethan Allen, Everest Group, Evercore, Flex, Flowserve, Fortive, General Dynamic, Globe Life, Graco, Greenbrier, Hess, Hilton, International Business Machines, IDEX Corp, IMAX, Invitation Homes, Kilroy Realty, KLA Corp. Lending Club, Lithia Motors, Mattel, Molina Healthcare, Moody’s, Mr. Cooper Group, MSC Industrial, Navient, Netgear, Norfolk Southern, O’Reilly Automotive, Old Dominion Freight Line, Otis Worldwide, Owens Corning, Pilgrim’s Pride, Ryder System, Sallie Mae, SEI Investments, ServiceNow, Sun Communities, Sunnova Energy, Taylor Morrison Home, Teledyne Technologies, Teradyne, Thermo Fisher Scientific, T-Mobile US, Travel + Leisure, United Rentals, Universal Health, Valmont Industries, VICI Properties, Viking Therapeutic, Wabash National, Weatherford International, WesBanco, West Fraser, Western Union, Whirlpool, and Wyndham Hotels & Resorts.
GDP, Initial Jobless Claims, Durable-Goods Orders, Durable-Goods Minus Transportation, Advanced U.S. Trade Balance in Goods, Advanced Retail Inventories & Advanced Wholesale Inventories data are released at 8:30 am on Thursday, followed by Pending Home Sales at 10 am.
Thursday’s earnings calls include Amazon.com, A.O. Smith, AllianceBernstein, Altria Group, American Tower, Applied Industrial, Arch Coal, BJ Restaurants, Boston Beer, Boston Scientific, Bristol Meyers Squibb, Brunswick, Bunge, Camden Property, Capital One Financial, Carlisle Cos, Carrier Global, CenterPoint Energy, CMS Energy, Chemours, Chipotle Mexican Grill, Cincinnati Financial, Columbia Sportswear, Comcast, Coursera, Cullen/Frost, Deckers Outdoor, Dexcom, Digital Realty Trust, Eastman Chemical, Encompass Health, Enphase Energy, Essex Property, First American Financial, Federated Hermes, FirstEnergy, Ford Motor, Gaming & Leisure Properties, Grainger, Harley-Davidson, Hartford Financial Group, Hasbro, Hershey Foods, Hertz Global, Honeywell, Hub Group, Intel, International Paper, Juniper Networks, Kenvue, Keurig Dr. Pepper, Kimco Realty, L3Harris, Laboratory Corp. of America, Lennox International, Linde, Masco, Mastercard, Medical Properties Trust, Merck, Mobileye Global, Mohawk Industries,NerdWallet, Newmont Goldcorp, Northrop Grumman, NovoCure, Olin, Overstock.com, Peabody Energy, PG&E, Principal Financial Group, PTC Therapeutics, Reliance Steel, Republic Services, Royal Caribbean, Seagate Technology, Sketchers USA, SkyWest, Southwest Airlines, STAG International, STMicroelectronics, Terex, Texas Roadhouse, Textron, Tractor Supply Company, Tradeweb Markets, TRI Pointe Homes, United Parcel Services, U.S. Steel, UDR, Valero Energy, VeriSign, Vulcan Materials, Willis Towers Watson & Weyerhaeuser.
Friday the week winds down with Personal Income (nominal), Personal Spending (nominal), PCE Index, Core PCE Index, PCE (Year-over-Year) & Core PCE (Year-over-Year) at 8:30 am, followed by Consumer Sentiment (Final) data at 10 am.
Friday’s earnings calls feature AbbVie, AerCap Holdings, Aon, AutonNation, Avantor, Barnes Group, BoozAllen Hamilton, CBRE Group, Chart Industries, Colgate-Palmolive, Exxon Mobil, First Hawaiin, Fortis, Gentex, Imperial Oil, LyondellBasell, Newell Brands, Phillips 66, Piper Sandler, Saia, Sanofi, Stanley Black & Decker, T. Rowe Price, WisdomTree & Xcel Energy.
See you back here next week!
*** I DO NOT OWN SHARES OR OPTIONS CONTRACT POSITIONS IN SPY, QQQ, IWM or DIA AT THE TIME OF PUBLISHING THIS ARTICLE ***