SPY, the SPDR S&P 500 ETF advanced +1.16% over the past week, leading all of the major indexes in the wake of the NVDA earnings report.
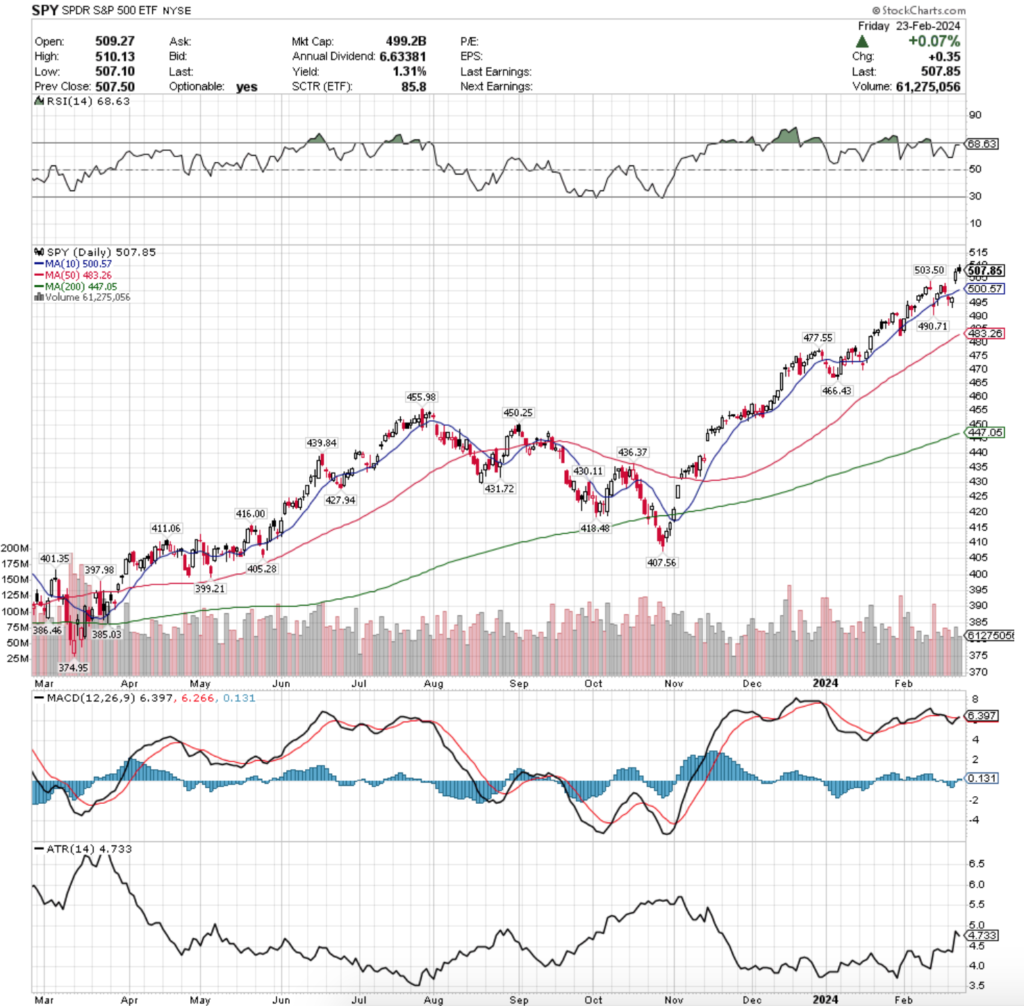
Their RSI is currently flat following the past two sessions’ tight range, near the bounds of overbought at 68.63, while their MACD is slightly bullish in the wake of Thursday’s gap up session.
Volumes were -15.4% below average last week compared to the year prior (68,897,680 vs. 81,441,800), as market participants were not overly eager to add risk at all time highs for SPY components.
Monday kicked the week off on a sour note, with a bearish day that tested the support strength of the 10 day moving average, before an additional declining session Tuesday pushed SPY below the 10 DMA.
Wednesday opened lowed than Tuesday, but ultimately rallied enough to close higher, before the NVDA earnings in the after-hours gave the spark that catalyzed a jump back above the 10 DMA on Thursday.
The week ended on another note of uncertainty though, with a spinning top candlestick, that while the session ended in an advance, it closed lower than it opened, signaling weakness & risk off sentiment going into the weekend.
SPY’s Average True Range is currently declining following Thursday’s gap up, after there has been increased volatility over the prior seven sessions.
An area to watch this week will be the strength of SPY’s MACD, as Thursday & Friday were able to turn it slightly bullish, but it is still relatively muted compared to what you would expect to see at the beginning of a strong trend.
The Fed speakers this week will likely be some of the biggest influences on this (a schedule of them is listed in the following section).
Earnings continue into this week as well, with a number of names that can sway markets due to report this week, in addition to regularly scheduled economic data that is set to be released.
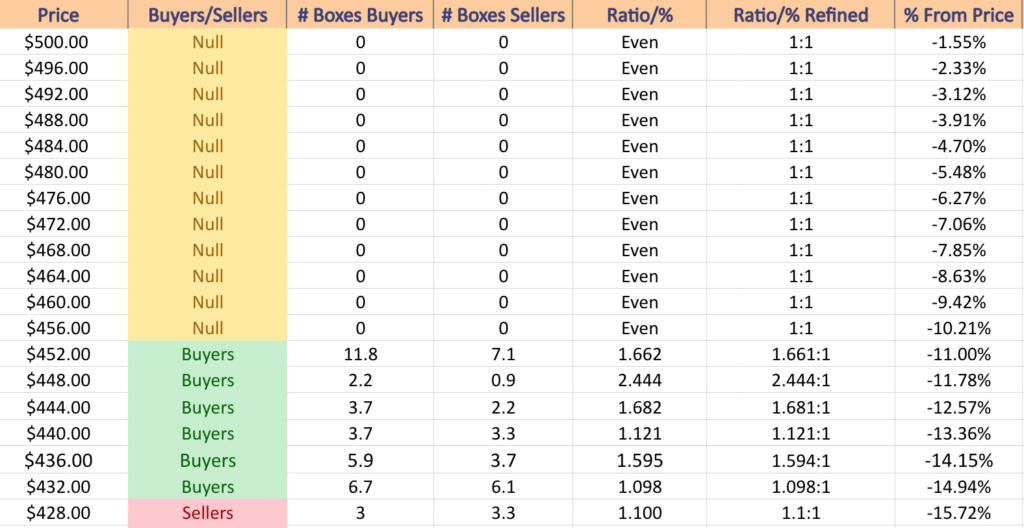
SPY has support at the $503.50 (Volume Sentiment: NULL, 0:0*), $500.57 (10 Day Moving Average, Volume Sentiment: NULL, 0:0*), $490.71 (Volume Sentiment: NULL, 0:0*) & $483.26/share (50 Day Moving Average, Volume Sentiment: NULL, 0:0*), with no resistance levels in the past year as they are at an all-time high.
QQQ, the Invesco QQQ Trust ETF inched forward +0.52% this past week, underperforming SPY, as it appeared investors were treading cautiously around the risks surrounding technology stocks.
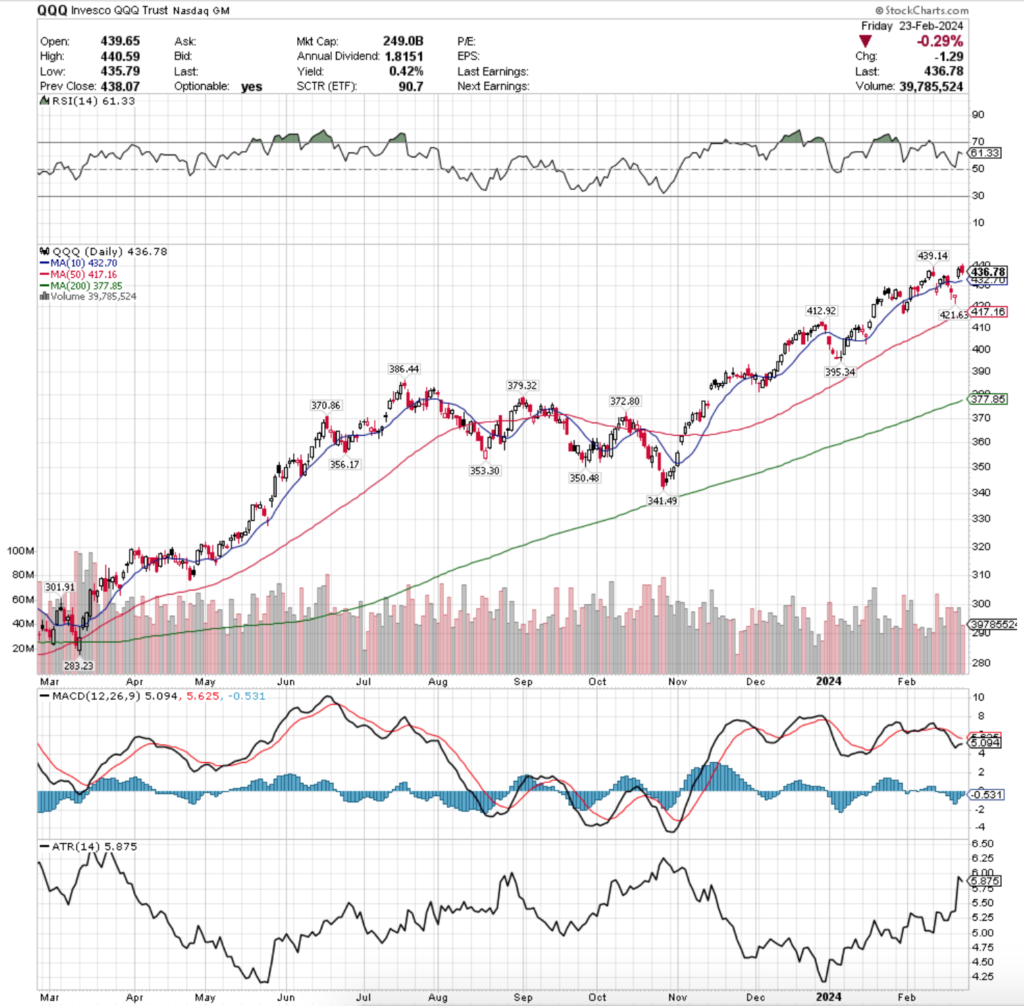
Their RSI is currently declining back towards the neutral 50-mark & sits currently at 61.33, while their MACD is bearish, but moving towards the signal line in a manner that could result in a bullish reversal if there is a strong advancing session or two early in the week.
Volumes were -2.18% below average last week compared to the year prior (50,304,580 vs. 51,424,090), which is worth noting as QQQ had four declining sessions last week, which is not an indication of strength.
The week began on a weak foot, with Monday’s declining session falling below the support of the 10 day moving average.
Tuesday followed suit & continued the decline before Wednesday’s session decline, but formed a hammer candle (indicating a reversal was likely), while closing higher than it opened (another signal of near-term strength).
QQQ gapped up above the 10 day moving average on Thursday, but Friday gave another bearish signal, as the day opened higher than Thursday, but ultimately declined -0.29%.
Friday’s volumes were low, but given that three of the previous four days were declining sessions as well that isn’t as strong of a signal as it might normally be & really just amounts to general skittishness & anxiousness among market participants.
Much like SPY, QQQ’s Average True Range is declining in the wake of Thursday’s gap up session after it had shown signs of increased volatility in the couple of prior weeks.
This week all eyes will remain watching the tight rope walk along the 10 day moving average’s support, waiting to see when it finally gives way & becomes resistance & downward pressure on QQQ’s price.
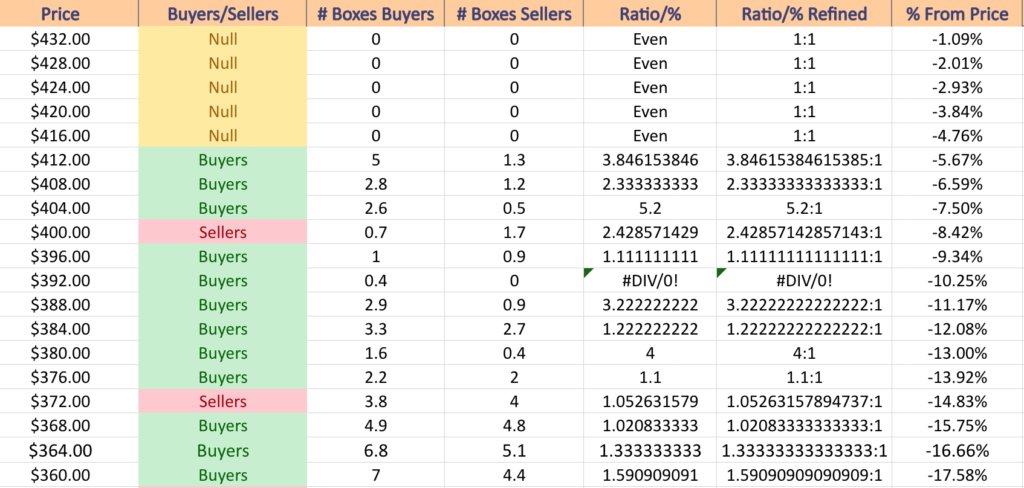
QQQ has support at the $432.70 (10 Day Moving Average, Volume Sentiment: NULL, 0:0*), $421.63 (Volume Sentiment: NULL, 0:0*), $417.16 (50 Day Moving Average, Volume Sentiment: NULL, 0:0*) & $412.92/share (Volume Sentiment: Buyers, 3.85:1), with resistance at the $439.14/share price level (All-Time High, Volume Sentiment: NULL, 0:0*).
IWM, the iShares Russell 2000 ETF declined -2.23%, as small cap names were viewed unfavorably, following in the wake of all of the large cap related news.
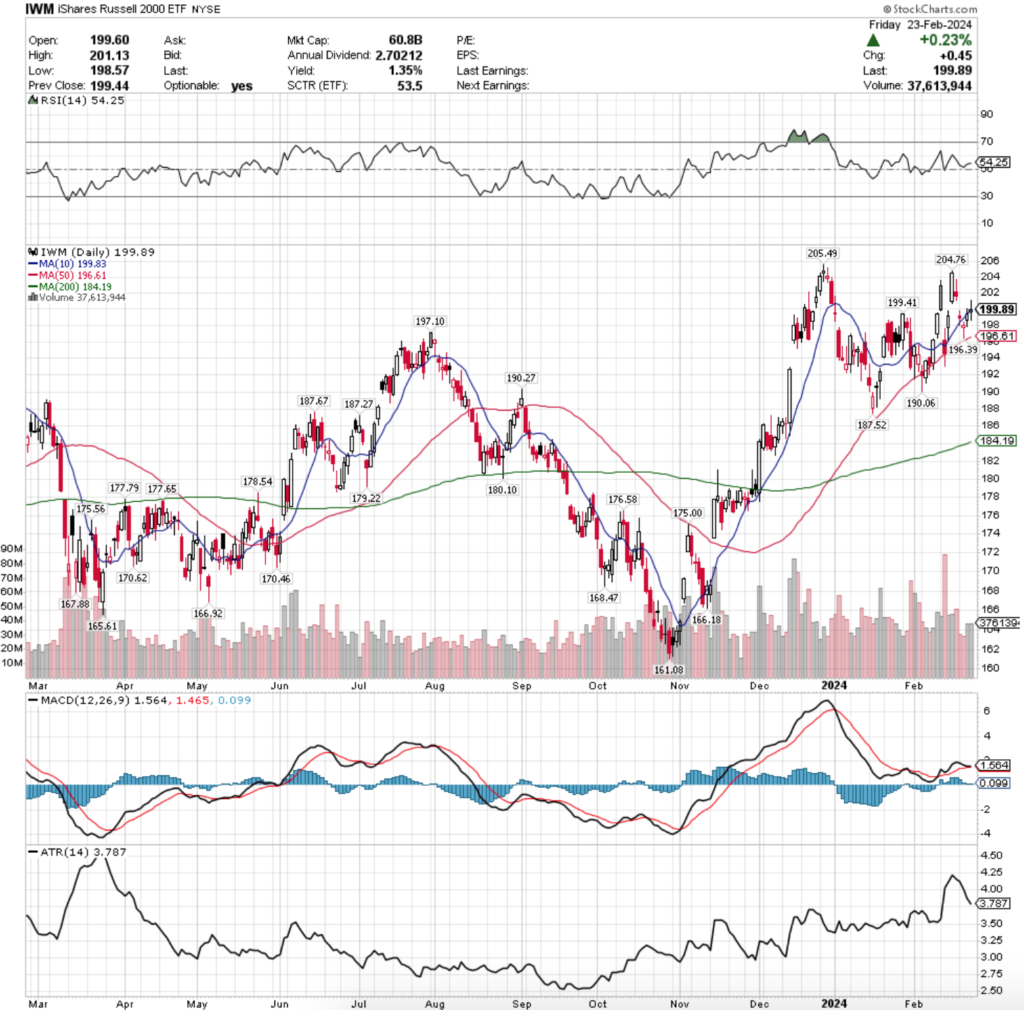
Their RSI is near neutral at 54, although slightly trending up following Thursday & Friday’s gains, while their MACD is slightly bullish, but very muted & not signaling much strength & optimism at current levels.
Volumes were 5.67% above average last week compared to the year prior (36,697,760 vs. 34,728,798), led by Monday’s declining session which had the highest level of the week.
Monday’s session created a bearish harami pattern with the previous Friday’s candle, setting the stage for Tuesday’s gap down decline.
Tuesday also signaled much uncertainty among investors, as the day resulted in a spinning top candle that temporarily dipped below the support of the 10 day moving average.
Wednesday the charge continued lower, but a late session rally forced IWM’s close to be higher than the open, as there was optimism about NVDA’s earnings report.
The rest of the week did not signal strength though, as Thursday’s session tested lower but ultimately closed right along the 10 day moving average’s resistance.
While it tested slightly higher than the 10 DMA it was unable to close there & Friday’s session signaled indecision & uncertainty heading into the weekend, ending the day in a spinning top candle that was also right along the 10 DMA ($0.06 above it).
IWM’s Average True Range has been in decline for most of February, as the small cap index has experienced some volatile swings, but its price has remained clustered around the same general price levels throughout the entire time.
The 10 & 50 Day Moving Averages will be something to keep an eye on this week, as once the support of the 10 DMA breaks down the 50 DMA will become an important support level that is creeping closer & closer to IWM’s current price.
Should the price break below the 50 DMA it will begin putting downwards pressure on IWM’s price along with the 10 DMA.
While IWM’s trading patterns over the past year provide it more support touch-points than SPY or QQQ’s in the near-term & in ranges closer to the price, they might not mean much if the price is being forced downwards by heavy selling volume & both moving averages.
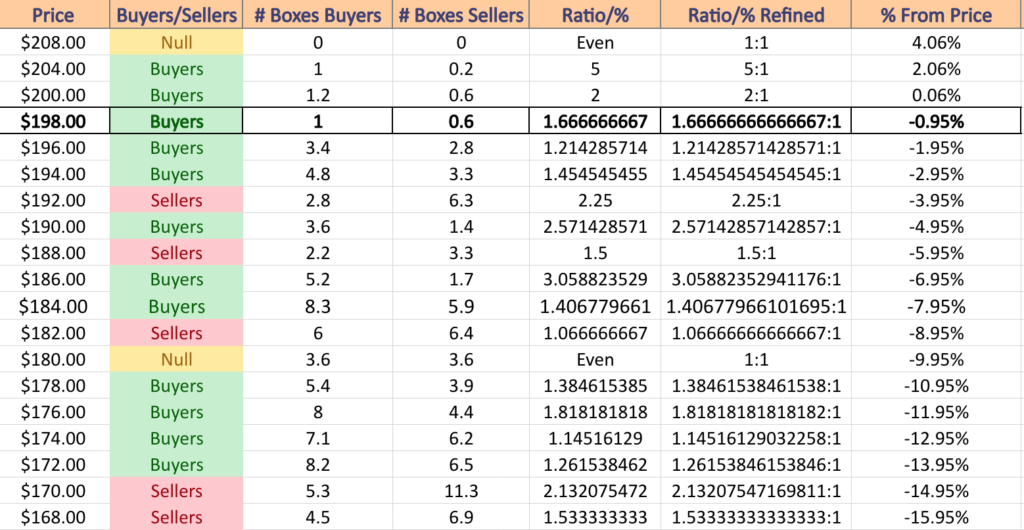
IWM has support at the $199.83 (10 Day Moving Average, Volume Sentiment: Buyers, 1.67:1), $199.41 (Volume Sentiment: Buyers, 1.67:1), $197.10 (Volume Sentiment: Buyers, 1.21:1) & $196.61/share (50 Day Moving Average, Volume Sentiment: Buyers 1.21:1), with resistance at the $204.76 (Volume Sentiment: NULL, 0:0*) & $205.49/share (52 Week High, Volume Sentiment: NULL, 0:0*).
DIA, the SPDR Dow Jones Industrial Average ETF gained +0.94% last week, finishing the week in second of the major indexes.
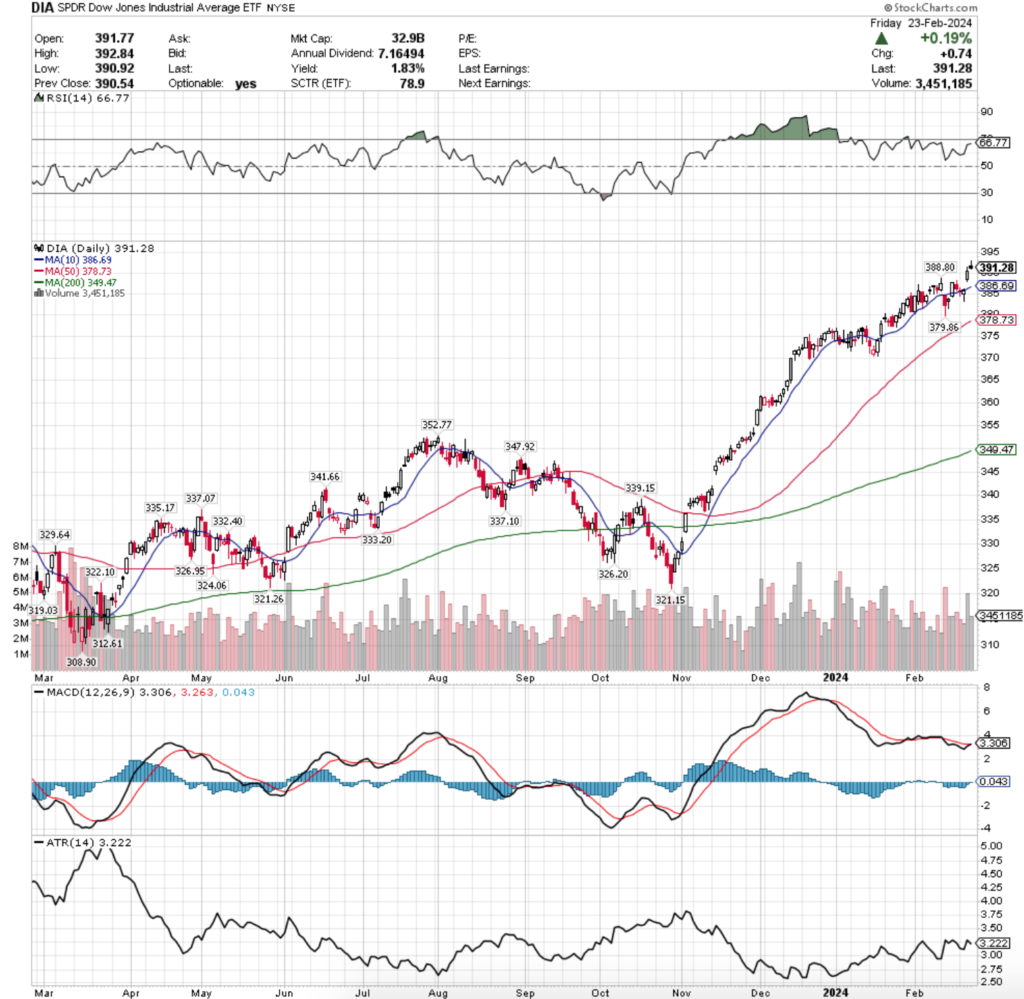
Their RSI is approaching overbought levels again & sits currently at 66.77, while their MACD is slightly bullish, but does not show convincing strength in its current state.
Volumes were +6.12% above the past year’s average (3,708,300 vs. 3,494,490), mostly due to Thursday’s gap up sessions following the NVDA earnings report.
Monday the week began on a bearish note, with a bearish session that resulted in a doji on Tuesday (uncertainty) declining into Wednesday, when a hammer reversal candle closed near the 10 day moving average.
Thursday resulted in a gap up, which tested higher on the day based on its upper shadow, but Friday signaled danger on the horizon.
Friday’s candle was a shooting star, indicating that there was investor sentiment higher based on the tall upper shadow, but the spinning top real body signals uncertainty, which begins to look bearish when you factor in that the bullish candle is filled in, meaning that it closed lower than it opened following a gap up.
It will be interesting to see if Monday’s session creates an evening star pattern & leads into declines this week, as volumes do not indicate that there is much optimism & strength behind recent price moves & that there will likely be profit taking from the late-week gains coming up.
Additionally, the 10 & 50 day moving averages will be an area of focus in the coming week(s), as unlike IWM, DIA does not have many support levels near their current price & if the 50 DMA is broken to the downside the nearest support level is ~10% from their closing price from Friday.
Their ATR is currently declining following Thursday & Friday’s price action, but a bit more volatility will have it on the rise again should we get some this week.
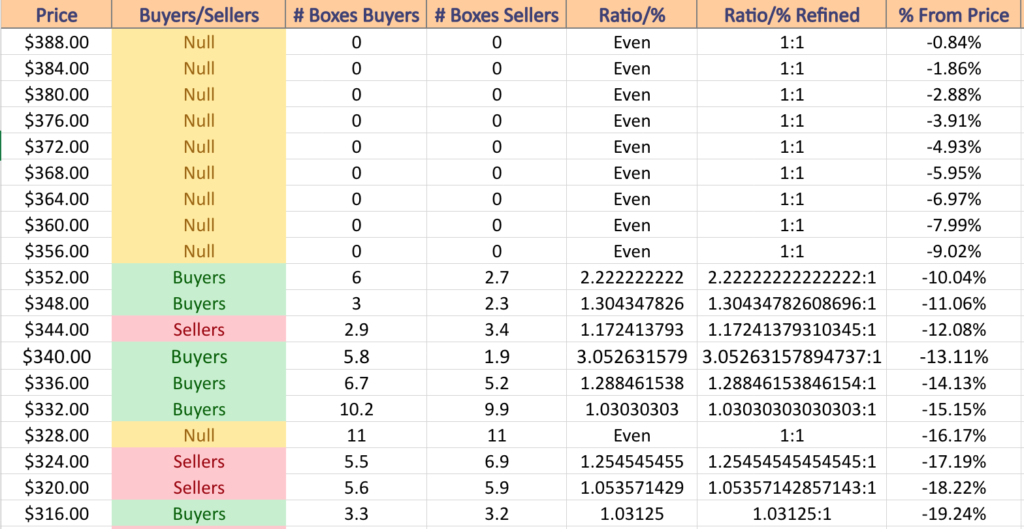
DIA has support at the $388.80 (Volume Sentiment: NULL, 0:0*), $386.69 (10 Day Moving Average, Volume Sentiment: NULL, 0:0*), $379.86 (Volume Sentiment: NULL, 0:0*) & $378.73/share (50 Day Moving Average, Volume Sentiment: NULL, 0:0*), with no resistance levels in the past year as they are at an all-time high.
The Week Ahead
Monday the week kicks off with New Home Sales data at 10 am.
ADTRAN, AES, Albany International, BioCryst Pharmaceuticals, CarGurus, Domino’s Pizza, Dorman Products, Elanco Animal Health, Fidelity National Information Services, Fresh Del Monte, Freshpet, HEICO, Helios Technologies, Hims & Hers Health, Innovative Industrial Properties, iRobot, Li Auto, ONEOK, Pilgrim’s Pride, Playtika, Public Service, PubMatic, SBA Communications, STAAR Surgical, Trex, Unity Software, Workday & Zoom Video Communications are all scheduled to report earnings on Monday.
Durable-goods Orders & Durable-goods minus Transportation data are released Tuesday at 8:30 am, followed by S&P Case-Shiller Home Price Index (20 Cities) data at 9 am & Consumer Confidence data at 10 am.
Tuesday’s earnings reports include Macy’s, 3D Systems, Acadia Healthcare, ACADIA Pharmaceuticals, AdaptHealth, Agilent, Alcon, Ambarella, American Electric, American Tower, Array Technologies, AutoZone, Axon, B&G Foods, Beacon Roofing Supply, Beyond Meat, Boston Beer Co, Bumble, California Resources Corp, Carter’s, CAVA Group, Chemed, Civitas Resources, Clean Energy Fuels, Constellation Energy, Coupang, Cracker Barrel, Credo Technology Group, Cytokinetics, Darling Ingredients, Devon Energy, eBay, Extra Space Storage, First Solar, Gaming and Leisure Properties, Green Dot, Grocery Outlet, Henry Schein, Interface, International Money Express, J.M. Smucker, Jones Lang LaSalle, Klaviyo, Lemonade, Luminar Technologies, Masimo, Myriad Genetics, Norwegian Cruise Line, Opko Health, OraSure, Pan Am Silver, Park Hotels & Resorts, Perrigo, Pinnacle West, Portillo’s, Redfin, Revolve Group, Ryan Specialty Group, Sealed Air, Splunk, Stitch Fix, TimkenSteel, TKO Group Holdings, Universal Health, Urban Outfitters, Virgin Galactic, VIZIO & Xenia Hotels.
Things get busier on Wednesday, with GDP (first revision), Advanced U.S. Trade Balance in Goods, Advanced Retail Inventories & Advanced Wholesale Inventories data at 8:30 am, followed by the Chicago Business Barometer (PMI) at 9:45 am & at 12 pm Atlanta Fed President Bostic speaks.
Salesforce, AAON, ACM Research, Advance Auto Parts, AMC Entertainment, Ameresco, Amicus Therapeutics, C3.ai, Cactus, Chart Industries, Chemours, Clearwater Analytics, Compass Diversified, Dine Brands, Donaldson, Duolingo, Dycom, Editas Medicine, EPR Properties, Forward Air, Frontdoor, Geron, Gogo, Greif, Holley, HP Inc., Integra, James River Group, Jazz Pharma, Kinetik, Kontoor Brands, Magnite, Marathon Digital Holdings, Marqeta, Monster Beverage, National Storage Affiliates, Nexstar, NRG Energy, Nutanix, ODP Corporation, Okta, Patterson Companies, Payoneer, Sarepta Therapeutics, Sinclair Broadcast, Snowflake, Sociedad Quimica y Minera, Sovos Brands, Squarespace, Steven Madden, Stoneridge, Taboola, Talos Energy, TJX, United Parks & Resorts, Viatris, Vipshop, Warby Parker, Wheaton Precious Metals, WW & Zuora will all report earnings on Wednesday.
Thursday brings us Initial Jobless Claims, Personal Income (nominal), Personal Spending (nominal), PCE Index, Core PCE Index, PCE (Year-over-Year) & Core PCE (Year-over-Year) at 8:30 am, Pending Home Sales at 10 am, Atlanta Fed President Bostic speaks at 10:50 am, followed by Chicago Fed President Goolsbee speaking at 11 am & Cleveland Fed President Mester speaking at 1:15 pm.
Birkenstock Holdings, ACI Worldwide, American Woodmark, Anheuser-Busch InBev, Arlo Technologies, Autodesk, Bath & Body Works, Best Buy, BRP, Celsius, Certara, Cogent Communications, Cooper, CubeSmart, Dole, Endava, Evergy, Everi, ExlService, First Advantage, Fisker, Frontline, GoodRx, Hewlett Packard Enterprise, Hilton Grand Vacations, Hormel Foods, International Seaways, MasTec, Melco Resorts & Entertainment, Navitas Semiconductor, NetApp, Pacira BioSciences, Papa John’s, PTC Therapeutics, Quaker Chemical, Royal Bank of Canada, Six Flags, Strategic Education, Sweetgreen, Toronto-Dominion Bank, TTEC Holdings, Uniti Group, Utz Brands, Veeva Systems, Vertex & Zscaler are all scheduled to report earnings on Thursday.
The week winds down with Dallas Fed President Logan & Fed Governor Waller speaking at 10:15 am, Atlanta Fed President Bostic speaking at 12:15 pm & San Francisco Fed President Daly speaking at 1:30 pm.
Friday’s earnings calls include Bank of Montreal, Plug Power & RadNet.
See you back here next week!
*** I DO NOT OWN SHARES OR OPTIONS CONTRACT POSITIONS IN SPY, QQQ, IWM OR DIA AT THE TIME OF PUBLISHING THIS ARTICLE ***