Alphabet Inc. stock trades under the ticker GOOGL & has advanced +39.5% over the past year.
Their current share price (per last night’s close) is -8.9% below their 52-week high, which was achieved two days prior on 1/29/24, while their share price has recovered +58.16% since their 52-week low in February of 2023.
Given their recent fall from a 52-week high, it is beneficial to take a look at how buyers & sellers have interacted at each price level they’ve traded at in recent history to gain insight into how strong or weak support & resistance levels will be in the future.
Below is a brief technical analysis overview of GOOGL stock’s past year & recent week, along with a section that outlines the ratios listed above for each price level & notes their support & resistance levels from the past year.
It is not meant as investing advice, but rather as an extra resource to review in addition to your due-diligence process.
Please note that at price extremes, such as the recent 52-week high that there is limited data for both sides, which will skew things near tops towards the Buyers & towards Sellers near the lower end of the range.
Also, any price level that did not have enough meaningful data is denoted with a “NULL” & any ratio that has a 0 for consequent value is marked with a “*” after the ratio.
Technical Analysis Of Alphabet Inc. GOOGL Stock
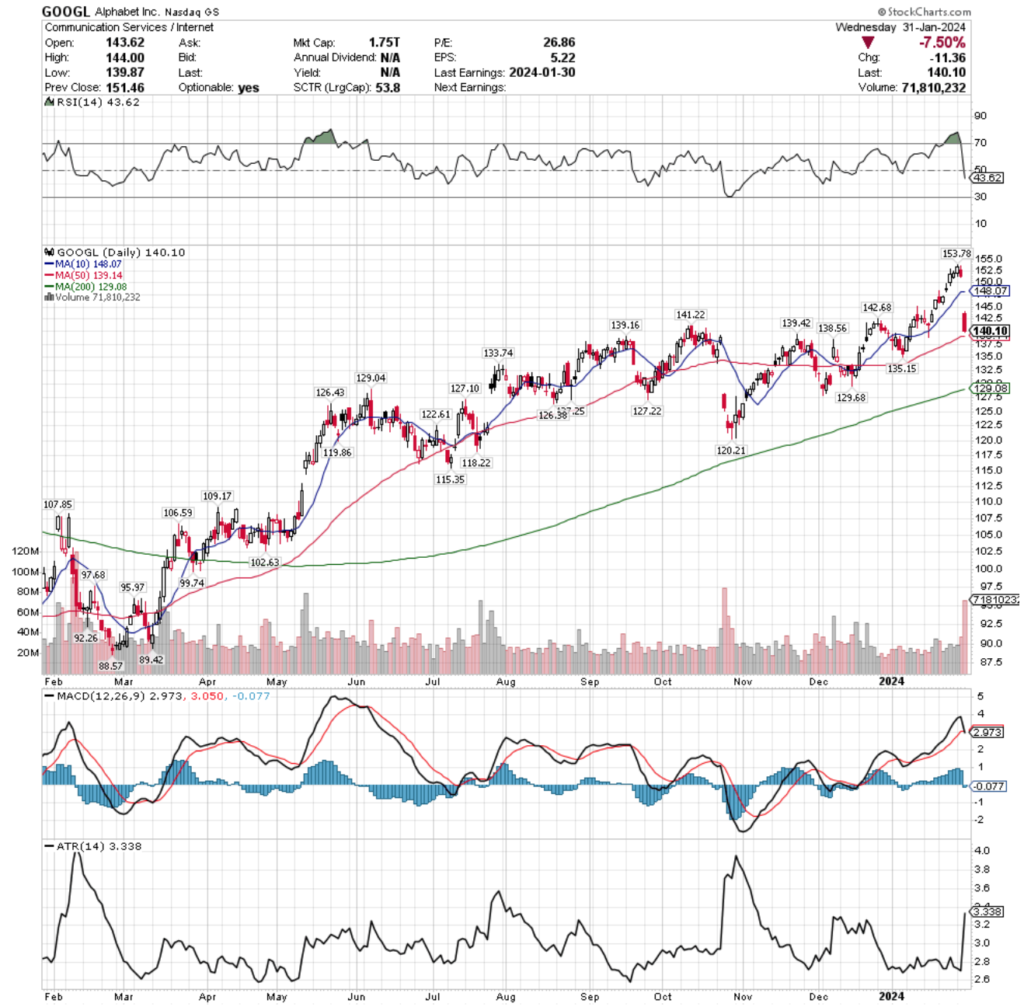
GOOGL stock’s RSI is currently below neutral & sits at 43.62 following their recent declines after spending a week & a half in overbought conditions.
Their MACD has also recently completed a bearish crossover following yesterday’s major gap down session.
Volumes were +18.65% above average over the past week compared to the week prior’s averages, mostly due to yesterday’s steep declines from their 52-week high, as investors rushed to take profits following their earnings report.
The high volume levels of yesterday’s session were the 6th highest of the past year, indicating that there is likely to be more bearish sentiment for GOOGL in the near-term, particularly if today’s session is unable to produce any meaningful gains.
Yesterday’s gap down created a -7.5% window, where the support of the 10-day moving average was completely blown through on the open, while the 50 DMA was able to provide some support, along with multiple support touch-points in the $138-139 support zone.
All eyes will be on how strong the 50 DMA & consolidation range that GOOGL stock spent most of the last 6 months of the year in holds up as a support level, as otherwise only the $135.15 & $133.74 price levels are providing support until there is a zone with multiple touch-points at $129/share.
Their Average True Range shot through the roof yesterday, as there had been limited volatility for the prior week or two as prices climbed relatively slowly & without much volatility.
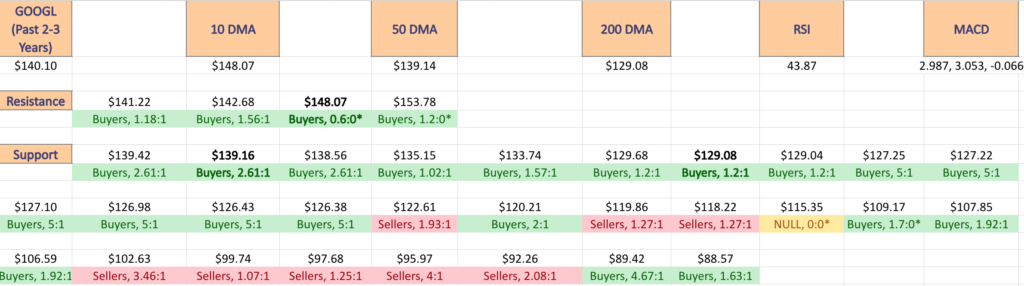
The following section leads off with an image showing all of their current support & resistance levels, as well as the ratio of Buyers:Sellers (or vice-versa) at each price level over the past 2-3 years.
Below that is a table that outlines all of the individual price levels with their ratios, as well as a text list version where the support/resistance levels are noted in bold.
Price Level:Volume Sentiment Analysis For Alphabet Inc. GOOGL Stock
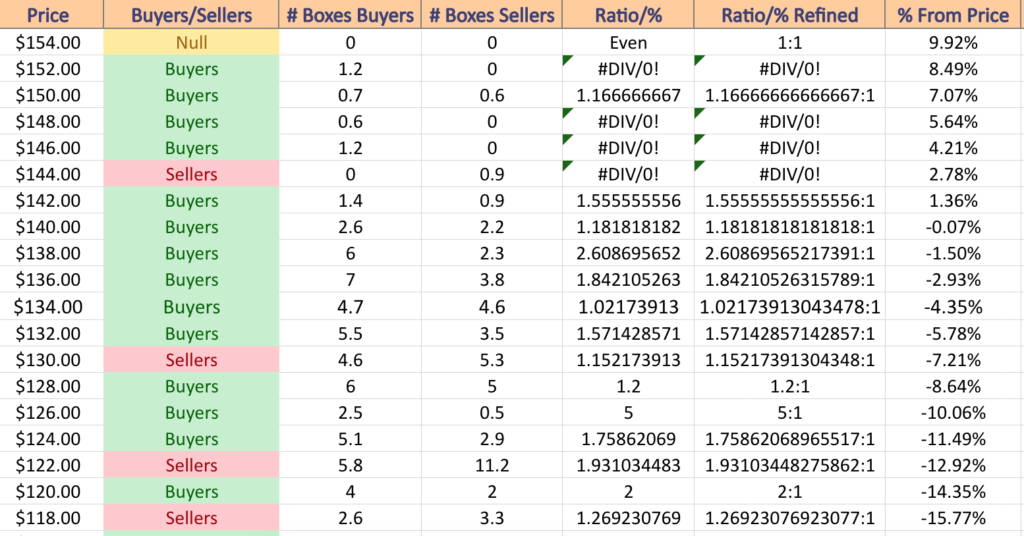
$154 – NULL – 0:0*; +9.92% From Current Price Level
$152 – Buyers – 1.2:0*; +8.49% From Current Price Level
$150 – Buyers – 1.17:1; +7.07% From Current Price Level
$148 – Buyers – 0.6:0*; +5.64% From Current Price Level – 10 Day Moving Average*
$146 – Buyers – 1.2:0*; +4.21% From Current Price Level
$144 – Sellers – 0.9:0*; +2.78% From Current Price Level
$142 – Buyers – 1.56:1; +1.36% From Current Price Level
$140 – Buyers – 1.18:1; -0.07% From Current Price Level – Current Price Box*
$138 – Buyers – 2.61:1; -1.5% From Current Price Level – 50 Day Moving Average*
$136 – Buyers – 1.84:1; -2.93% From Current Price Level
$134 – Buyers – 1.02:1; -4.35% From Current Price Level
$132 – Buyers – 1.57:1; -5.78% From Current Price Level
$130 – Sellers – 1.15:1; -7.21% From Current Price Level
$128 – Buyers – 1.2:1; -8.64% From Current Price Level – 200 Day Moving Average*
$126 – Buyers – 5:1; -10.06% From Current Price Level
$124 – Buyers – 1.76:1; -11.49% From Current Price Level
$122 – Sellers – 1.93:1; -12.92% From Current Price Level
$120 – Buyers – 2:1; -14.35% From Current Price Level
$118 – Sellers – 1.27:1; -15.77% From Current Price Level
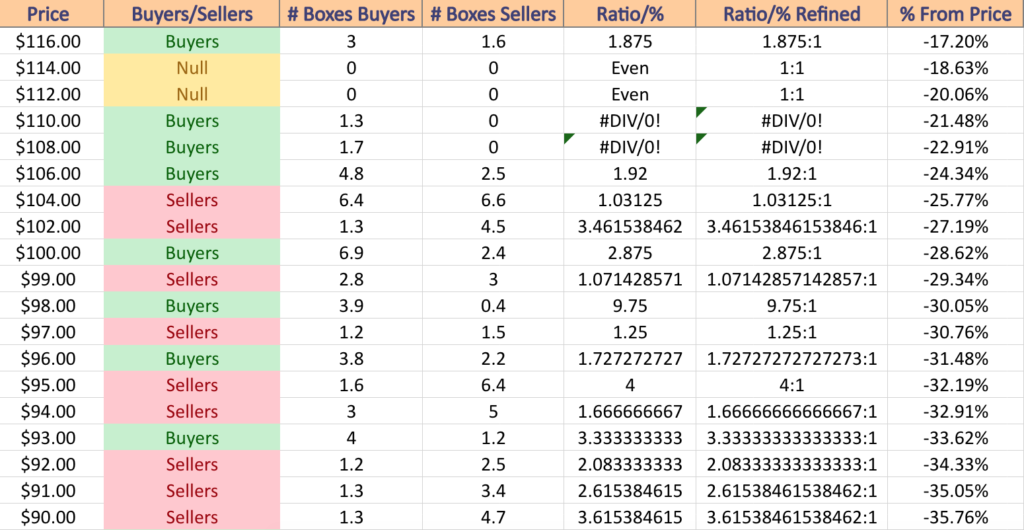
$116 – Buyers – 1.88:1; -17.2% From Current Price Level
$114 – NULL – 0:0*; -18.63% From Current Price Level
$112 – NULL – 0:0*; -20.06% From Current Price Level
$110 – Buyers – 1.3:0*; -21.48% From Current Price Level
$108 – Buyers – 1.7:0*; -22.91% From Current Price Level
$106 – Buyers – 1.92:1; -24.34% From Current Price Level
$104 – Sellers – 1.03:1; -25.77% From Current Price Level
$102 – Sellers – 3.46:1; -27.19% From Current Price Level
$100 – Buyers – 2.88:1; -28.62% From Current Price Level
$99 – Sellers – 1.07:1; -29.34% From Current Price Level
$98 – Buyers – 9.75:1; -30.05% From Current Price Level
$97 – Sellers – 1.25:1; -30.76% From Current Price Level
$96 – Buyers – 1.73:1; -31.48% From Current Price Level
$95 – Sellers – 4:1; -32.19% From Current Price Level
$94 – Sellers – 1.67:1; -32.91% From Current Price Level
$93 – Buyers – 3.33:1; -33.62% From Current Price Level
$92 – Sellers – 2.08:1; -34.33% From Current Price Level
$91 – Sellers – 2.62:1; -35.05% From Current Price Level
$90 – Sellers – 3.62:1; -35.76% From Current Price Level
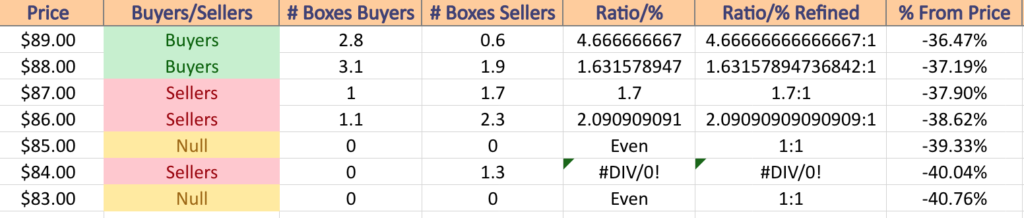
$89 – Buyers – 4.67:1; -36.47% From Current Price Level
$88 – Buyers – 1.63:1; -37.19% From Current Price Level
$87 – Sellers – 1.7:1; -37.9% From Current Price Level
$86 – Sellers – 2.09:1; -38.62% From Current Price Level
$85 – NULL – 0:0*; -39.33% From Current Price Level
$84 – Sellers – 1.3:0*; -40.04% From Current Price Level
$83 – NULL – 0:0*; -40.76% From Current Price Level
*** I DO NOT OWN SHARES OR OPTIONS CONTRACT POSITIONS IN GOOGL STOCK AT THE TIME OF PUBLISHING THIS ARTICLE ***