SPY, the SPDR S&P 500 ETF gained +1.88% over the past week, as the largest U.S. stocks & A.I. related names continued to show strength over the past week.
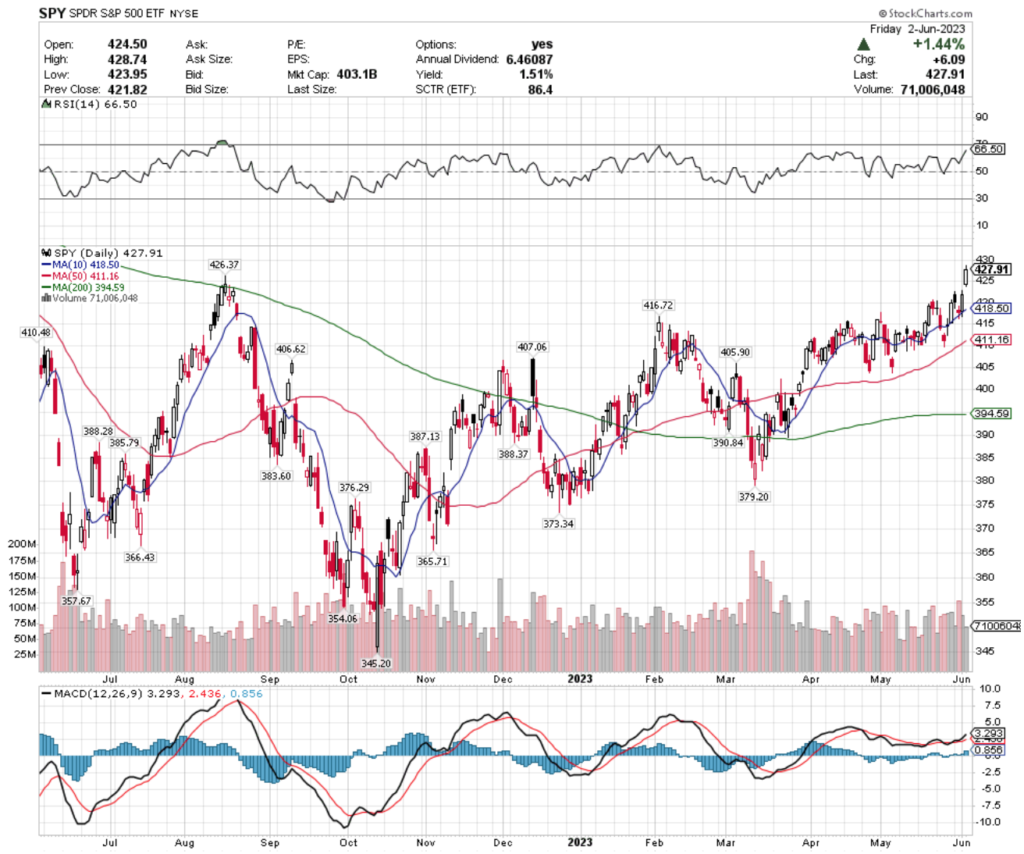
Their RSI is approaching overbought territory at 66.5, with healthy volume all week with the exception of Friday’s session, which was a +1.44% gap up.
Their MACD is still bullish, however, their $426.37/share support level will be a key mark to watch next week, as they try to not fill in Friday’s gap.
SPY has support a the $426.37 (Volume Sentiment: Sellers, 1.24:1), $418.50 (10 day moving average; Volume Sentiment: 1.33:1) , $416.72 (Volume Sentiment: 1.33:1) & $410.48/share (Volume Sentiment: Sellers, 1.57:1) price levels, with resistance overhead at the $438.53 (Volume Sentiment: Sellers, 1.32:1), $442.12 (Volume Sentiment: Sellers, 1.35:1) , $449.09 (Volume Sentiment: Buyers, 1.89:1) & $454.37/share (Volume Sentiment: Sellers, 1.25:1)
QQQ, the Invesco QQQ Trust ETF added +1.79% over the past week, but closed on a spinning top candle, which was an odd twist to the week, as suddenly the low-volume spinning top Friday showed there is some hesitancy & uncertainty after a week & a half of strong performance for NASDAQ names.
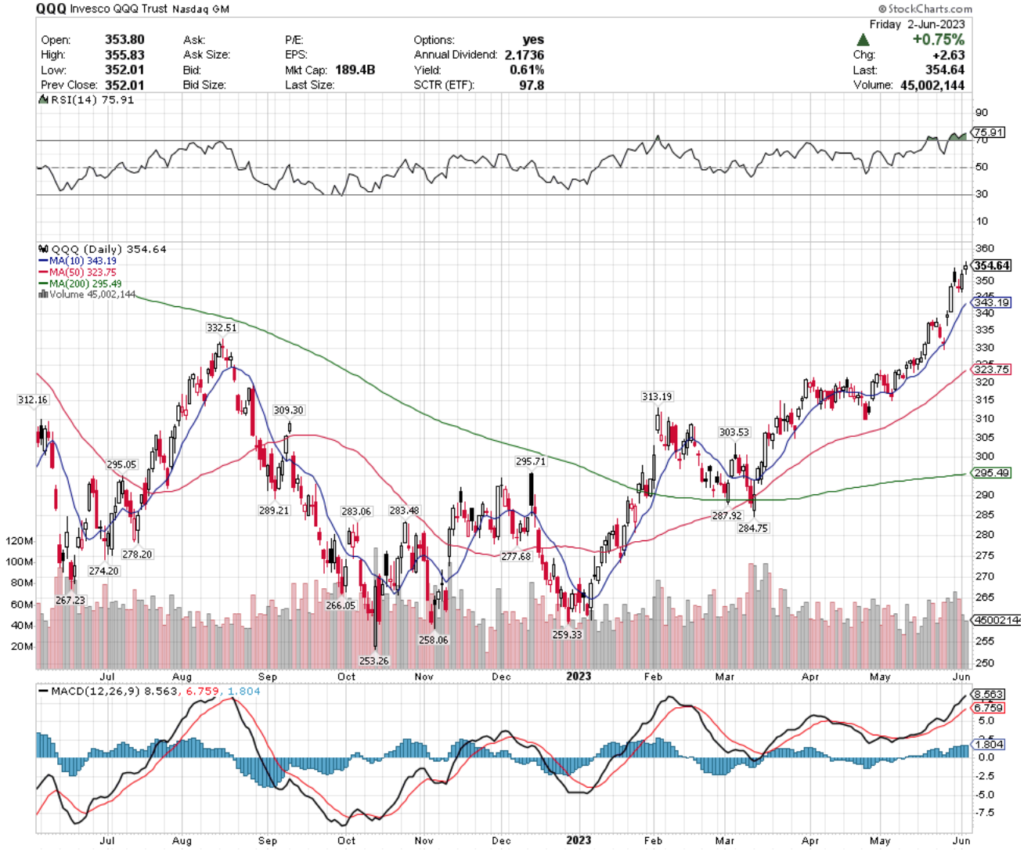
Their RSI has gone into overbought territory following Monday’s session & is currently at 75.91, with strong volume all week with the exception of Thursday & Friday.
QQQ’s MACD is also bullish, but Friday’s session’s spinning top on a +0.75% day signals that there is uncertainty in the strength of their near-term performance.
QQQ has support at the $343.19 (10 Day Moving Average; Volume Sentiment: Sellers, 1.2:1), $332.51 (Volume Sentiment: Sellers, 3.2:1), $323.75 (50 Day Moving Average; Volume Sentiment: Sellers, 2:1) & $313.19/share (Volume Sentiment: 1.55:1), with resistance at the $368.99 (Volume Sentiment: Buyers, 0.75:0*), $375.07 (Volume Sentiment: Sellers, 1:0*), $378.49 (Volume Sentiment: Buyers, 1.33:1) & $401.00/share (Volume Sentiment: NULL, 0:0*) price levels.
IWM, the iShares Russell 2000 ETF fared the best this past week, climbing +3.3%, as small cap names also showed strength alongside the mega-cap names that dominated the week’s headlines.
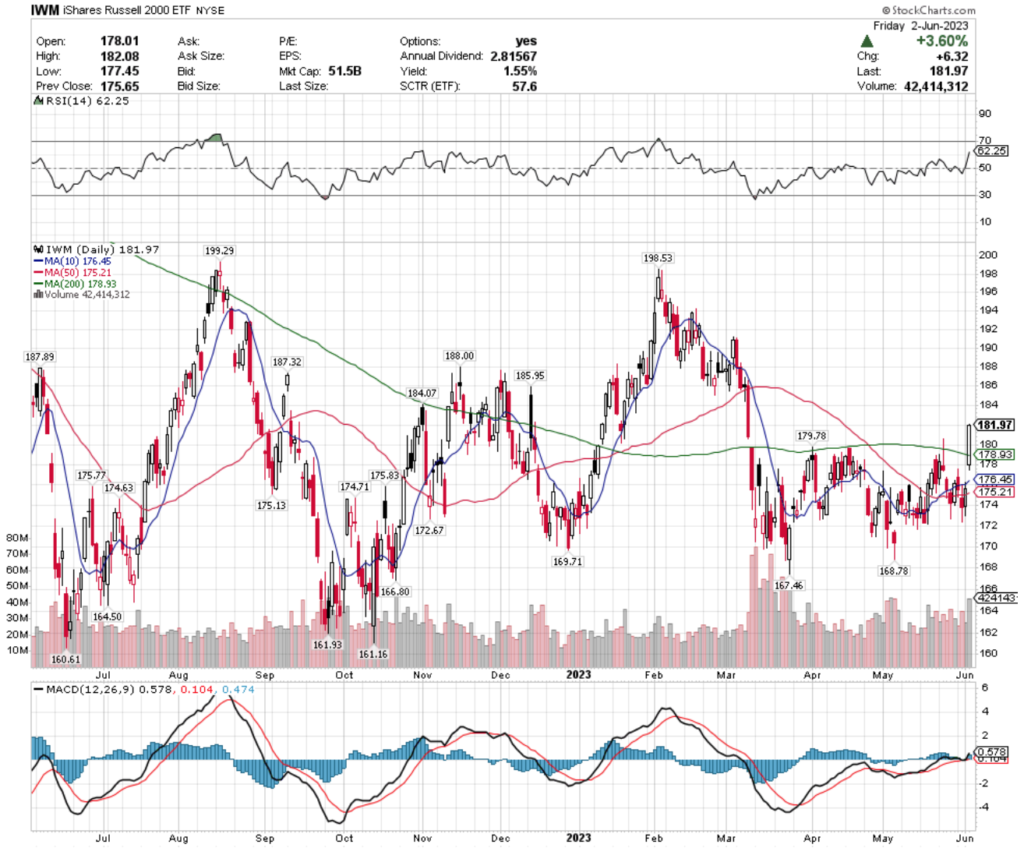
Their RSI has remained the most tame, but is still approaching overbought conditions at 62.25, with Friday’s volume being the strongest of the week on their +3.6% gap up session.
Their MACD is bullish, but their 200 & 10 day moving averages will be the main places to watch next week, as they fall within the range of Friday’s gap & will be the primary support for keeping it from filling.
IWM has support at the $179.78 (Volume Sentiment: Buyers, 1.84:1), $178.93 (200 Day Moving Average; Volume Sentiment: Buyers, 1.84:1), $176.45 (10 Day Moving Average; Volume Sentiment: Sellers, 1.06:1) & $175.83/share (Volume Sentiment: Buyers, 1.45:1) price levels, with resistance at the $184.07 (Volume Sentiment: Buyers, 1.75:1), $185.95 (Volume Sentiment: Buyers, 1.75:1), $187.32 (Volume Sentiment: Buyers, 1.91:1 ) & $187.89/share (Volume Sentiment: Buyers, 1.91:1) price levels.
Let’s dive into some of the best & worst performing sectors, industries & geo-locations in the market now, based on our technical analysis ratings of their respective ETFs!
South Korea (KORU), Greece (GREK), Russell 1000 (IWB) & Industrials Momentum Stocks (PRN) Are All Bullishly Leading The Market
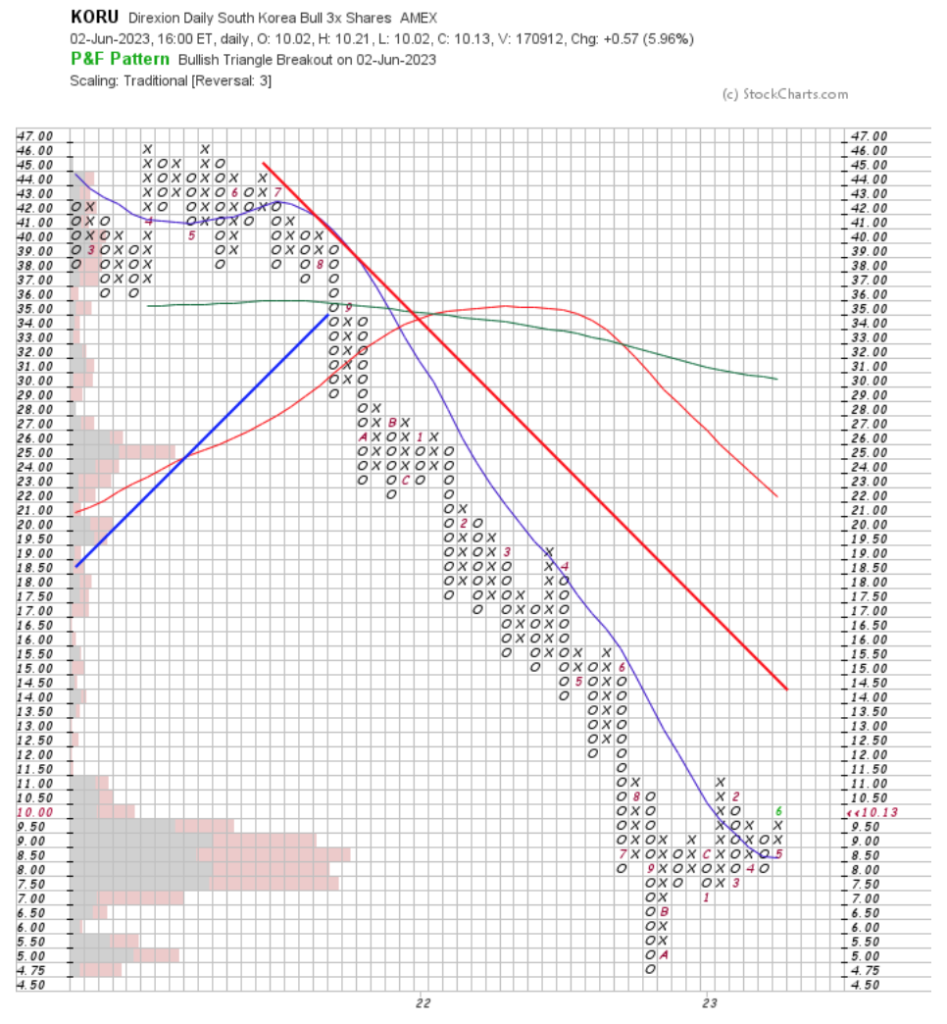
KORU, the Direxion Daily South Korea Bull 3x Shares ETF has fallen -38.05% over the past year, but rebounded a remarkable +109.65% from their 52-week low in October of 2022 (ex-distributions), to close at $10.13/share (Volume Sentiment: Sellers, 1.32:1).
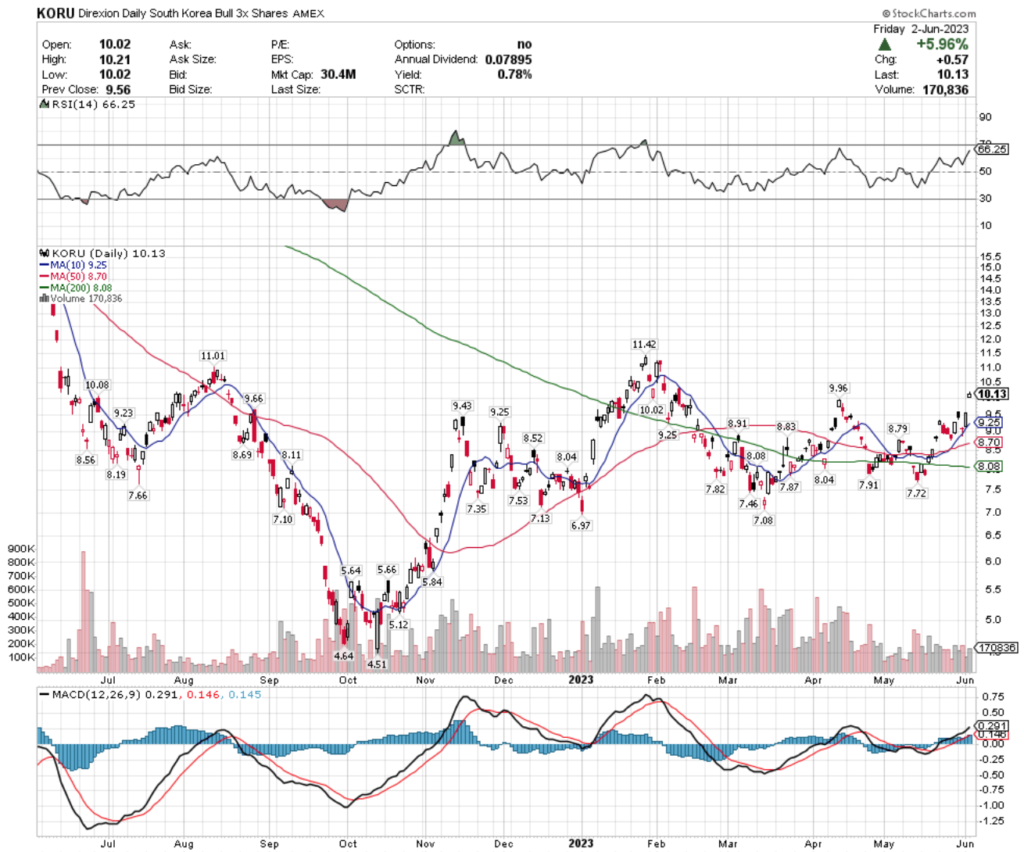
Their RSI is approaching overbought territory at 66.25, with below average volume over the past week, signaling uncertainty among investors.
Their MACD is still pointing bullishly, but Friday’s candlestick confirms the uncertainty implied by the week’s volume, with the open & the close taking place in a very narrow range.
Investors thinking about entering a position in KORU would be best suited to watch their behavior around support levels in the near-term, to find a target entry level for when the market has returned into an uptrend.
Their 0.78% distribution yield will not provide much cushion against losses, highlighting the importance of having an defensive insurance policy at play, such as buying puts or selling calls.
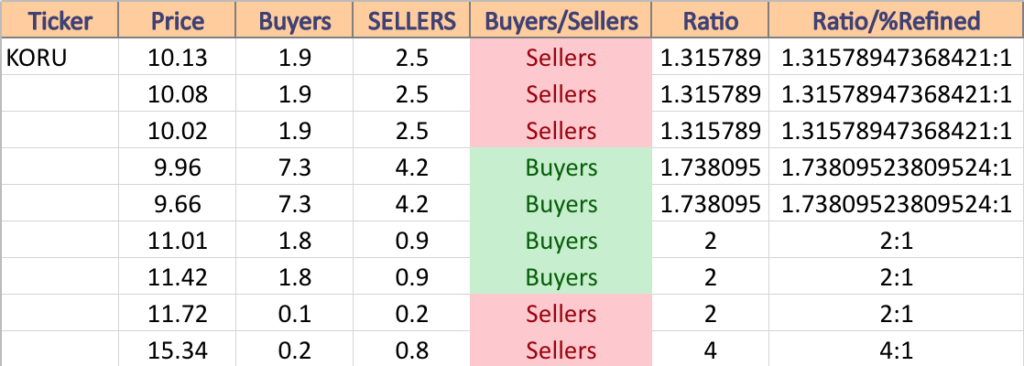
KORU has support at the $10.08 (Volume Sentiment: Sellers, 1.32:1), $10.02 (Volume Sentiment: Sellers, 1.32:1), $9.96 (Volume Sentiment: Buyers, 1.74:1) & $9.66/share (Volume Sentiment: Buyers, 1.74:1) price levels, with resistance at the $11.01 (Volume Sentiment: Buyers, 2:1), $11.42 (Volume Sentiment: Buyers, 2:1), $11.72 (Volume Sentiment: Sellers, 2:1) & $15.34/share (Volume Sentiment: Sellers, 4:1) price levels.
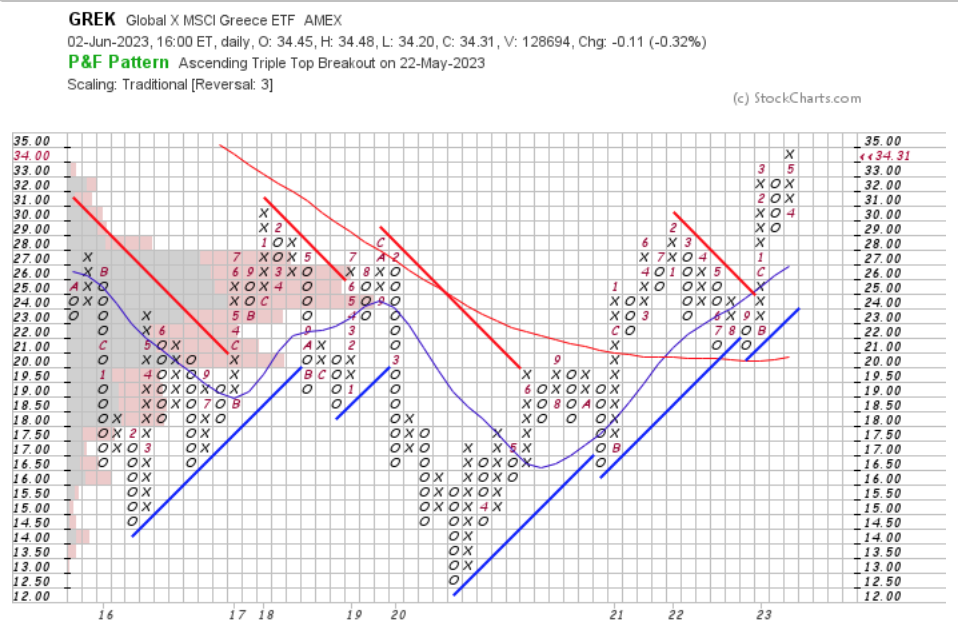
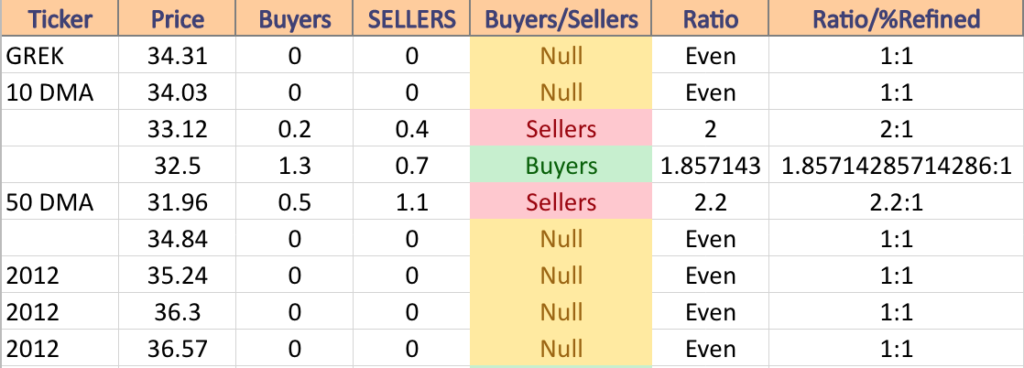
GREK, the Global X MSCI Greece ETF has improved +31.03% over the past year, but climbed +65.96% from their 52-week low in September of 2022 (ex-distributions) to close at $34.31/share (Volume Sentiment: Even, 1:1).
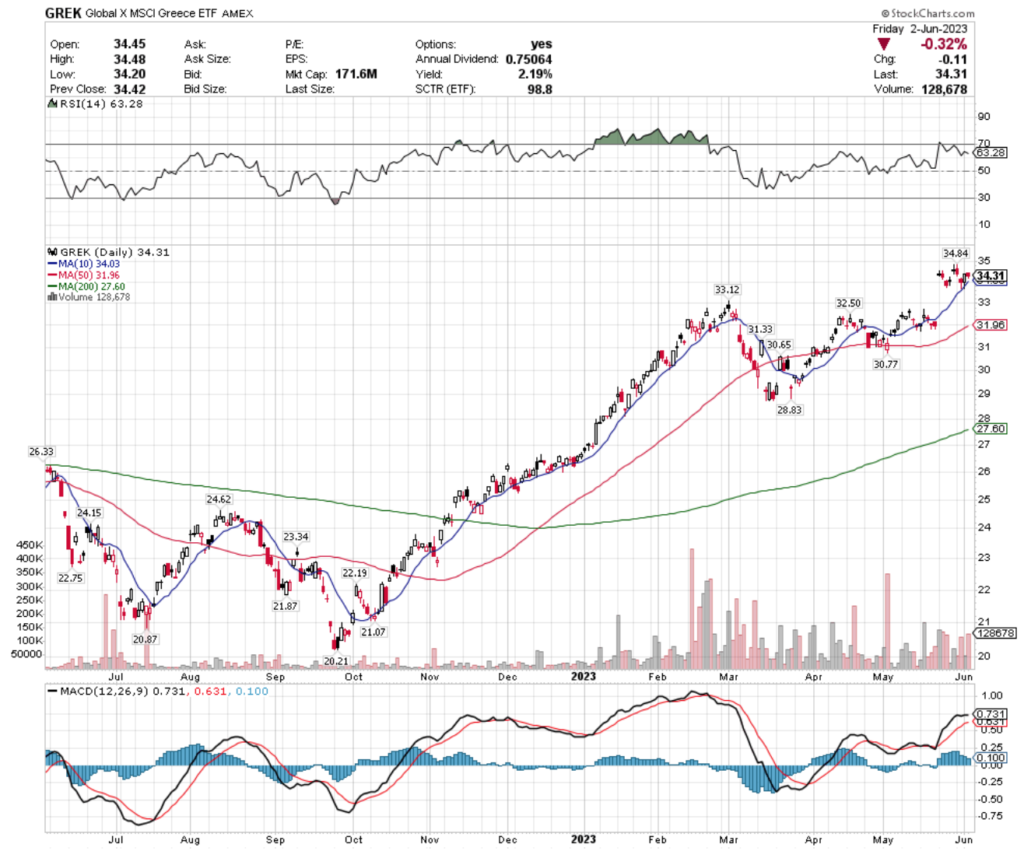
Their RSI has retreated slightly from the verge of overbought conditions during the past week, after their gap up on 5/22/2023, with last week’s volume being above average on selling sessions, but underwhelming on the positive days.
Their MACD has begun to curl over bearishly & a bearish crossover looks impending in the coming week, which is confirmed by the uncertainty seen in their candlesticks since the 5/22 gap up, where there are a couple of spinning tops & hanging men (and close but not quite hanging men), with most of the candles’ being contained in the range of Friday’s closing price.
While GREK offers a 2.19% distribution yield for long-term holders, this will have limited impact in terms of cushioning investors against losses, making it imperative to have an options strategy in place for loss protection in the near-term.
Investors should have their eyes peeled to see how they behave around support levels in the near-term, especially the 10 day moving average, as that is the last line of defense before they begin to refill the end of May gap mentioned prior.
GREK has support at the $34.03 (10 Day Moving Average; Volume Sentiment: Even, 1:1), $33.12 (Volume Sentiment: Sellers, 2:1), $32.50 (Volume Sentiment: Buyers, 1.86:1) & $31.96/share (50 Day Moving Average; Volume Sentiment: Sellers, 2.2:1) price levels, with resistance at the $33.84 (Volume Sentiment: Even, 1:1), $35.24 (Volume Sentiment: No Data, 2012 Level), $36.30 (Volume Sentiment: No Data, 2012 Level) & $36.57/share (Volume Sentiment: No Data, 2012 Level) price levels.
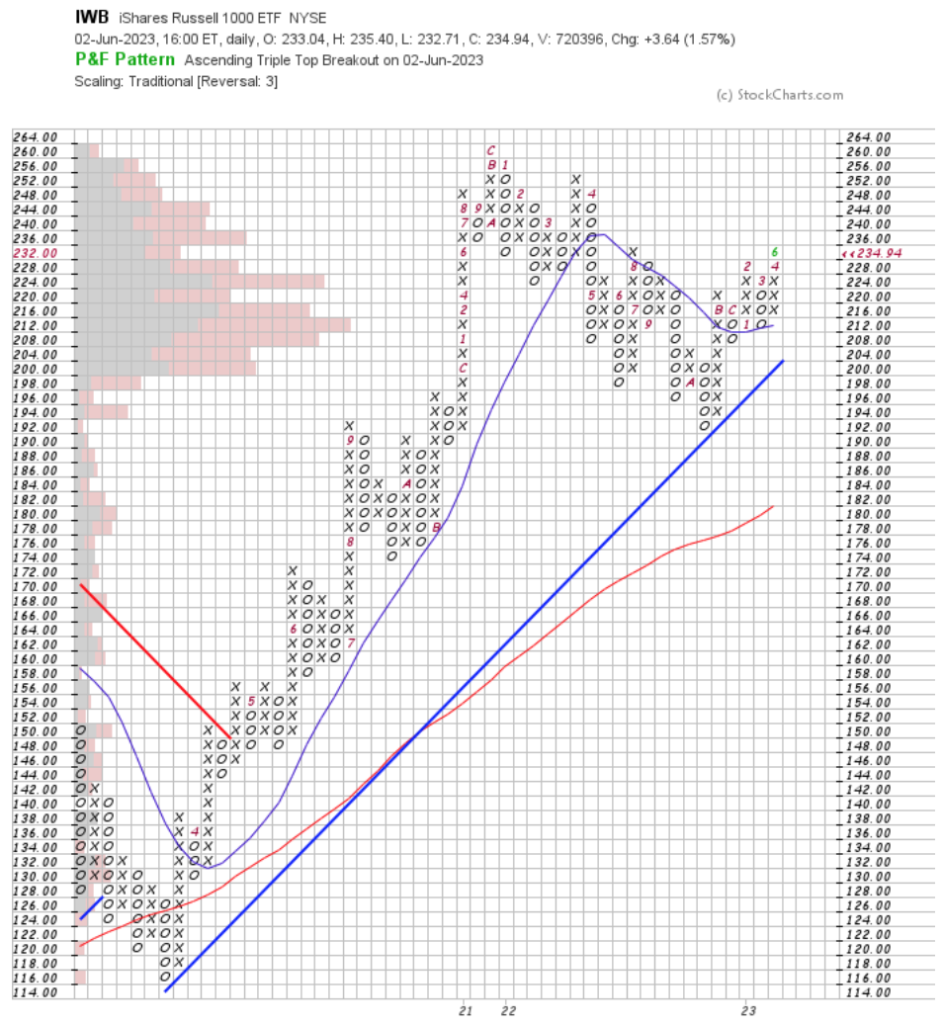
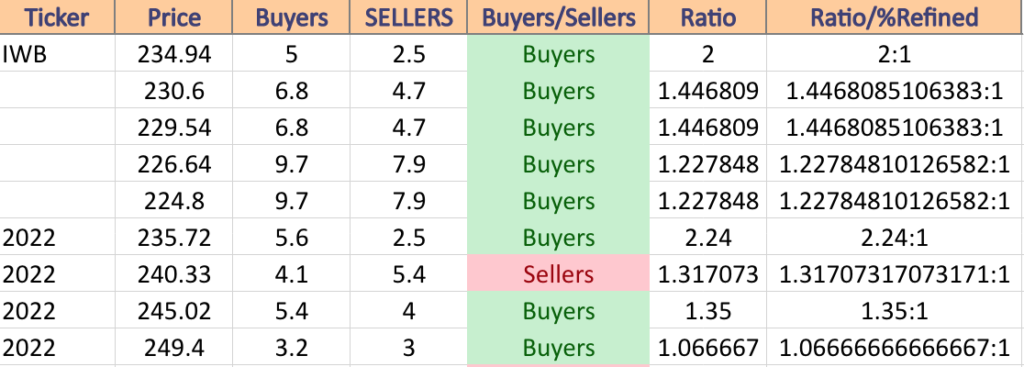
IWB, the iShares Russell 1000 ETF has gained +2.09% over the past year, while climbing +20.46% from their 52-week low in October of 2022 (ex-distributions) to close at $234.94/share (Volume Sentiment: Buyers, 2:1).
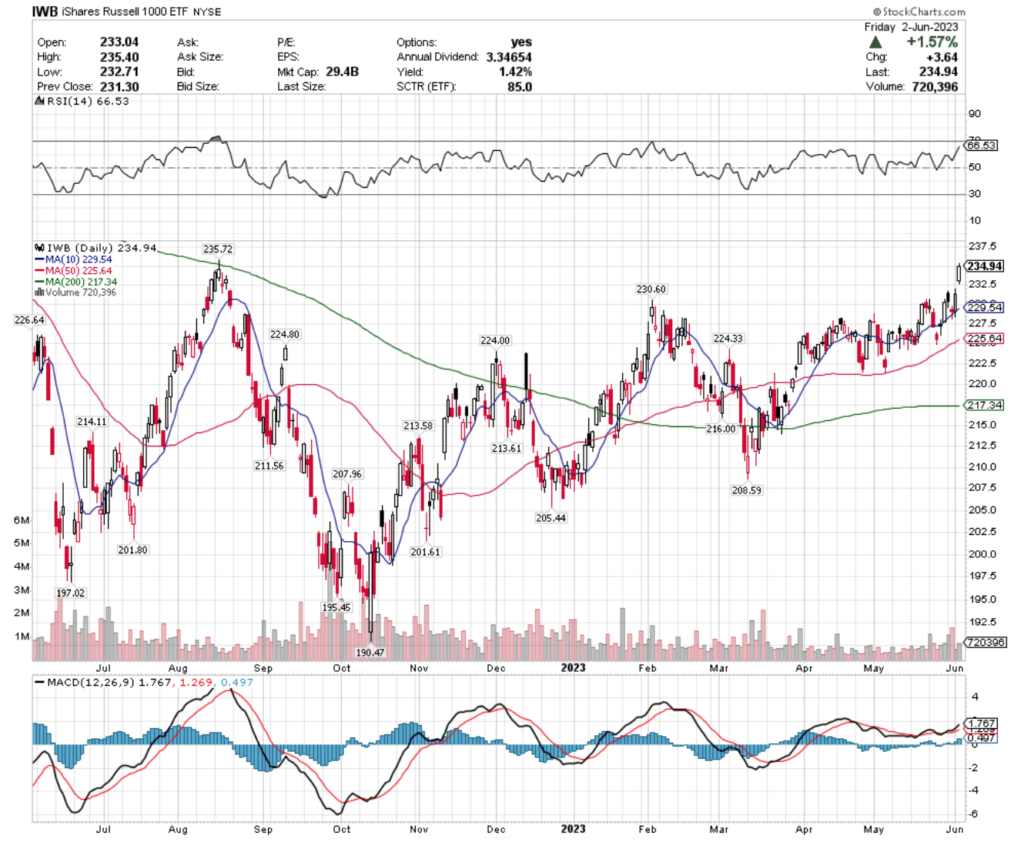
Their RSI is approaching overbought conditions at 66.53, with the past week’s volume levels being below average compared to the year prior (including on Friday’s +1.57% gap up session).
Their MACD is still bullish, but it will be interesting to see if they try to fill in the gap created at the end of last week.
With a 1.42% distribution yield for long-term holders, there is limited cushion against losses, calling for an options strategy to protect existing shareholders against near-term losses.
For those considering entering a position, it would be advised to watch how they behave in the coming weeks, especially around support levels that fall below Friday’s gap window.
IWB has support at the $230.60 (Volume Sentiment: Buyers, 1.45:1), $229.54 (Volume Sentiment: Buyers, 1.45:1), $226.64 (Volume Sentiment: Buyers, 1.23:1) & $224.80/share (Volume Sentiment (Buyers, 1.23:1), with resistance at the $235.72 (Volume Sentiment: Buyers, 2.24:1), $240.33 (Volume Sentiment: Sellers, 1.32:1), $245.02 (Volume Sentiment: Buyers, 1.35:1) & $249.40/share (Volume Sentiment: Buyers, 1.07:1) price levels.
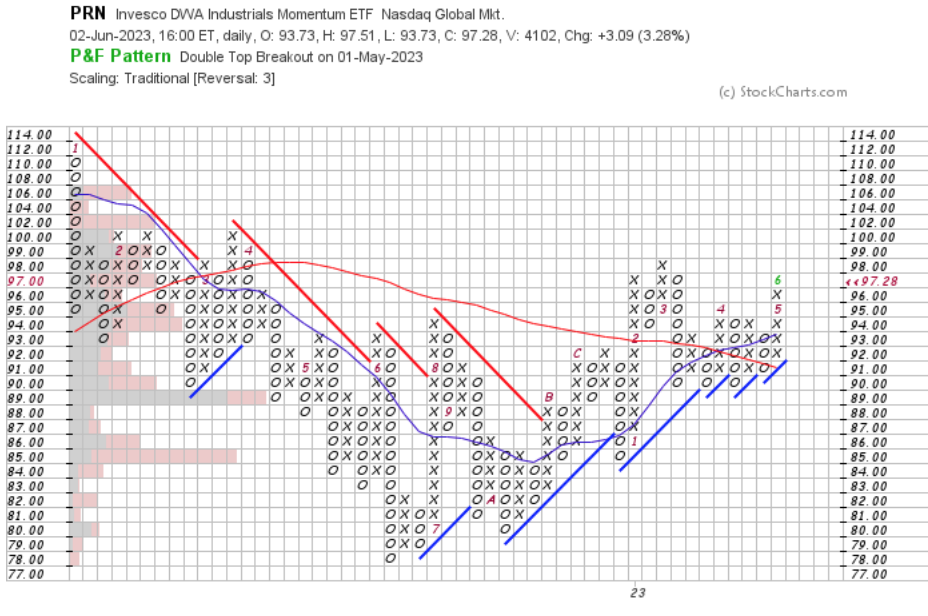
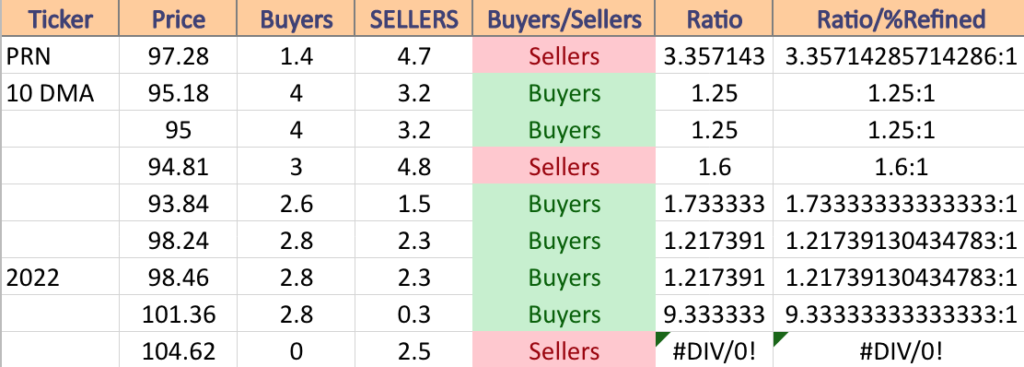
PRN, the Invesco DWA Industrials Momentum ETF has risen +2.52% over the past year, but has gained +19.65% since their 52-week low in June of 2022 (ex-distributions) to close at $97.28/share (Volume Sentiment: Sellers, 3.36:1).
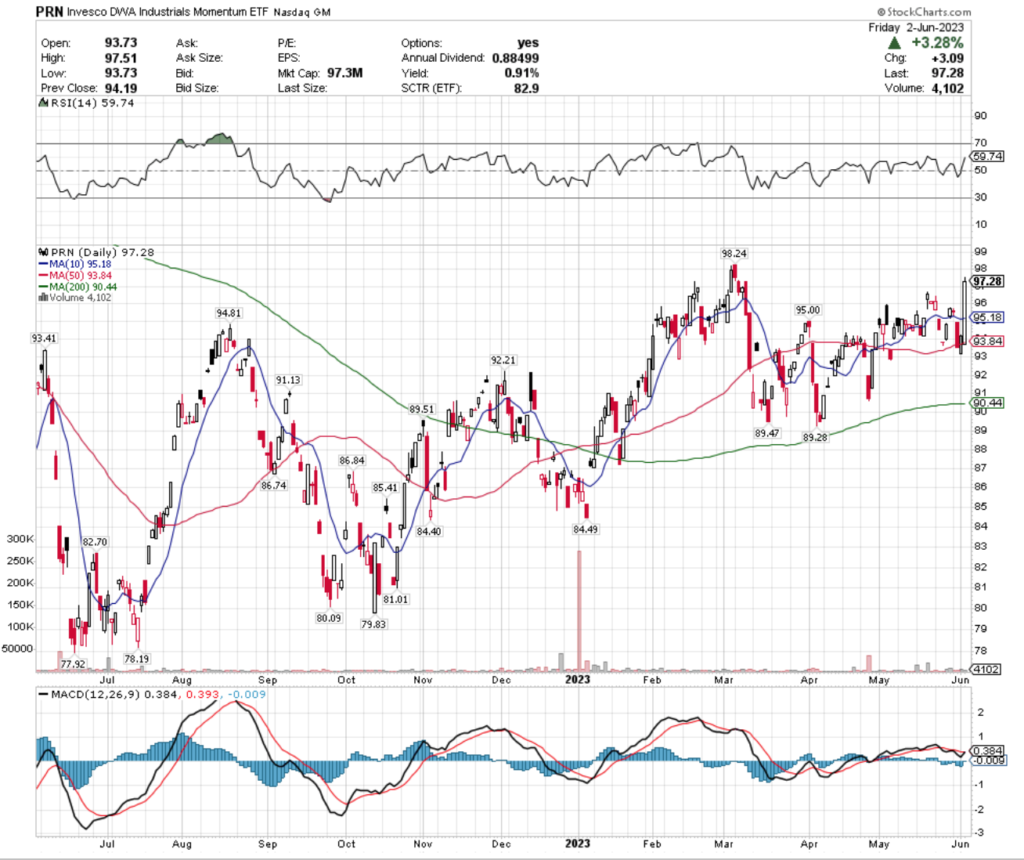
Their RSI is on the overbought end of neutral at 59.74, with slightly above average volume this past week.
Their MACD looks primed to cross over bullishly after Friday’s +3.28% session, which has one of the largest candle real body sizes of the year on their chart.
With only a 0.91% distribution yield for long-term holders, those who are not in the name yet may want to see how their 10 & 50 day moving averages hold up as support, as both fall within Friday’s candle’s real body, before watching how their other support levels behave to time an entry.
Existing holders would be wise to purchase some insurance in the form of options to protect their holdings from losses, while generating some additional money for when the market begins trending upwards again.
PRN has support at the $95.18 (10 Day Moving Average; Volume Sentiment: Buyers, 1.25:1), $95 (Volume Sentiment, 1.25:1), $94.81 (Volume Sentiment: Sellers, 1.6:1) & $93.84/share (Volume Sentiment: 1.73:1) price levels, with resistance at the $98.24 (Volume Sentiment: Buyers, 1.22:1), $98.46 (Volume Sentiment: Buyers, 1.22:1), $101.36 (Volume Sentiment, Buyers, 9.33:1) & $104.62/share (Volume Sentiment, Sellers, 0.25:0*) price levels.
North American Natural Resources (NANR), Pharmaceuticals (XPH), Metals & Mining (XME) & Global Energy (IXC) Are All Bearishly Lagging The Market
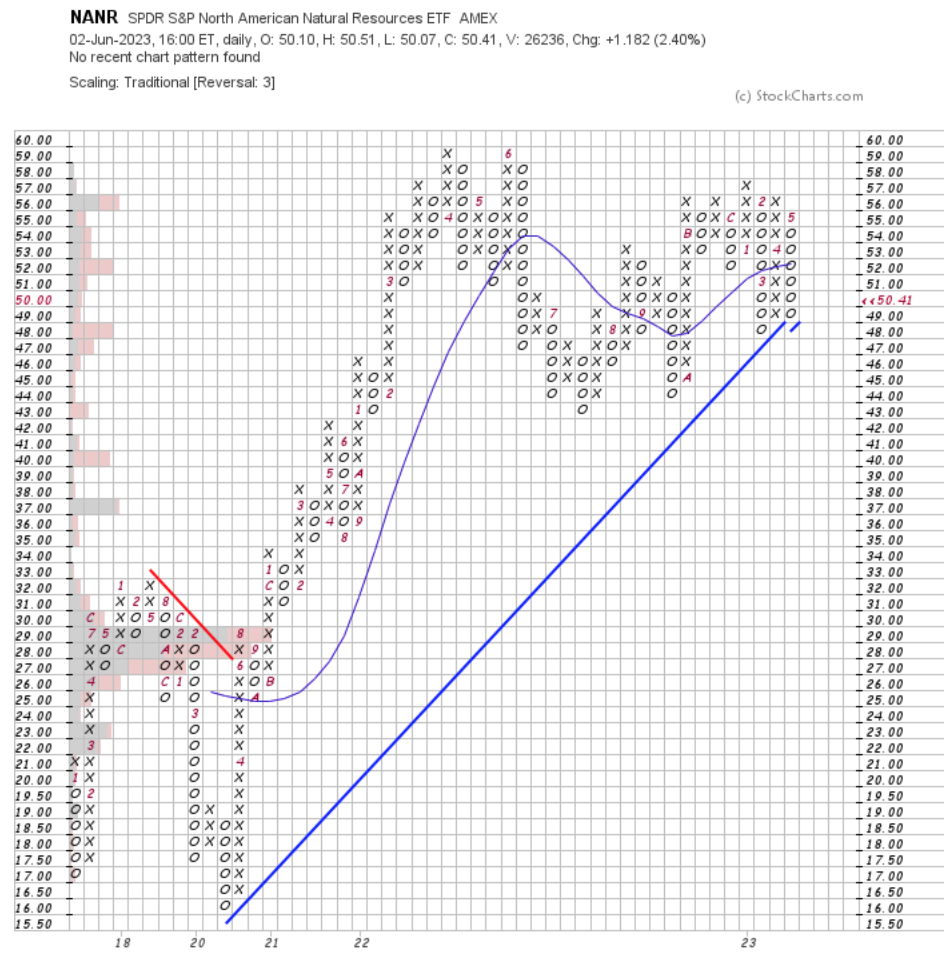
NANR, the SPDR S&P North American Natural Resources ETF has declined -15.08% over the past year, falling -19.21% from their 52-week high in June of 2022, while regaining +11.8% from their 52-week low of July 2022 (ex-distributions) to close at $50.41/share (Volume Sentiment:Buyers, 2:1).
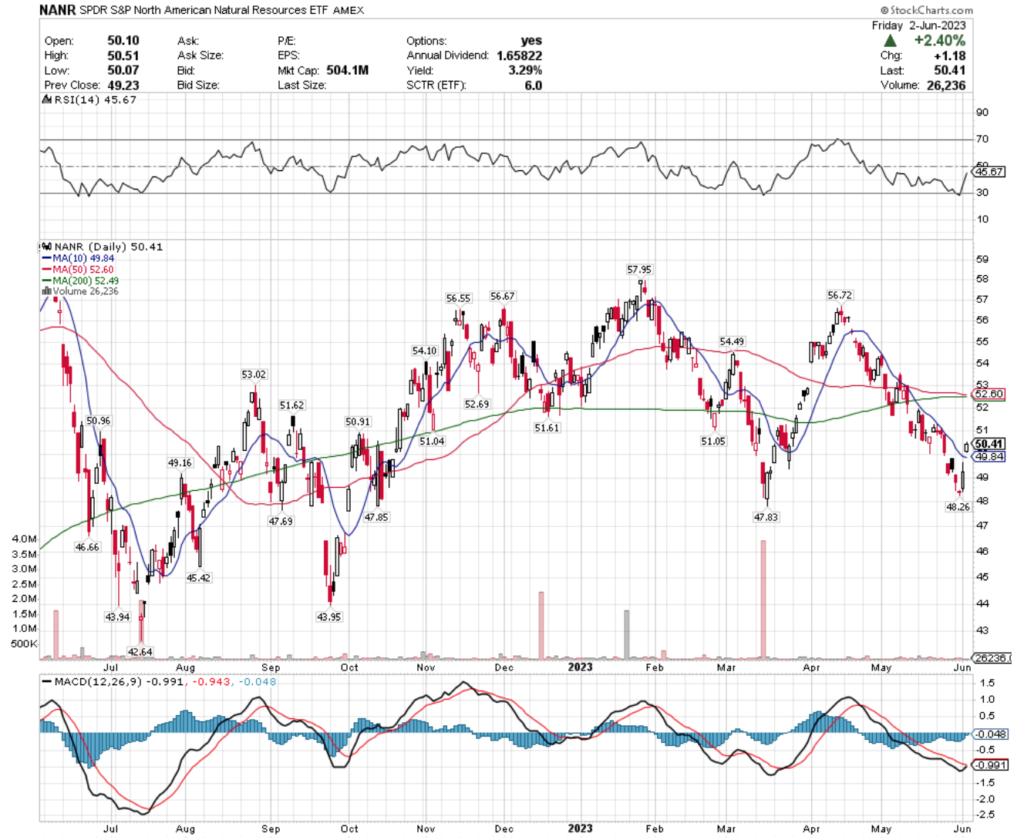
Their RSI is approaching the neutral level of 50 (currently at 45.67), after being in oversold conditions following their most recent selloff.
Friday’s gap up created a bullish MACD crossover, but recent trading volumes have been below average, putting Friday’s 2.4% gap up session in question in terms of a signal of strength.
While they offer a 3.29% distribution yield to long-term holders, an insurance position using options would be best advised in the near-term, while waiting to see how their price holds up at support levels.
The 10 day moving average in particular will be of interest, as it is at the beginning of the window created by Friday’s gap & will act as the gatekeeper that determines whether or not they will continue to decline through filling it or not.
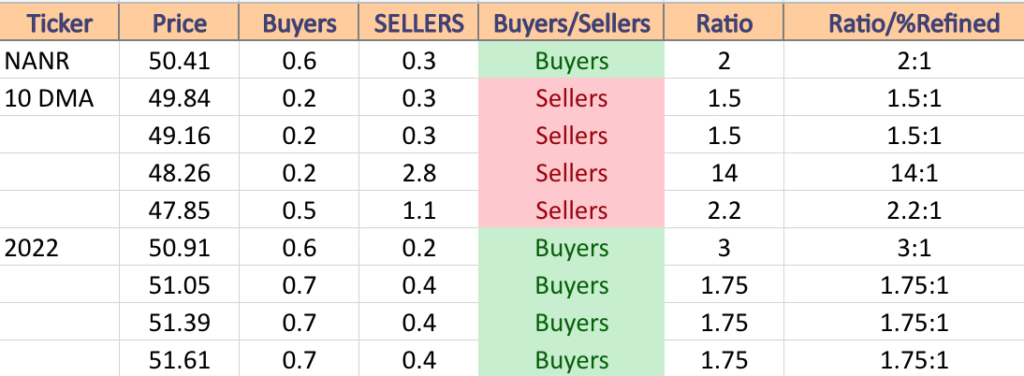
NANR has support at the $49.84 (10 Day Moving Average; Volume Sentiment: Sellers, 1.5:1), $49.16 (Volume Sentiment: Sellers, 1.5:1), $48.26 (Volume Sentiment: Sellers, 14:1) & $47.85/share (Volume Sentiment: Sellers, 2.2:1), with resistance at the $50.91 (Volume Sentiment: Buyers, 3:1), $51.05 (Volume Sentiment: Buyers, 1.75:1), $51.39 (Volume Sentiment: Buyers, 1.75:1) & $51.61/share (Volume Sentiment: Buyers, 1.75:1) price levels.
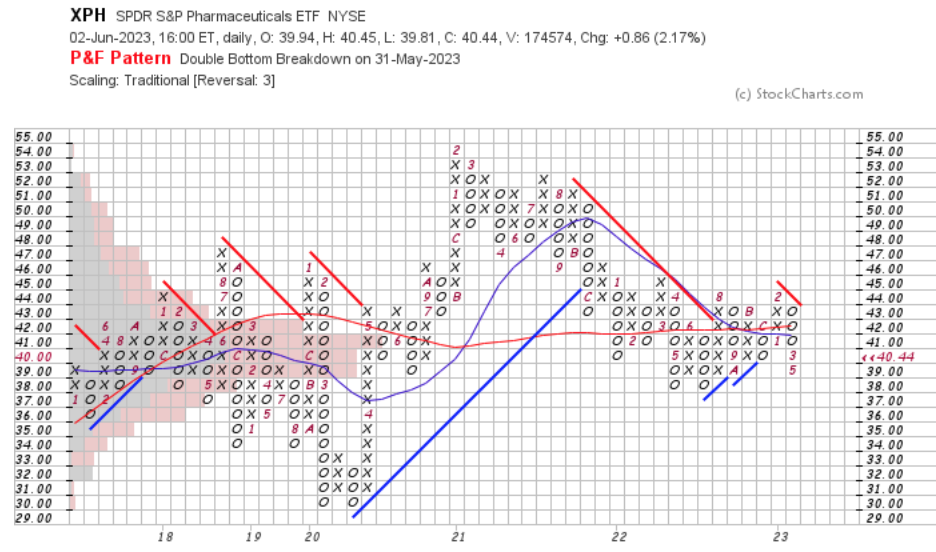
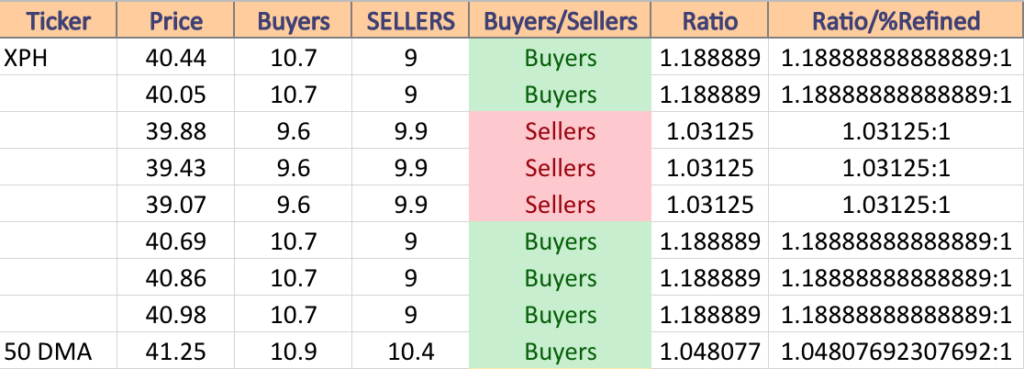
XPH, the SPDR S&P Pharmaceuticals ETF has lost -4.1% over the past year, losing -11.73% from their 52-week high in August of 2022, while recovering +3.67% from their 52-week low in June of 2022 (ex-distributions) to close at $40.44/share (Volume Sentiment: Buyers, 1.19:1).
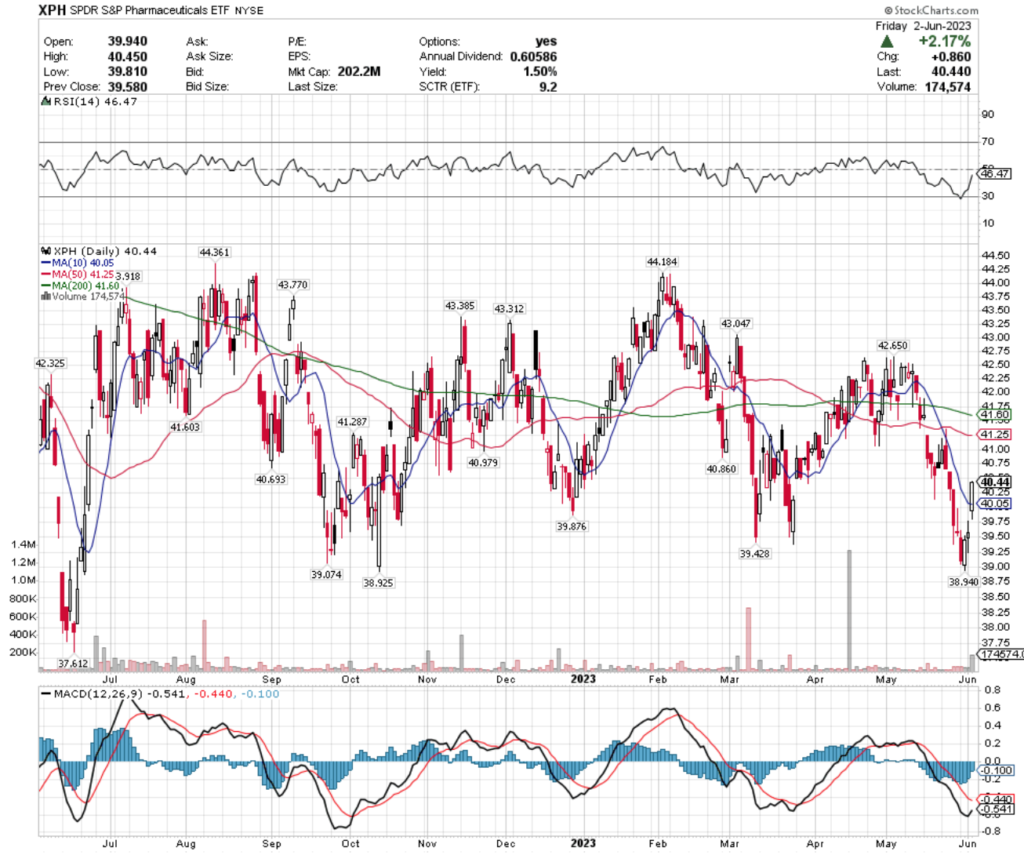
Their RSI is returning to the neutral level as well (currently at 46.47), after crossing into oversold territory a handful of sessions prior.
Their MACD is sharply bullish, after 3 straight advancing days, including Friday’s +2.17% gap up, with recent trading volumes being slightly above average compared to the year prior.
Thursday’s spinning top candle before Friday’s gap up also adds another layer of uncertainty into how strong the last 3 sessions were vs. how much of it was just broader market influence on an ETF that had recently been oversold on their RSI.
With a 1.5% distribution yield there is a small amount of cushion against losses for long-term holders, making an insurance policy important for the near-term.
With limited support levels between Friday’s window, it would not be prudent to enter a new position now, but watching how they behave at support levels on their descent will help investors figure out where they might want to enter once an upward trend begins.
XPH has support at the $40.05 (Volume Sentiment: Buyers 1.19:1), $39.88 (Volume Sentiment: Sellers, 1.03:1), $39.43 (Volume Sentiment: Sellers, 1.03:1) & $39.07/share (Volume Sentiment: Sellers, 1.03:1), with resistance at the $40.69 (Volume Sentiment: Buyers, 1.19:1), $40.86 (Volume Sentiment: Buyers, 1.19:1), $40.98 (Volume Sentiment: Buyers, 1.19:1) & $41.25/share (Volume Sentiment: Buyers, 1.05:1) price levels.
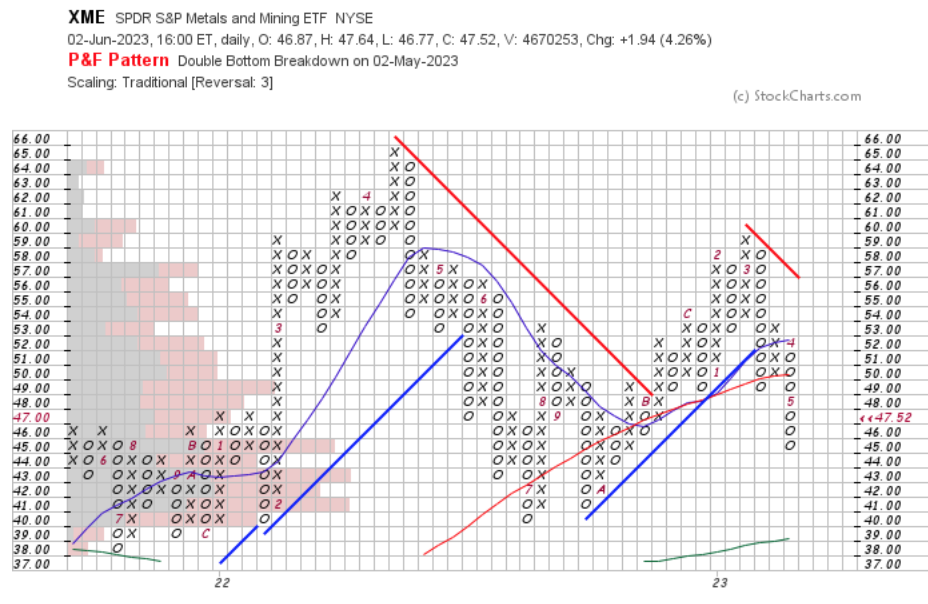
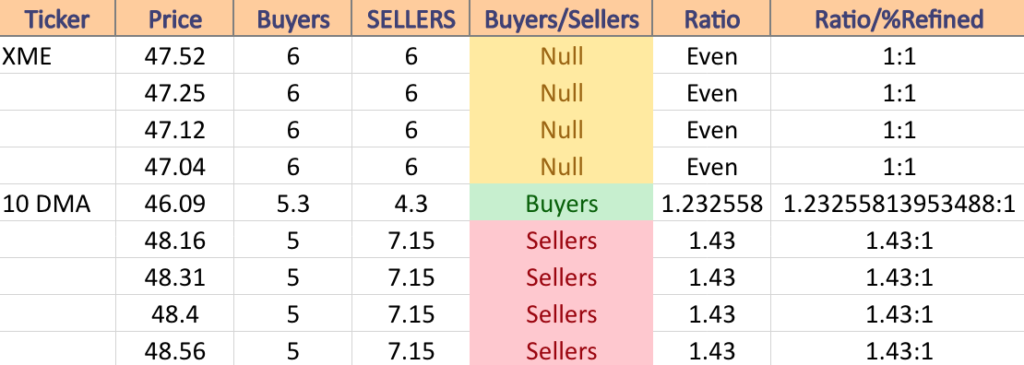
XME, the SPDR S&P Metals & Mining ETF has shed -5.25% over the past year, declining -20.7% from their 52-week high of March 2023, while reclaiming +17.95% from their 52-week low of July of 2022 (ex-distributions) to close at $47.52/share (Volume Sentiment: Even, 1:1).
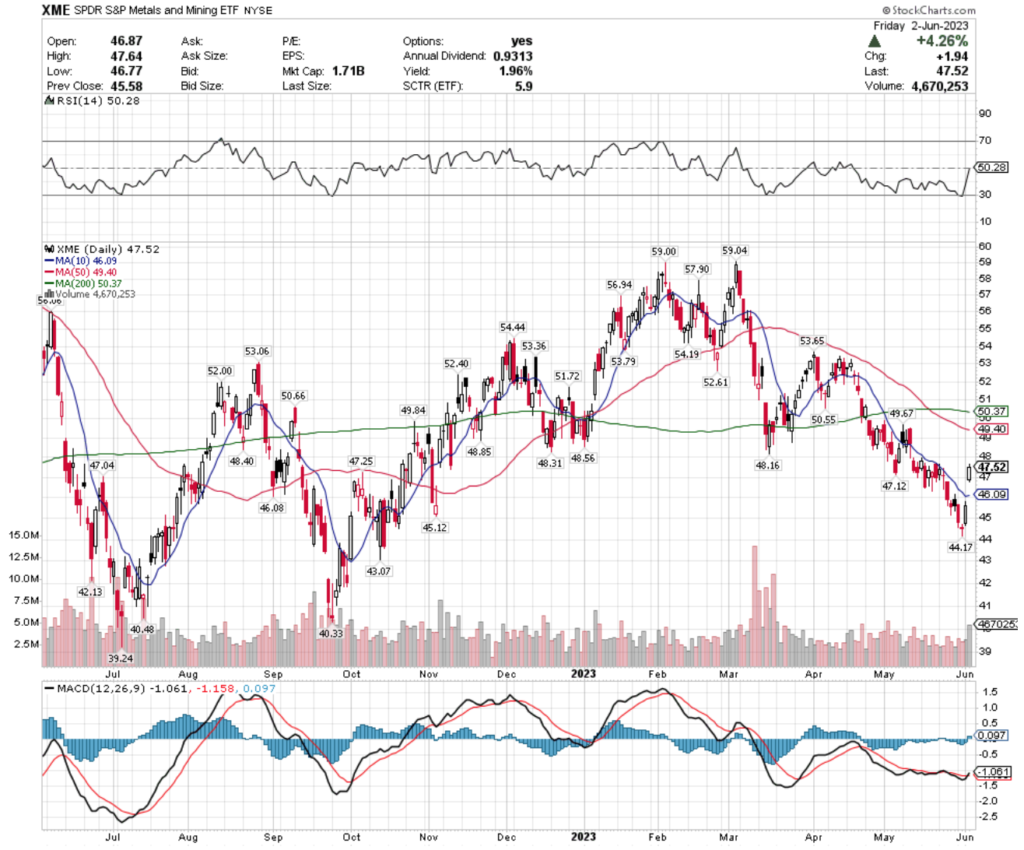
Their RSI is neutral at 50.28, but this past week’s volume was below average compared to the year prior, bringing questions about how sure investors were behind the +4.26% gap up during Friday’s session.
While their MACD has recently crossed bullish, there does not look to be enough enthusiasm among investors to take a position, until after seeing how they handle Friday’s gap & whether or not it begins to fill in the near-term.
While watching their support levels, there is a profit opportunity for traders looking to employ an options strategy to fundraise for buying more shares after the market begins an uptrend again.
XME has support at the $47.25 (Volume Sentiment: Even, 1:1), $47.12 (Volume Sentiment: Even, 1:1), $47.04 (Volume Sentiment: Even, 1:1) & $46.09/share (10 Day Moving Average; Volume Sentiment: Buyers, 1.23:1), with resistance at the $48.16 (Volume Sentiment: Sellers, 1.43:1), $48.31 (Volume Sentiment: Sellers, 1.43:1), $48.40 (Volume Sentiment: Sellers, 1.43:1) & $48.56/share (Volume Sentiment: Sellers, 1.43:1) price levels.
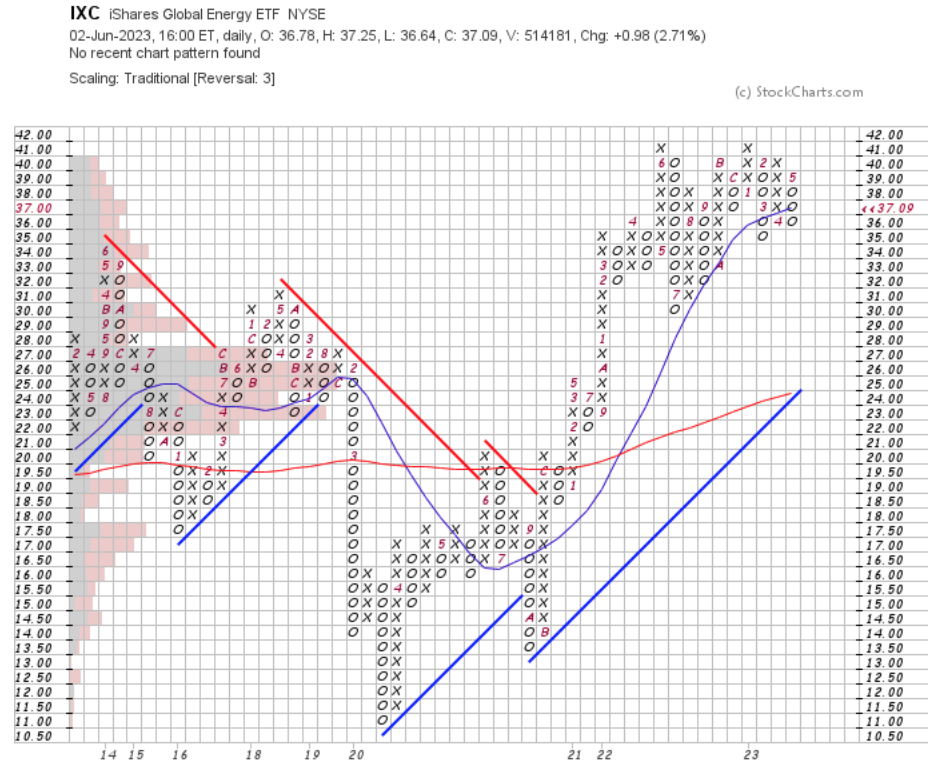
IXC, the iShares Global Energy ETF has lost -7.72% over the past year, losing -15.98% from their 52-week high in June of 2022, but notching +18.28% from their 52-week low in July of 2022 (ex-distributions) to close at $37.09/share (Volume Sentiment: Buyers, 1.11:1).
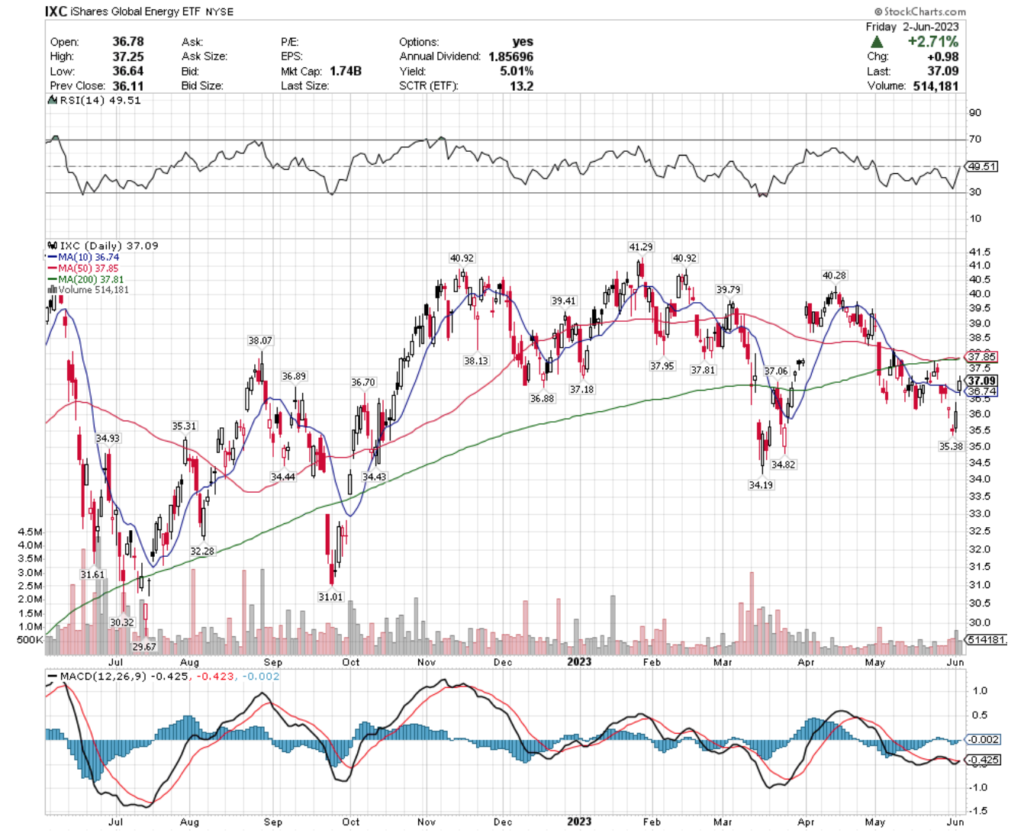
Their RSI is approaching the neutral 50 mark (currently at 49.51), with investors showing hesitance at these price levels, as volumes have been below average over the past week.
Their MACD looks set to crossover bullishly, but the 10 day moving average will be the main place to be watching, as that will act as the gatekeeper for the window created by Friday’s gap up.
Like the other names we’ve mentioned, this is another “wait & see” case for those who are not in positions actively & those that do not wish to sell their positions would be best suited with a protective options strategy in the meantime, while waiting for IXC to resume an uptrend.
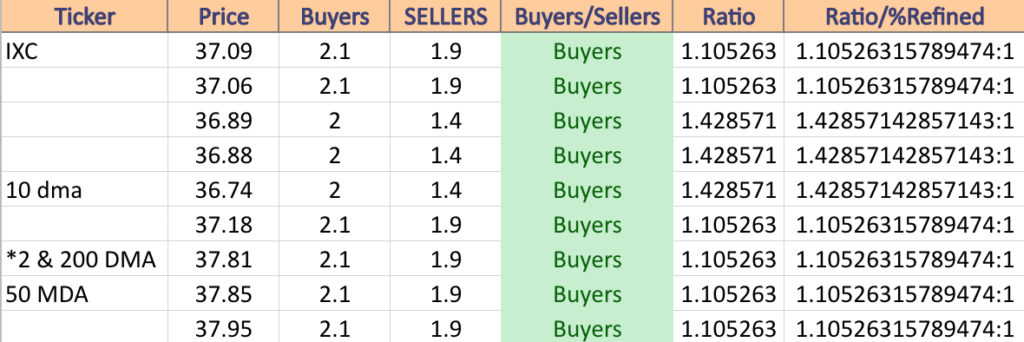
IXC has support at the $37.06 (Volume Sentiment: Buyers, 1.11:1), $36.89 (Volume Sentiment: Buyers, 1.43:1), $36.88 (Volume Sentiment: 1.43:1) & $36.74/share (10 Day Moving Average; Volume Sentiment: 1.43:1), with resistance at the $37.18 (Volume Sentiment: Buyers, 1.11:1), $37.81 (200 Day Moving Average & Additional Support Touchpoint on Chart; Volume Sentiment: Buyers, 1.11:1), $37.85 (50 Day Moving Average; Volume Sentiment: Buyers, 1.11:1) & $37.95/share (Volume Sentiment: Buyers, 1.11:1) price levels.
Tying It All Together & The Week Ahead
Next week is relatively quiet on the data front.
Monday kicks off with S&P U.S. Services PMI data at 9:45 am, followed by Factory Orders & ISM Services reports at 10 am.
GitLab & Science Applications will report earnings on Monday.
Tuesday currently has no scheduled data announcements.
Cracker Barrel Old Country Store is set to report earnings on Tuesday, along with Casey’s General, Dave & Buster’s, J.M. Smucker, Stitch Fix, Thor Industries & others.
U.S. Trade Deficit data is reported on Wednesday at 8:30 am, with Consumer Credit at 3pm.
Campbell Soup, Lovesac, Ollie’s Bargain Outlet, United Natural Foods & Verint Systems are some of the more notable earnings reports due out on Wednesday.
Thursday morning we get Initial Jobless Claims data at 8:30 am, with Wholesale Inventories data reported at 10 am.
Thursday’s earnings reports include DocuSign, Signet Jewelers, Designer Brands, FuelCell Energy, Toro & Vail Resorts.
Friday currently has no data scheduled for reporting & the most anticipated earnings report for the day will be from Nio.
See you back here next week!
*** I DO NOT OWN SHARES OR OPTIONS CONTRACT POSITIONS IN SPY, QQQ, IWM, KORU, GREK, IWB, PRN, NANR, XPH, XME, or IXC AT THE TIME OF PUBLISHING THIS ARTICLE ***