SPY, the SPDR S&P 500 ETF dipped -0.83% over the past week, performing better than the NASDAQ & Russell 2000, but underperforming the Dow Jones Industrial Average.
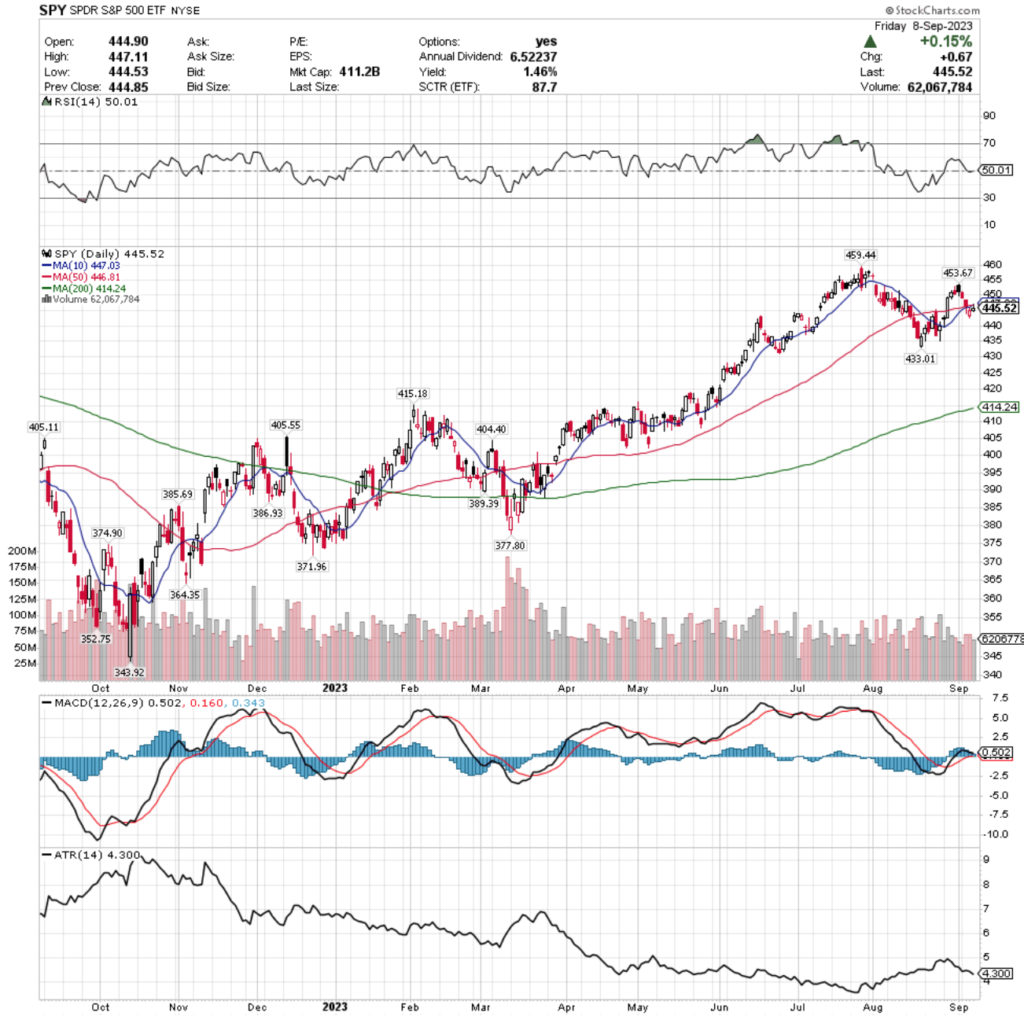
Their RSI is neutral at 50, but their MACD is beginning to crossover bearishly which will be something for investors to keep their eyes on.
SPY’s volume declined this past week -23.53% below the prior year’s average (64,484,950 vs. 84,325,501) signaling investor uncertainty & people trying to take profits off of the table after their recent run up at the end of August.
The week began on a sour note, with a new resistance level occurring at $453.67 on Monday’s session on a filled in green/black candlestick where price action favored being higher, but the lower shadow indicated there was also strong sentiment at the lower end of the day’s range.
Tuesday started the real decline, followed by a hanging man candlestick on Wednesday that dipped below the 10 & 50 day moving averages, but managed to close right at them for the day’s session.
Thursday SPY continued lower, flirting with the 10 & 50 day moving averages again on the upper shadow, but ultimately closing below them & Friday signaled further indecision with a spinning top candlestick that’s upper shadow tested but could not penetrate the 10 & 50 day moving averages & the candle’s real body was concentrated near the bottom of the day’s range.
Their Average True Range (ATR) suggests that there is more cooling off on the horizon, which should be troublesome to market participants as they are only 2.81% away from the nearest support level, which if broken leaves them exposed to further declines of up to -7% more if they test the next level of support or the closely trailing 200 day moving average.
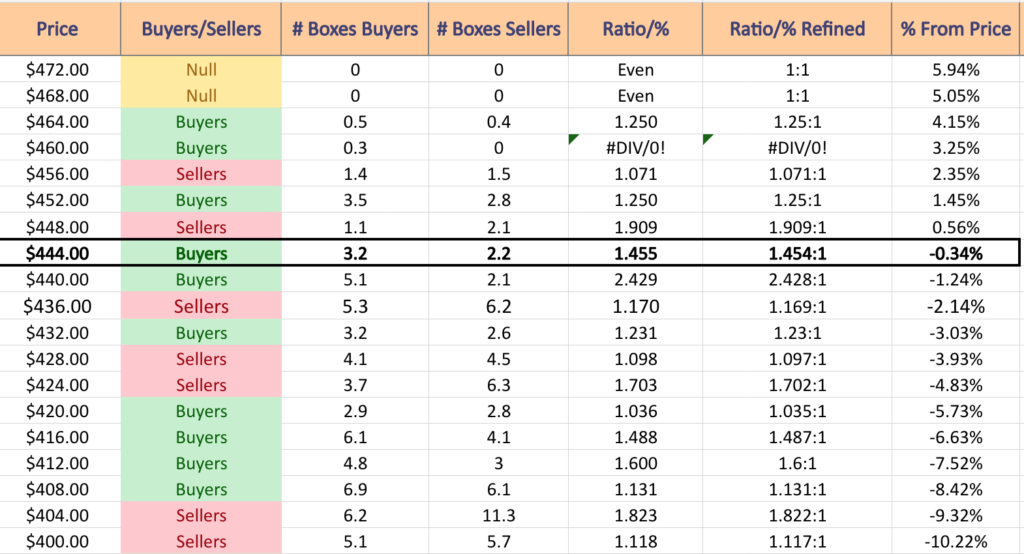
SPY has support at the $433.01 (Volume Sentiment: Buyers, 1.23:1), $415.18 (Volume Sentiment: Buyers, 1.6:1), $414.24 (200 Day Moving Average; Volume Sentiment: Buyers, 1.6:1) & $405.55/share (Volume Sentiment: Sellers, 1.82:1) price levels, with resistance at the $446.81 (50 Day Moving Average; Volume Sentiment: Buyers, 1.45:1), $447.03 (10 Day Moving Average; Volume Sentiment: Buyers, 1.45:1), $453.67 (Volume Sentiment: Buyers, 1.25:1) & $459.44 /share (52-Week High; Volume Sentiment: Sellers, 1.07:1) price levels.
QQQ, the Invesco QQQ Trust ETF fell -1.45% over the past week, closing the week out at their 10 & 50 day moving averages.
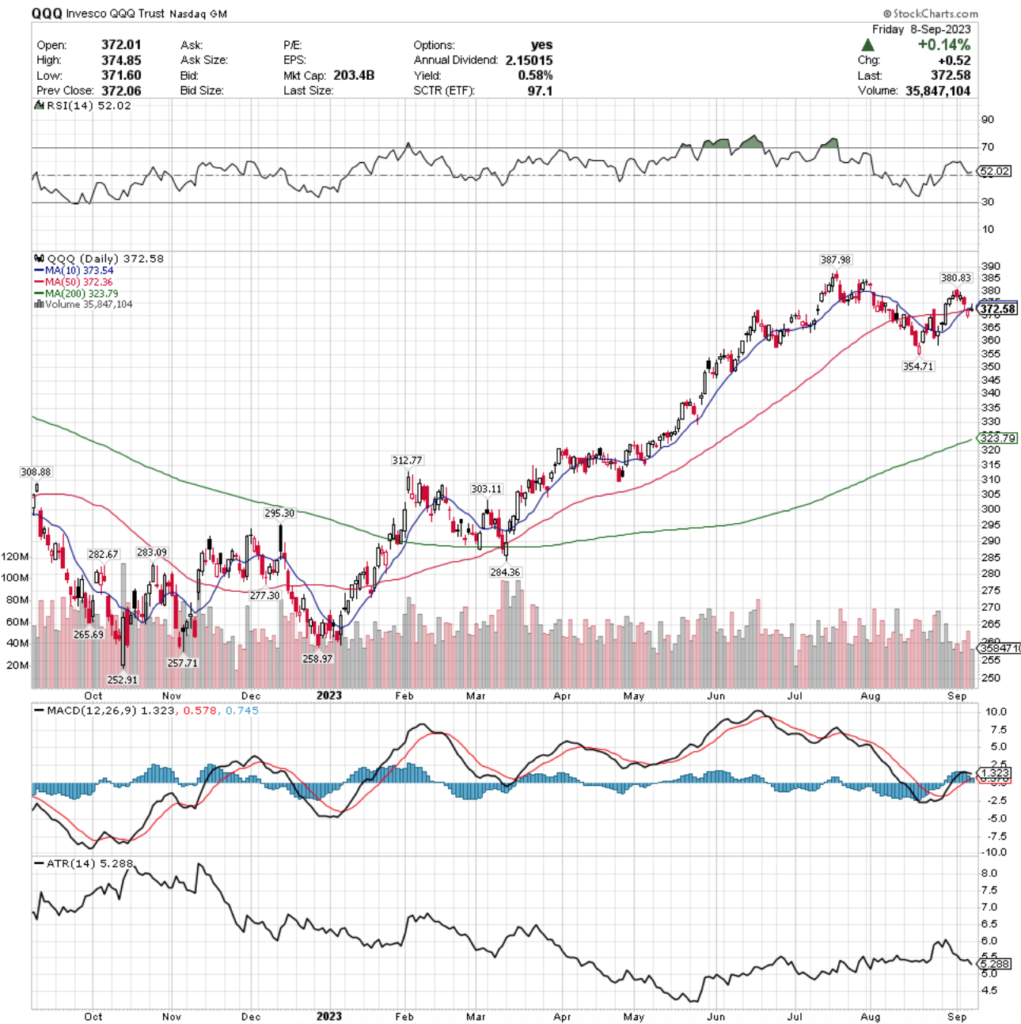
Their RSI is slightly above the neutral 50 mark at 52.02, with a MACD that is moving towards a bearish crossover in the coming days.
QQQ’s volume was -26.63% below average this week compared to the year prior’s average volumes (40,800,925 vs. 55,608,119), a sign of uncertainty among market participants & an effort to take some profits off of the table for protection in the near-term.
Their week kicked off similar to SPY’s, except their Monday candle was completely bearish & filled in red; Tuesday featured a spinning top of uncertainty & Wednesday featuring a hanging man candle, indicating further pain was on the near-term horizon.
While Wednesday’s session was able to find support at the area where the 10 & 50 day moving averages meet, Thursday saw them as resistance & closed below them.
Friday’s candlestick sets the tone for a grim week ahead, as it was a gravestone doji that’s upper shadow was able to get above the 10 & 50 day moving averages temporarily, the real body closed very narrowly between the 10 & 50 day moving averages, with all signals pointing bearish.
Their Average True Range also suggests that there is more of a near-term cool down period coming, which is something that investors should keep their eyes peeled to, given that the next level of support is -4.8% lower than the current price, with the following support level coming in -13.1% below the current price.
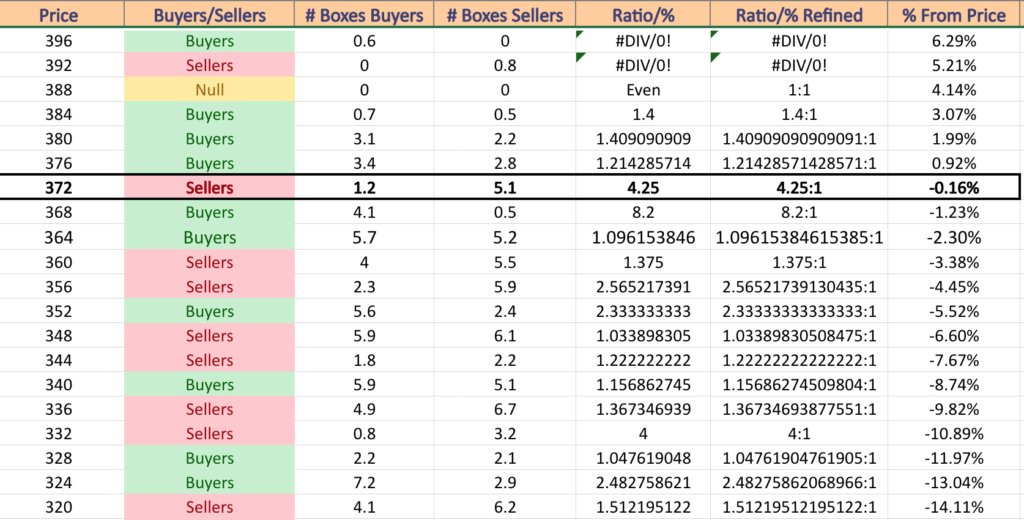
QQQ has support at the $372.36 (50 Day Moving Average; Volume Sentiment: Sellers, 4.25:1), $354.71 (Volume Sentiment: Buyers, 2.33:1), $323.79 (200 Day Moving Average; Volume Sentiment: Sellers, 1.51:1) & $312.77/share (Volume Sentiment: Sellers, 2:1) price levels, with resistance at the $373.54 (10 Day Moving Average; Volume Sentiment: Sellers, 4.25:1), $380.83 (Volume Sentiment: Buyers, 1.41:1) & $387.98/share (52-Week High; Volume Sentiment: Buyers, 1.41:1) price levels.
IWM, the iShares Russell 2000 ETF fell -1.56% over the past week, faring the worst of the major indexes as investors became weary of small cap names.
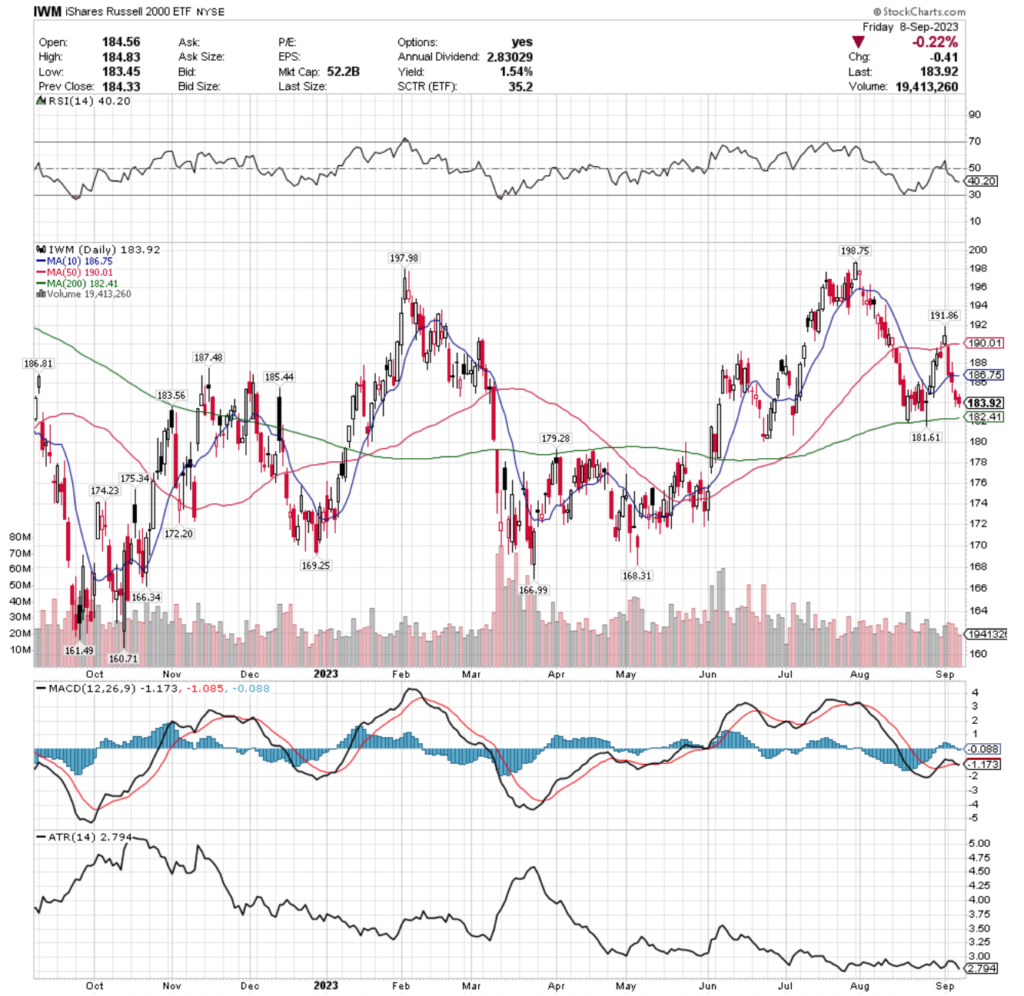
Their RSI is on the oversold end of the neutral range at 40.2, but their MACD is currently bearish following a week of declines.
IWM’s trading volume was -14.06% below average compared to the year prior (24,215,050 vs. 28,176,905), which mostly appeared to be profit-taking following their recent run up in late August.
Monday started the week establishing a new resistance level at $191.86, but most of the day’s candle is shadow above the real body, which was supported by their 50 day moving average.
Tuesday was a wide-range day whose candle sat perfectly between the 10 & 50 day moving averages, but the support of the 10 day moving average was broken Wednesday by a bearish spinning top candle, implying hesitancy & uncertainty by market participants.
Thursday & Friday were both down days, but a temporary floor seems to be building where a range may come from for this week while their oscillators return back closer to neutral.
Their ATR is signaling that a new, however temporary price range for consolidation is in order, as it is approaching the bottom of its range & continuing lower as their share price drops.
Given that IWM has traded in a much more range-bound manner than the high-flying SPY & QQQ there should are many more nearby support levels for them to rely on in the event of a decline, however, while there will be some rotation into small cap names, they will ultimately not be immune to any major losses in the S&P 500 or NASDAQ.
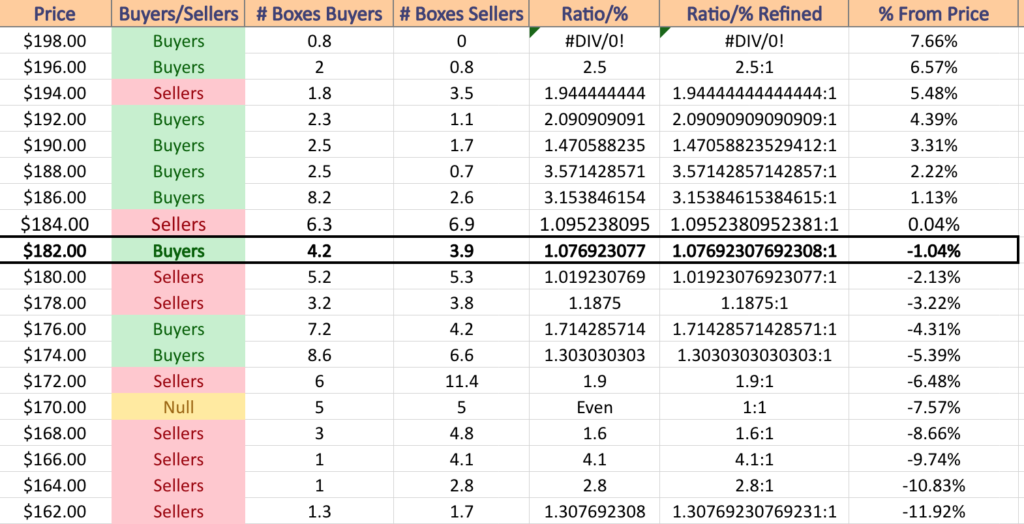
IWM has support at the $183.56 (Volume Sentiment: Buyers, 1.08:1), $182.41 (200 Day Moving Average; Volume Sentiment: Buyers, 1.08:1), $181.61 (Volume Sentiment: Sellers, 1.02:1) & $179.28 /share (Volume Sentimen t: Sellers, 1.19:1) price levels, with resistance at the $185.44 (Volume Sentiment: Sellers, 1.1:1), $186.75 (10 Day Moving Average; Volume Sentiment: Buyers, 3.15:1), $186.81 (Volume Sentiment: Buyers, 3.15:1) & $187.48/share (Volume Sentiment: Buyers, 3.15:1) price levels.
DIA, the SPDR Dow Jones Industrial Average ETF edged downward -0.14% over the past week, with investor sentiment clearly favoring larger cap stocks.
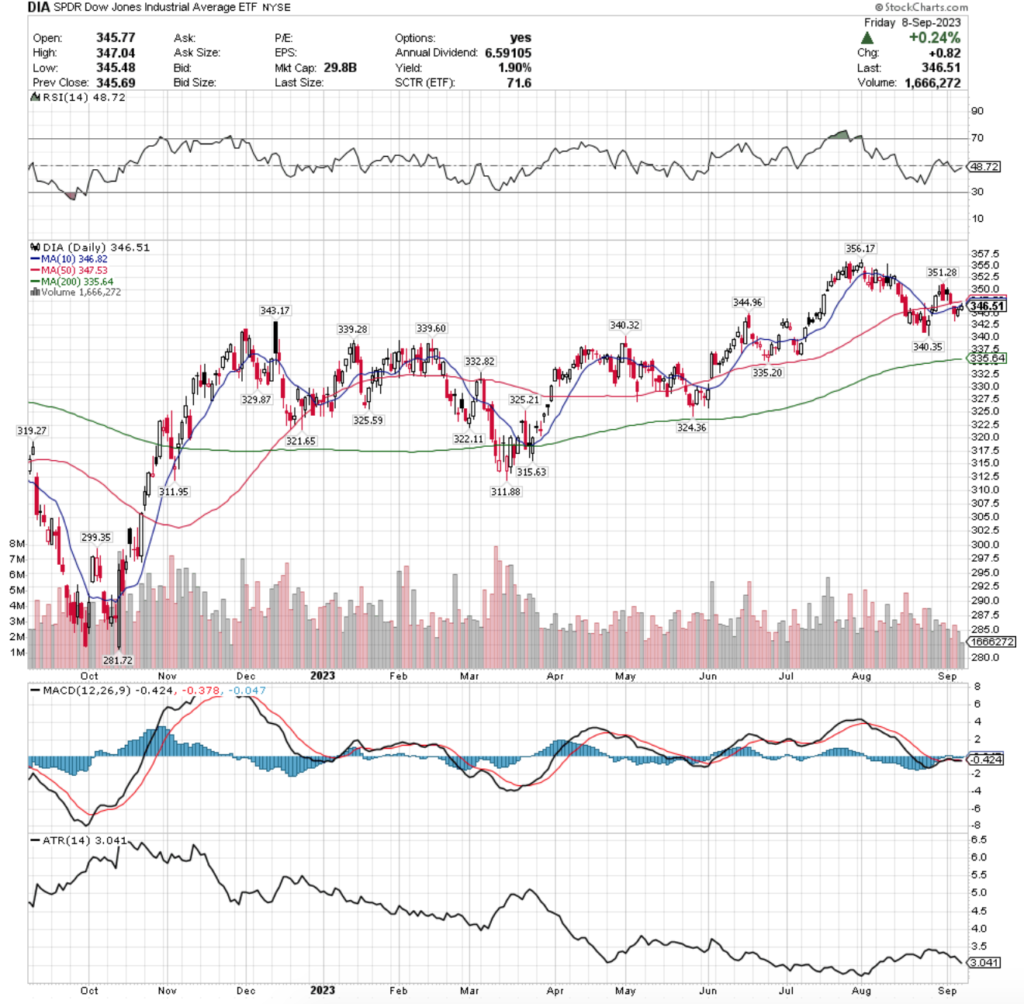
Their RSI is just below the neutral 50 mark at 48.72, with a MACD that is still bearish despite having been relatively flat for the past week and a half.
Volumes for DIA fell -40.27% from the year prior’s averages (2,174,950 vs. 3,641,279) signaling that investors were skittish & reluctant to be buying, but not unnerved enough to unload shares for profits.
They kicked off the week with a hanging man candle that was filled in, signaling that they opened the day higher than the day prior, but closed below the day’s opening price.
Tuesday they declined but were kept afloat by the 50 day moving average, but Wednesday produced a hammer candle following a gap down that led to a mild recovery on Thursday, with the week closing on an uncertain note with a spinning top candlestick.
Friday’s spinning top has an ominous look to it, with it being unable to break the resistance that they 10 day moving average was providing.
Much like IWM, DIA has traded in a less accelerated manner compared to SPY & QQQ, giving it much closer proximity to support levels compared to its current price.
However, note their ATR in the bottom pane of the chart trending away from their mean as the ETF advanced late in the week, which indicates that there should be a near-term shake up on the horizon.
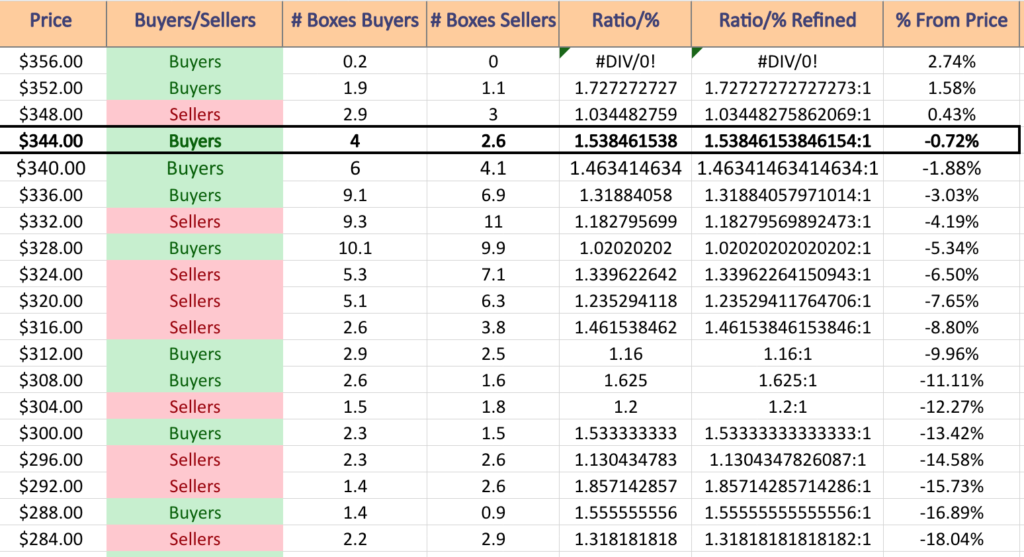
DIA has support at the $344.96 (Volume Sentiment: Buyers, 1.54:1), $343.17 (Volume Sentiment: Buyers, 1.46:1), $340.35 (Volume Sentiment: Buyers, 1.46:1) & $340.32/share (Volume Sentiment: Buyers, 1.46:1) price levels, with resistance at the $346.82 (10 Day Moving Average; Volume Sentiment: Buyers, 1.54:1), $347.53 (50 Day Moving Average; Volume Sentiment: Buyers, 1.54:1), $351.28 (Volume Sentiment: Sellers, 1.03:1) & $356.17/share (52-Week High; Volume Sentiment: Buyers, 0.2:0*) price levels.
U.S. Oil & Gas Exploration & Production (IEO), Energy Momentum (PXI), Mega Cap Growth (MGK) & Turkey (TUR) Are All Bullishly Leading The Market
IEO, the iShares U.S. Oil & Gas Exploration & Production ETF has climbed +13.53% over the past year, including a +30.56% gain from their 52-week low in March of 2023 (ex-distributions).
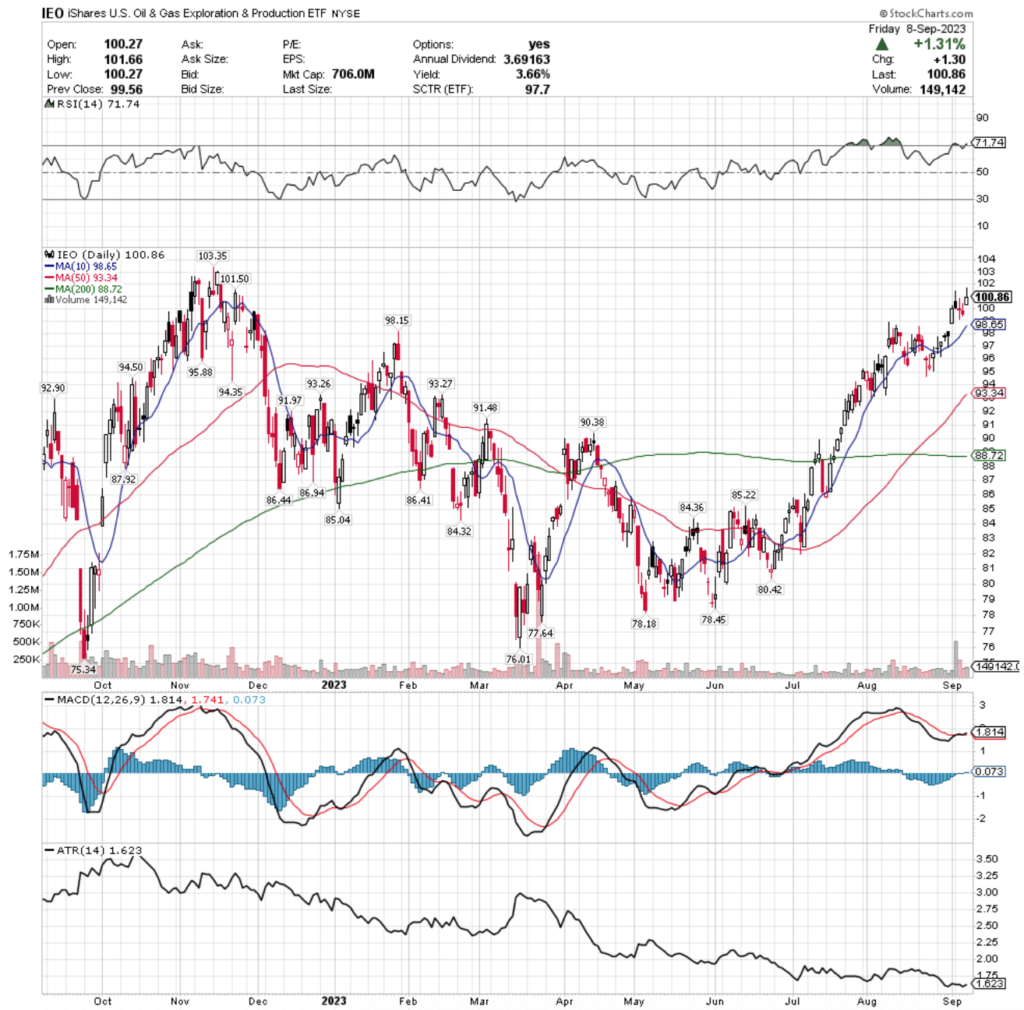
Their RSI is currently overbought at 71.74, while their MACD is slightly bullish following the gap up that kicked off last week.
IEO’s trading volume this past week was +67.44% above average compared to the year prior (256,650 vs. 153,279.28), which is interesting as their gap up day was on the week’s weakest volume, Tuesday’s shooting star candle had the highest volume of the week, which has bearish implications in the near-term.
Wednesday’s bearish doji & Thursday’s bearish spinning top candle were the next highest volume days as investors took profits from the early week’s move off of the table.
Friday closed the week out with a shooting star candlestick, sending more bearish signals in the near-term.
Their ATR is signaling that their price wants to remain rangebound here for a while or climb higher & the $98-98.99 support zone will be an area of interest to watch in the coming weeks.
Another thing worth noting is that there may be a bearish head & shoulders pattern emerging that began in mid-August on the final gap up that led to the consolidation range before their current price range.
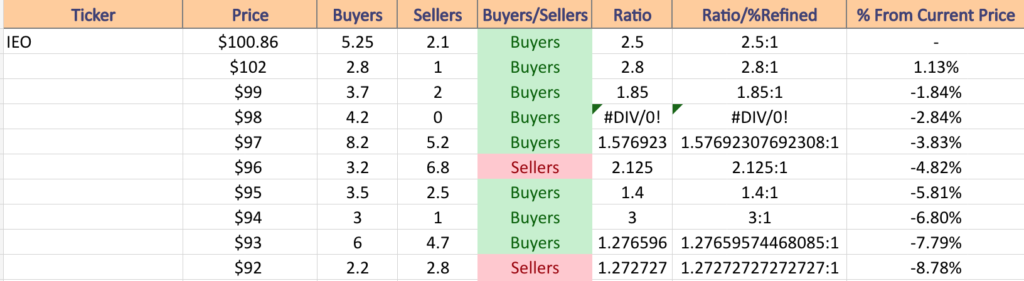
This will be something for market participants to watch for & to plan appropriate hedging strategies using options, as their +3.66% distribution yield will only cover so much loss prevention for long-term shareholders, especially as if the $98 level is broken there is no support again until just below $96.
IEO has support at the $98.65 (10 Day Moving Average; Volume Sentiment: Buyers, 4.2:0*), $98.15 (Volume Sentiment: Buyers, 4.2:0*), $95.88 (Volume Sentiment: Buyers, 1.4:1) & $94.50/share (Volume Sentiment: Buyers, 3:1) price levels, with resistance at the $101.50 (Volume Sentiment: Buyers, 2.5:1) & $103.35/share (52-Week High; Volume Sentiment: Buyers, 2.8:1) price levels.
PXI, the Invesco DWA Energy Momentum ETF has advanced +8.14% over the past year, gaining +32.01% since their 52-week low in May of 2023 (ex-distributions).
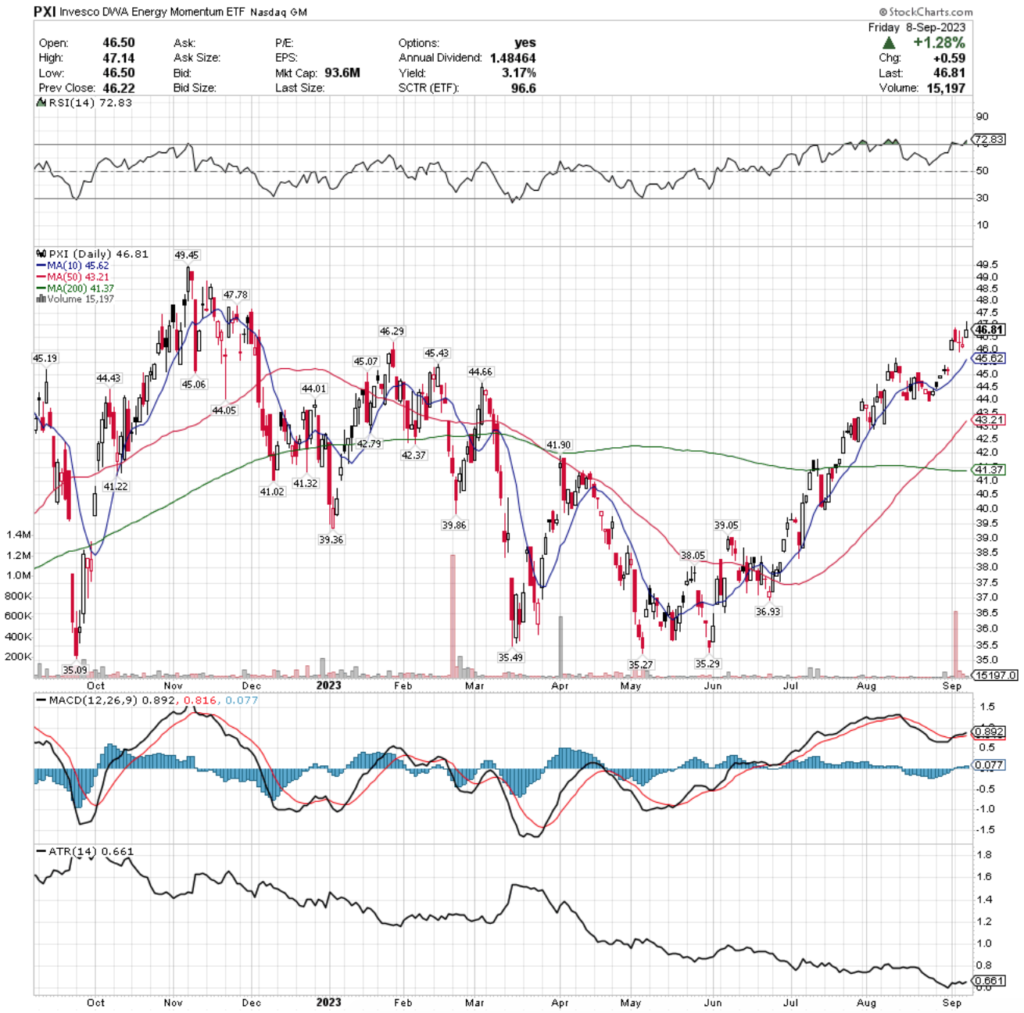
Their RSI is overbought at 72.83, but their MACD is still bullish following last Monday’s gap up session.
PXI’s volumes were +386.22% above average this past week compared to the year prior (191,850 vs. 39,457.37), which is troubling as their largest volume day was Tuesday, when shareholders took profits following their 2-3 month bull run & final gap up at a rate that eclipsed the rest of the week’s trading sessions.
Tuesday’s session covered a wide range of prices, with little upper shadow following the session’s open, with Wednesday’s session resulting in a doji, meaning more uncertainty among investors.
Thursday continued the uncertainty theme, as the day resulted in a spinning top whose real body resided near the bottom of the day’s range & Friday closed the week off on a bullish day, but in a shooting star candle, signaling that there is some volatility on the horizon.
It is worth keeping an eye on the 10 day moving average, as it is currently the first support level in the window created by last Monday’s gap & how their price behaves around it will dictate whether they consolidate from here or carry on.
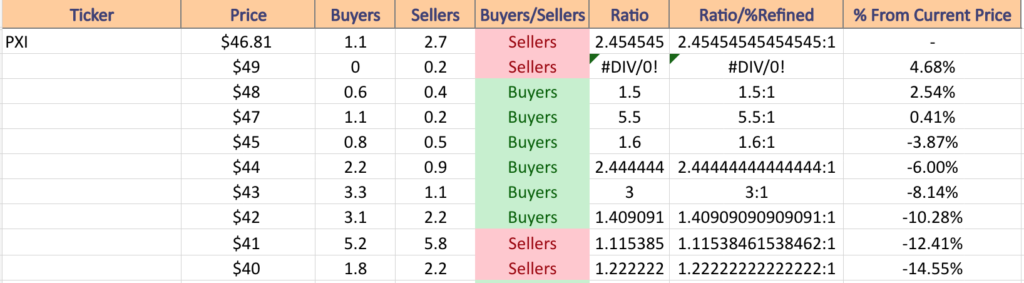
With a 3.17% distribution yield there is some protection against losses, however it would be wise to look into hedging options in the near-term.
Another thing to keep an eye on is to see if a head & shoulders pattern is emerging that began in early August following their multi-month price advancement, as that would have bearish implications moving into late September & early October.
PXI has support at the $46.29 (Volume Sentiment: Sellers, 2.46:1), $45.62 (10 Day Moving Average; Volume Sentiment: Buyers, 1.6:1), $45.43 (Volume Sentiment: Buyers, 1.6:1) & $45.19/share (Volume Sentiment: Buyers, 1.6:1) price levels, with resistance at the $47.78 (Volume Sentiment: Buyers 5.5:1) & $49.45/share (52-Week High; Volume Sentiment: Sellers, 0.2:0*) price levels.
MGK, the Vanguard Mega Cap Growth ETF has gained +19.42% over the past year, including a +43.77% advance since their 52-week low in October of 2022 (ex-distributions).
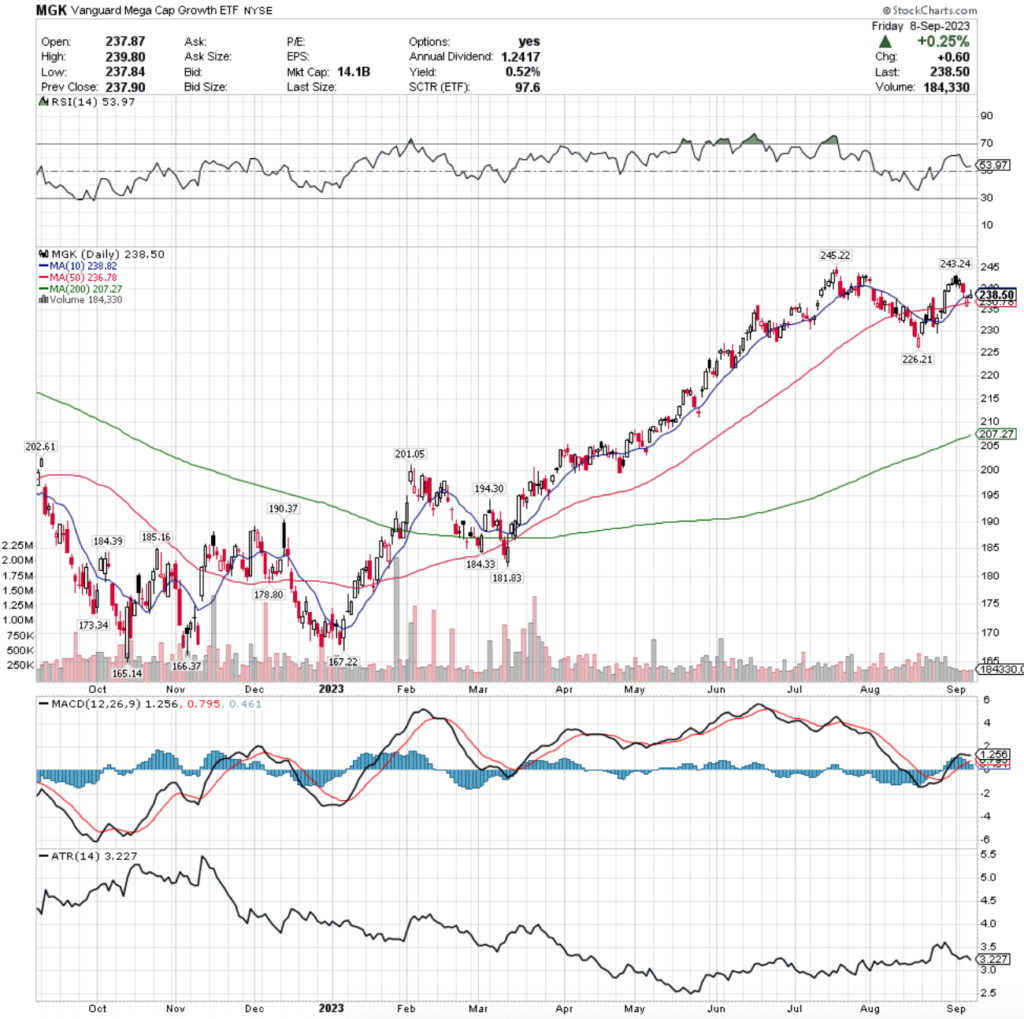
Their RSI is currently sitting right above the neutral 50 mark at 53.97, with a bullish MACD that is beginning to signal a bearish crossover is imminent in the coming weeks.
Volumes fell to -50.16% of their annual average in this past week of trading for MGK (175,925 vs. 353,004.78) signaling a bout of uncertainty among market participants.
MGK’s week looked far more like what was seen earlier for SPY & QQQ, with the week kicking off on a filled in black candle, Wednesday’s session finding support from the 10 day moving average & Thursday’s session straddling the 10 & 50 day moving averages.
Friday closed in a spinning top with the real body consolidated at the bottom of the day’s price range, implying more bearishness on the horizon.
Their ATR confirms this, as on Friday’s slightly up session the ATR moved further away from their mean.
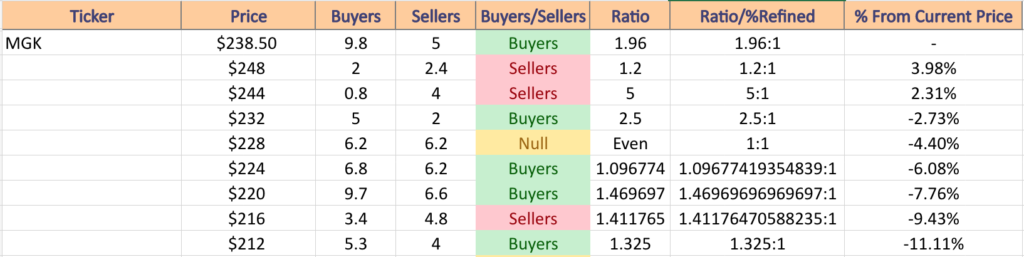
MGK has support at the $236.78 (50 Day Moving Average; Volume Sentiment: Buyers, 1.96:1), $226.21 (Volume Sentiment: Buyers, 1.1:1), $207.27 (200 Day Moving Average; Volume Sentiment: NULL, 0:0*) & $202.61/share (Volume Sentiment: NULL, 0:0*) price levels, with resistance at the $238.82 (10 Day Moving Average; Volume Sentiment: Buyers, 1.96:1), $243.24 (Volume Sentiment: NULL, 0:0*) & $245.22/share (52-Week High; Volume Sentiment: Sellers, 5:1) price levels.
TUR, the iShares MSCI Turkey ETF has jumped +62.88% over the past year, improving +84.45% since their 52-week low in September of 2022 (ex-distributions).
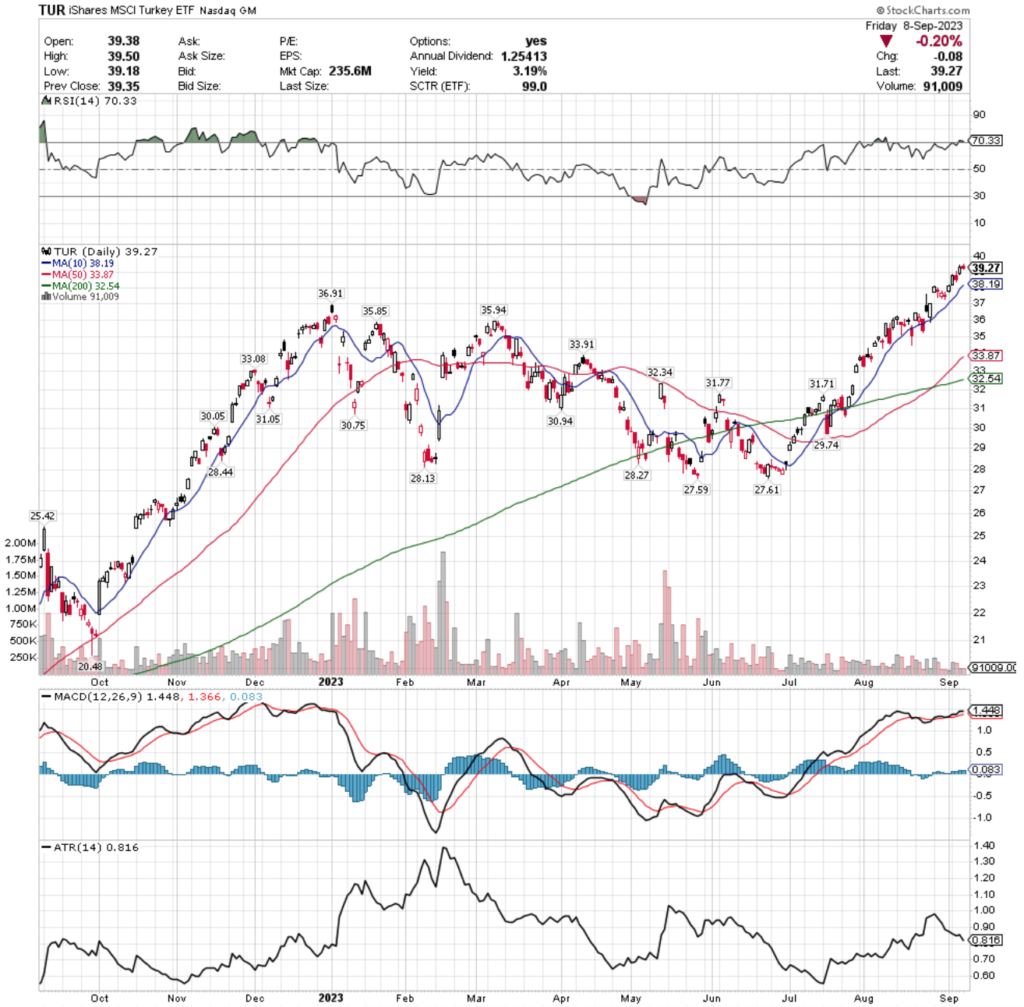
Their RSI is currently overbought at 70.33 & their MACD is bullish but beginning to show signs of a bearish crossover.
Last week’s volume was -58.24% lower than the year prior’s average volume for TUR (132,675 vs. 317,673) indicating that investors have become more cautious as they sit at an 52-week high.
Friday closed the week off with a spinning top at the 52-week high & their ATR is signaling that they are due for a cool off in the near-term.
While TUR offers a 3.19% distribution yield, it would be wise to seek hedging options in the near-term while they sit at such a high valuation compared to the year prior.
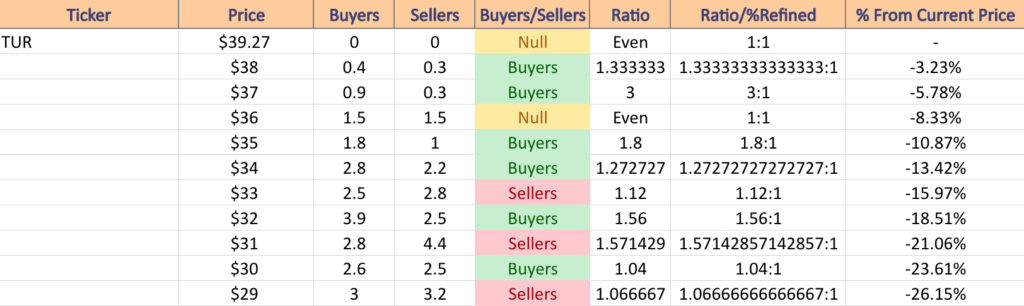
TUR has support at the $38.19 (10 Day Moving Average; Volume Sentiment: Buyers, 1.33:1), $36.91 (Volume Sentiment: Even, 1:1), $35.94 (Volume Sentiment: Buyers 1.8:1) & $35.85/share (Volume Sentiment: Buyers, 1.8:1) price levels, as it currently sits at its 52-week high.
China (YINN), Utilities (UTSL), Rare Earth/Strategic Metals (REMX) & 20+ Year Treasuries (UBT) Are All Bearishly Lagging The Market
YINN, the Direxion Daily FTSE China Bull 3x Shares ETF has declined -48.49% over the past year, dropping -58.3% since their 52-week high in January of 2023, but recovering +56% since their 52-week low in October of 2022 (ex-distributions).
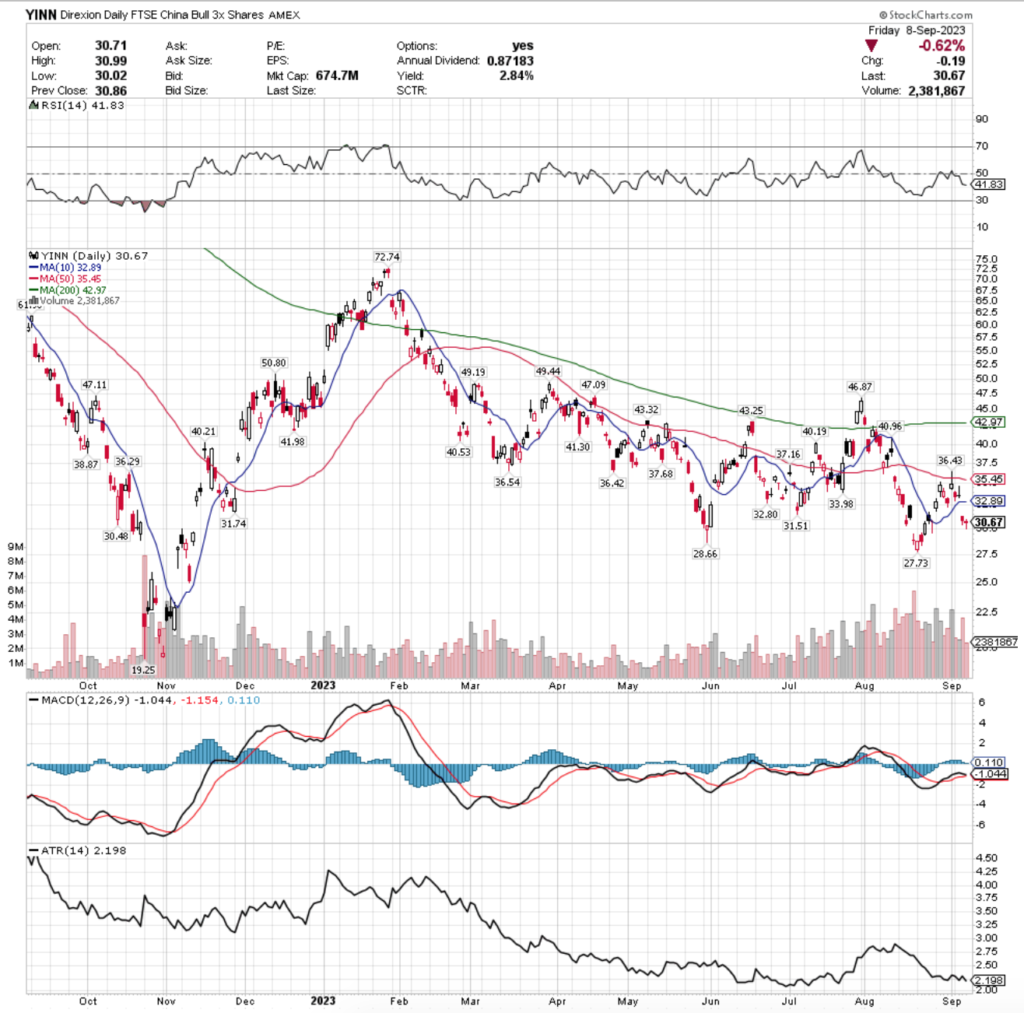
Their RSI is on the oversold end of the neutral range at 41.83 & their MACD is about to crossover bearishly.
This past week’s average volumes increased +43.33% compared to the year prior (2,953,950 vs. 2,060,898.01) as investors were eager to join in Monday’s gap up session & just as eager to take their profits for the rest of the week.
Monday’s candle was a shooting star that could not break the resistance of the 50 day moving average, followed by another on Wednesday before Thursday gapped beneath the 10 day moving average support.
Friday’s dragonfly doji signals that there may be a consolidation range built around their current price level in the near-term.
They offer a 2.84% distribution yield which offers some cushion, but at this price level it will be worth looking to see how they behave as they encounter their support levels.
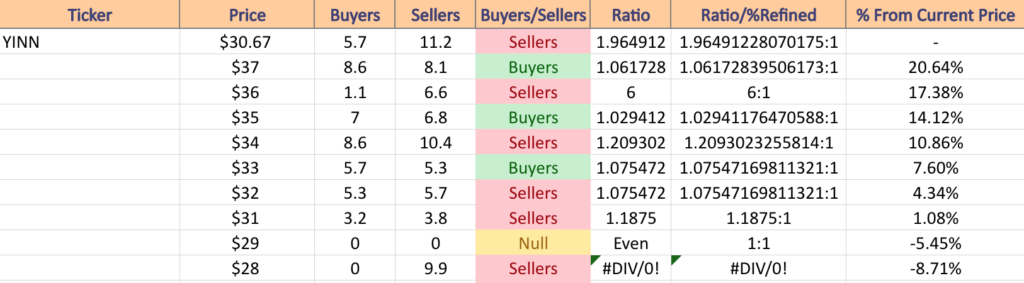
YINN has support at the $30.48 (Volume Sentiment: Sellers, 1.96:1), $28.66 (Volume Sentiment: Sellers, 9.9:0*), $27.73 (Volume Sentiment: NULL, 0:0*) & $19.25/share (Volume Sentiment: NULL, 0:0*) price levels, with resistance at the $31.51 (Volume Sentiment: Sellers, 1.19:1), $31.74 (Volume Sentiment: Sellers, 1.19:1), $32.80 (Volume Sentiment: Sellers, 1.08:1) & $32.89/share (10 Day Moving Average; Volume Sentiment: Sellers, 1.08:1) price levels.
UTSL, the Direxion Daily Utilities Bull 3x Shares has fallen -52.66% over the past year, losing -54.97% since their 52-week high in September of 2022, but recovering +9.16% since their 52-week low in September of 2023 (ex-distributions).
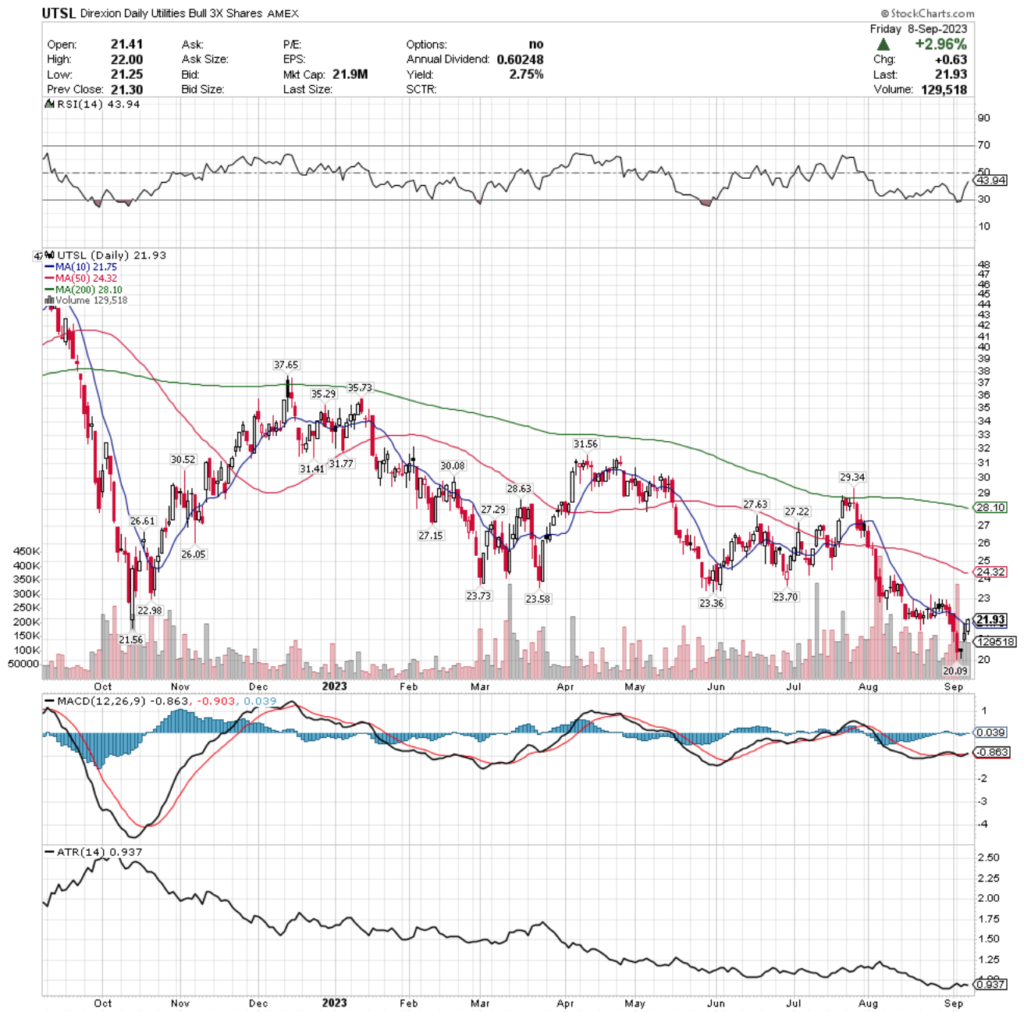
Their RSI is at 43.94 with a MACD that is trying to breakout bullishly.
Volumes were +115.01% above average compared to the year prior this past week (198,275 vs. 92,217.53) as Monday & Tuesday’s declines were violent, but investors were eager to buy back in on Wednesday, Thursday & Friday after they reached a new 52-week low.
The 10 day moving average will be an interesting area to keep an eye on in the coming week, to see whether it becomes support & leads them on a bullish run or if it remains resistance & makes UTSL retest their 52-week low.
Their ATR is implying that they may form a consolidation range around current price levels, but with only a 2.75% distribution yield it there is limited protection against additional losses if positions are entered before the range has become more sturdy.
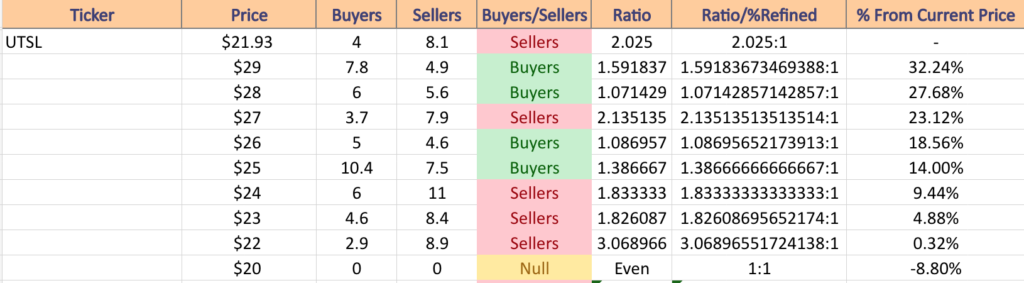
UTSL has support at the $21.75 (10 Day Moving Average; Volume Sentiment: Sellers, 2.03:1), $21.56 (Volume Sentiment: Sellers, 2.03:1) & $20.09/share (Volume Sentiment: NULL, 0:0*) price levels, with resistance at the $22.98 (Volume Sentiment: Sellers, 3.07:1), $23.36 (Volume Sentiment: Sellers, 1.83:1), $23.58 (Volume Sentiment: Sellers, 1.83:1) & $23.70/share (Volume Sentiment: Sellers, 1.83:1) price levels.
REMX, the VanEck Vectors Rare Earth/Strategic Metals ETF has shed -30.97% over the past year, declining -32.36% from their 52-week high in September of 2022, but has inched forward +1.24% since their 52-week low in August of 2023 (ex-distributions).
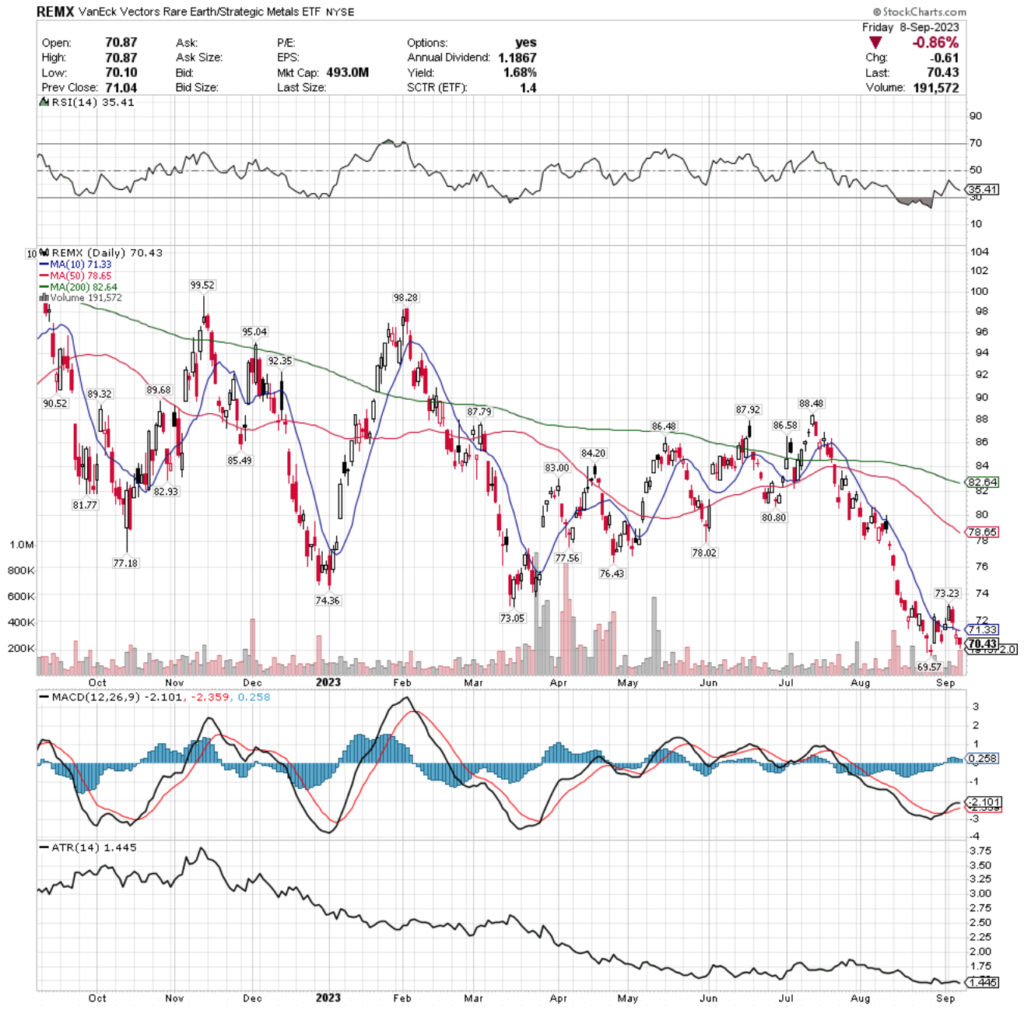
Their RSI is approaching oversold levels & currently sits at 35.41, as their MACD begins to curl over indicating a bearish crossover is on the horizon.
Last week’s volumes were -15.49% below average compared to the year prior (104,975 vs. 124,220.32) as investors mostly sat on the fence while the share price fluttered near its 52-week low from the end of August.
Friday was a major risk off day in terms of volume compared to the rest of the week, and the candle’s real body is a bit too large to be a hanging man, but it looks ready to set the tone for more declines going into this week.
With a modest 1.68% distribution yield, a wait & see approach would be better than following their ATR back to the mean assuming that they begin some form of rally, as there is limited support here & it is the 52-week low.
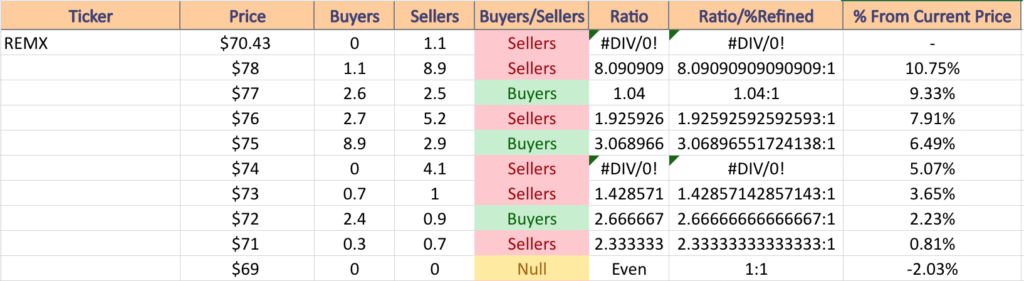
REMX has support at the $69.57 (52-Week Low; Volume Sentiment: NULL, 0:0*), with resistance at the $71.33 (10 Day Moving Average; Volume Sentiment: Sellers, 2.33:1), $73.05 (Volume Sentiment: Sellers, 1.43:1), $73.23 (Volume Sentiment: Sellers, 1.43:1) & $74.36/share (Volume Sentiment: Sellers, 4.1:0*) price levels.
UBT, the ProShares Ultra 20+ Year Treasury ETF has lost -26.34% over the past year, falling -28.44% since their 52-week high in December of 2022, while reclaiming +4.79% since their 52-week low in October of 2022 (ex-distributions).
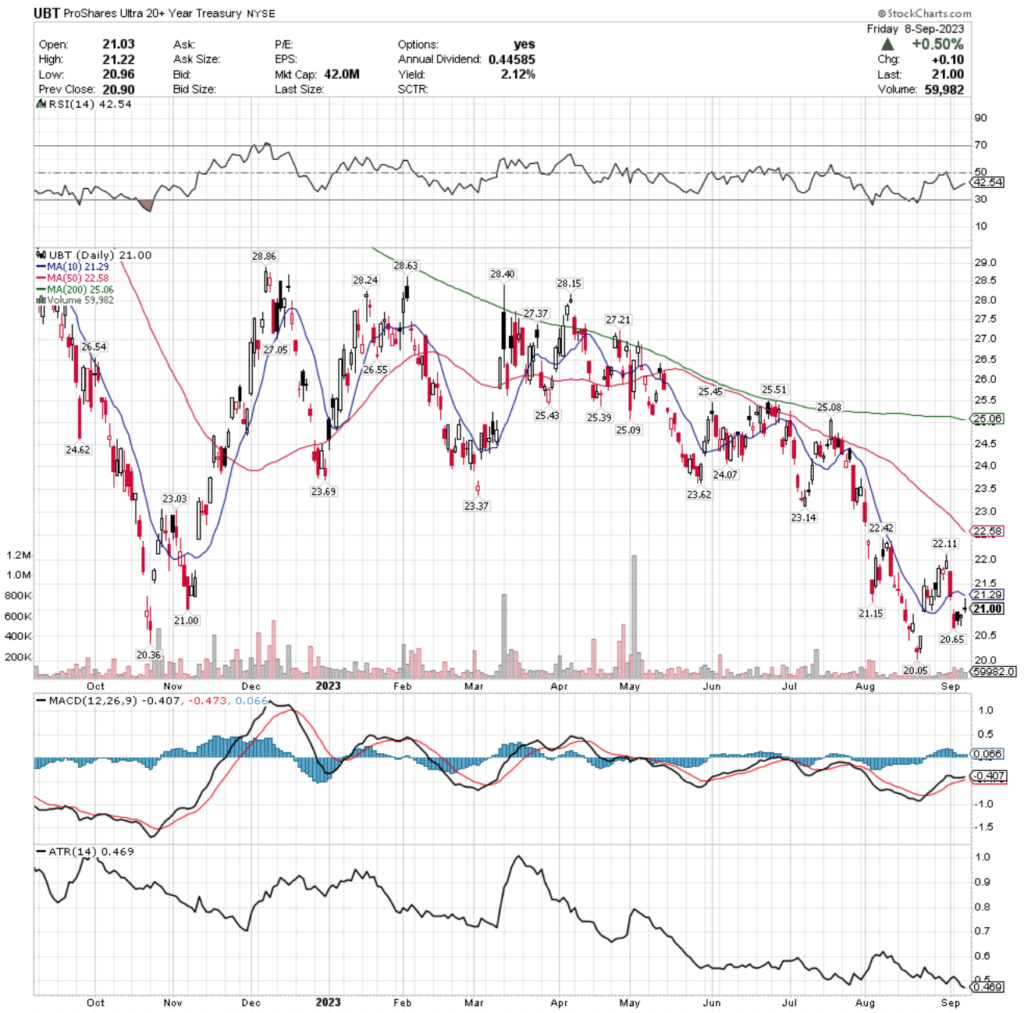
Their RSI is reverting back to neutral & sits at 42.54 with a MACD that is still bullish, but losing steam & looking ready to cross over bearishly.
Volumes last week were -46.02% below average compared to the year prior (52,000 vs. 96,649.8) as investors took a wait & see approach after Tuesday’s gap down below the ten day moving average put them within a few percent of their 52-week low.
Friday closed the week out with a gravestone doji that occurred on a gap up, following Thursday’s hanging man candle that completed a harami pattern with Wednesday’s candle, which indicates there is more bearish sentiment on the horizon.
Coupled with their ATR moving away from the mean over the last 3 days of last week which were advancing days & the fact that the 52-week low is so close by, there appears to be better entries on the horizon after they cool off more, or establish more support & a trading range around these levels.
As their distribution yield is only 2.12%, there is not much in the form of protection against further losses from these price levels.
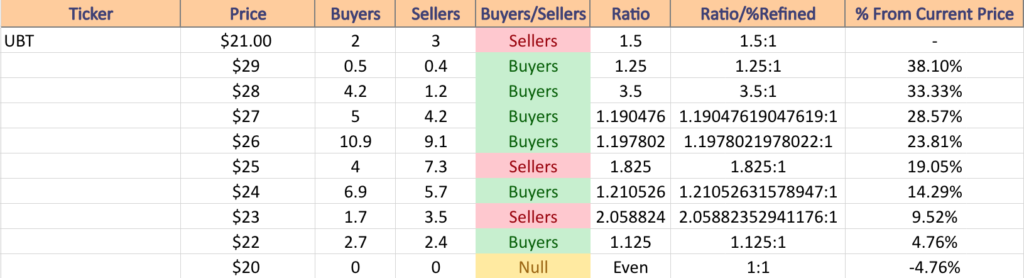
UBT has support at the $21 (Current Price & Additional Support Touch-Point; Volume Sentiment: Sellers, 1.5:1), $20.65 (Volume Sentiment: NULL, 0:0*), $20.36 (Volume Sentiment: NULL, 0:0*) & $20.05/share (Volume Sentiment: NULL, 0:0*) price levels, with resistance at the $21.15 (Volume Sentiment: Sellers, 1.5:1), $21.29 (10 Day Moving Average; Volume Sentiment: Sellers, 1.5:1), $22.11 (Volume Sentiment: Buyers, 1.13:1) & $22.42/share (Volume Sentiment: Buyers, 1.13:1) price levels.
The Week Ahead
Monday starts off on a quiet note in terms of economic data, with nothing set to be reported.
Oracle is scheduled to report earnings results on Monday, along with Casey’s General & FuelCell Energy.
Tuesday features the NFIB Optimism Index data being reported at 6 am with a slow day on the earnings report front.
Consumer Price Index, Core CPI, CPI (Year-over-Year) & Core CPI (Year-over-Year) are all set to be reported on Wednesday morning at 8:30 am.
Cracker Barrel Old Country Store & REV Group are scheduled to report earnings on Wednesday.
Initial Jobless Claims, Producer Price Index, Core PPI, PPI (Year-over-Year), Core PPI (Year-over-Year), U.S. Retail Sales & Retail Sales minus Autos are scheduled to be reported on Thursday at 8:30 am, followed by Business Inventories numbers at 10 am.
Thursday’s earnings reports include Adobe, Korn/Ferry & Lennar.
Friday kicks off with U.S. Import Prices & Empire State Manufacturing Survey data at 8:30 am, followed by Industrial Production & Capacity Utilization data at 9:15 am & the week closes out on the data-front with Consumer Sentiment (preliminary) data at 10 am with no earnings reports of note scheduled.
See you back here next week!
*** I DO NOT OWN SHARES OR OPTIONS CONTRACT POSITIONS IN SPY, QQQ, IWM, DIA, IEO, PXI, MGK, TUR, YINN, UTSL, REMX, or UBT AT THE TIME OF PUBLISHING THIS ARTICLE ***