Major indexes in the stock market are all quietly retreating from 52-week highs as investors take their profits, earnings reports continue to come in & people prepare for the month of September, which tends to be a bad month for stocks.
Given how stretched out support levels are for the S&P 500 (SPY) & NASDAQ (QQQ) & how consolidated the price levels of the Russell 2000 (IWM) & Dow Jones Industrial Average (DIA) are, it’s important to have an understanding of volume sentiment at the various price levels each index has been at in recent history.
This way, it is easier to understand how market participants will behave when each index approaches price levels that are support or resistance.
In the case of SPY & QQQ it is even more essential, as with so much space between support levels there is a lot of room for error.
The article below gives a brief technical analysis breakdown for SPY, QQQ, IWM & DIA, as well as lists out their volumes at each price level that they have traded at in recent history, noting the ratio of buyers:sellers (or sellers:buyers).
There is also a chart that displays the candlesticks & some technical indicators for the time period that each ETF’s prices:volumes cover.
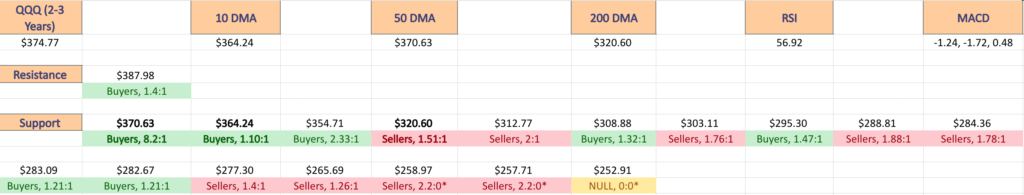
On the images of the table, the current price level will be in BOLD & its cells will have bold edges.
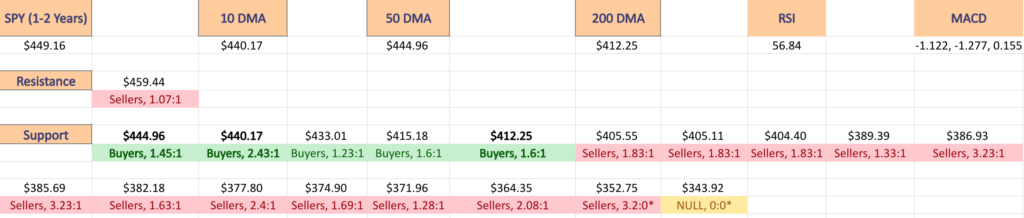
In the list that accompanies them the current support & resistance levels will be in BOLD & the current price level, 10, 50 & 200 Day Moving Averages will also be denoted.
This is not trading advice, but is meant to serve as an additional tool that may help you navigate the future market environment.
Technical Analysis & Price:Volume Sentiment Analysis Of The S&P 500 (SPY)
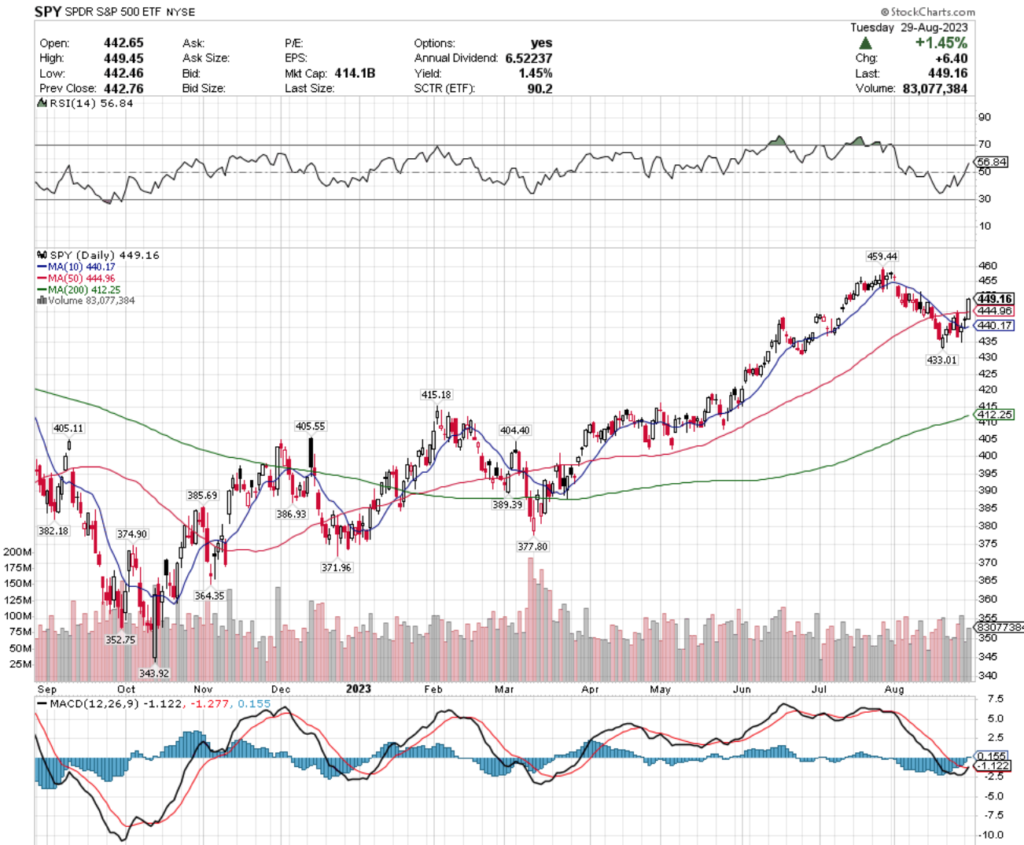
The S&P 500 (SPY) is just -2.24% below its 52-week high it reached about one month ago & has been in a consolidation range since the end of July.
Their RSI is on the overbought end of the neutral range, sitting at 56.84, with their MACD trying to crossover bullishly in the coming days.
Trading volumes over the past month have fallen -9.85% compared to the average for the year prior (76,433,609.09 vs. 84,789,231.87) as market participants had been taking profits off of the table, but have increased to -4.74% below average over the past week (80,766,700 vs. 84,789,231.87).
The uptick in volume this week comes with a catch, as the second highest volume day was a bearish engulfing candle last Thursday, and the highest volume day resulted in a spinning top after it, indicating indecision among market participants last Friday (there was also a spinning top to kick off the week this Monday).
While yesterday’s session was able to break above their 50 day moving average, the market will need some catalyst to keep driving higher in the near-term.
It is also worth noting that a bearish head & shoulders pattern began to emerge from SPY’s chart last week, which will be something to keep an eye on in the coming weeks.
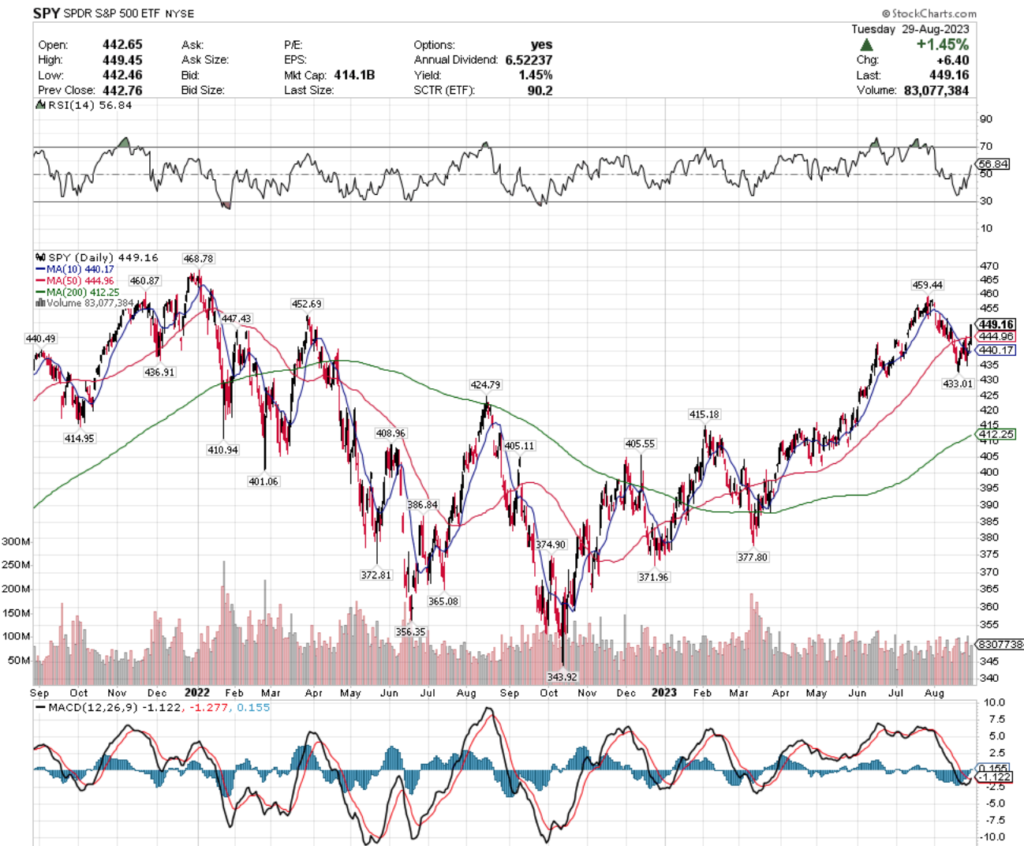
Given that the next level of support aside from the 10 & 50 day moving averages for SPY is -3.36% below their current price & the next level below that is -7.57% below the price, the table below will be helpful for gauging how market participants will behaved by volume at each price level that they have traded at over the past 1-2 years.
I have included a 2 year chart as well to help visualize how the volume looked in relation to the chart.
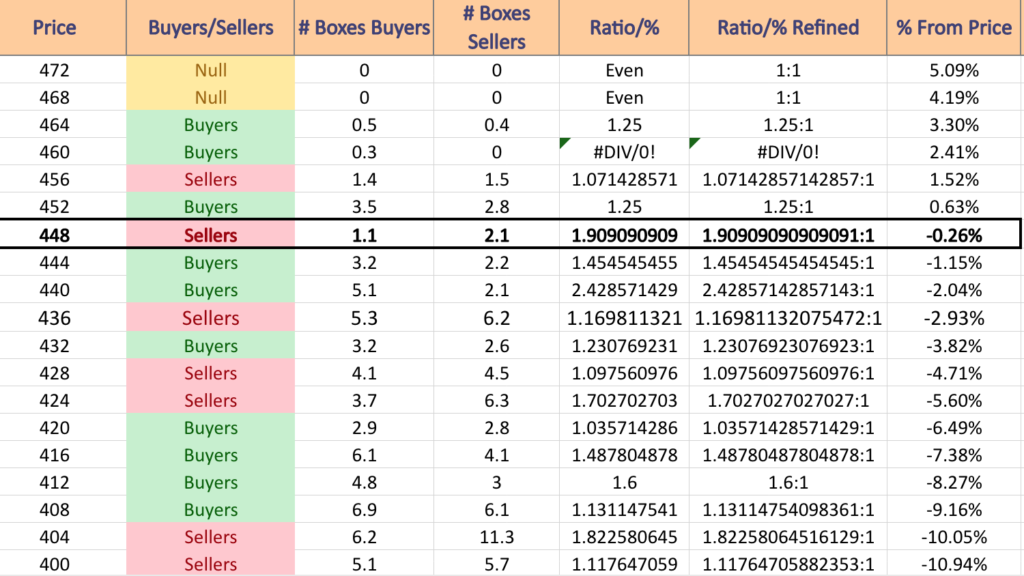
$472 – NULL – 0:0*; +5.09% From Current Price Level
$468 – NULL – 0:0*; +4.19% From Current Price Level
$464 – Buyers – 1.25:1; +3.3% From Current Price Level
$460 – Buyers – 0.3:0*; +2.41% From Current Price Level
$456 – Sellers – 1.07:1; +1.52% From Current Price Level
$452 – Buyers – 1.25:1; +0.63% From Current Price Level
$448 – Sellers – 1.91:1; -0.26% From Current Price Level – Current Price Level
$444 – Buyers – 1.45:1; -1.15% From Current Price Level – 50 Day Moving Average
$440 – Buyers – 2.43:1; -2.04% From Current Price Level – 10 Day Moving Average
$436 – Sellers – 1.17:1; -2.93% From Current Price Level
$432 – Buyers – 1.23:1; -3.82% From Current Price Level
$428 – Sellers – 1.10:1; -4.71% From Current Price Level
$424 – Sellers – 1.7:1; -5.6% From Current Price Level
$420 – Buyers – 1.04:1; -6.49% From Current Price Level
$416 – Buyers – 1.49:1; -7.38% From Current Price Level
$412 – Buyers – 1.6:1; -8.27% From Current Price Level – 200 Day Moving Average
$408 – Buyers 1.13:1; -9.16% From Current Price Level
$404 – Sellers – 1.82:1; -10.05% From Current Price Level
$400 – Sellers – 1.12:1; -10.94% From Current Price Level
$396 – Buyers – 2.04:1; -11.84% From Current Price Level
$392 – Buyer s- 2.04:1; -12.73% From Current Price Level
$388 – Sellers – 1.33:1; -13.62% From Current Price Level
$384 – Sellers – 3.23:1; -14.51% From Current Price Level
$380 – Sellers – 1.63:1; -15.4% From Current Price Level
$376 – Sellers – 2.4:1; -16.29% From Current Price Level
$372 – Sellers – 1.69:1; -17.18% From Current Price Level
$368 – Sellers – 1.28:1; -18.07% From Current Price Level
$364 – Sellers – 2.08:1; -18.96% From Current Price Level
$360 – Buyers – 1.67:1; -19.85% From Current Price Level
$356 – Sellers – 4:1; -20.74% From Current Price Level
$352 – Sellers – 3.2:0*; -21.63% From Current Price Level
$348 – NULL – 0:0*; -22.52% From Current Price Level
Technical Analysis & Price:Volume Sentiment Analysis Of The NASDAQ (QQQ)
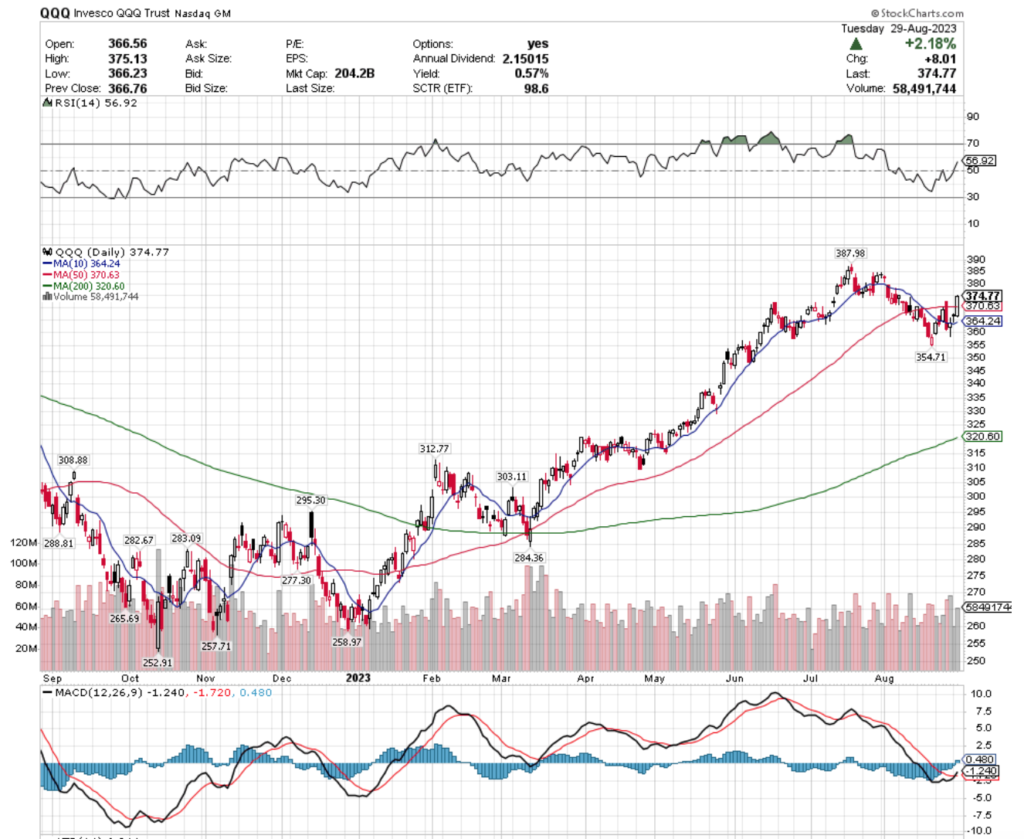
The NASDAQ (QQQ) is currently -3.4% below its 52-week high which occurred in mid-July.
Much like SPY, they have been consolidating over the past month & a half & have been relatively range-bound.
Their RSI is also on the overbought end of the neutral range at 56.92, with their MACD slightly bullish.
QQQ’s volume story is interesting, with the past week’s volumes rising +2.58% higher than the average for the past year (57,473,620 vs. 56,025,471.31) after the past month’s average volume dipped -4.93% below average (53,264,047.83 vs. 56,025,471.31) as investors trimmed profits & took a wait & see approach into earnings season.
Their chart is very similar to SPY’s, with last Thursday’s bearish engulfing candlestick being the second highest volume day of the past week & Friday’s spinning top candlestick signaling “popular indecision” & having the week’s highest volume.
This week kicked off Monday with a dragonfly doji that was barely supported by the 10 day moving average on weak volume, signaling there is likely more near-term volatility on the horizon.
Also like SPY, QQQ began showing signs of a bearish head & shoulders pattern throughout their range-bound August decline, which will be something to keep an eye on in the coming weeks.
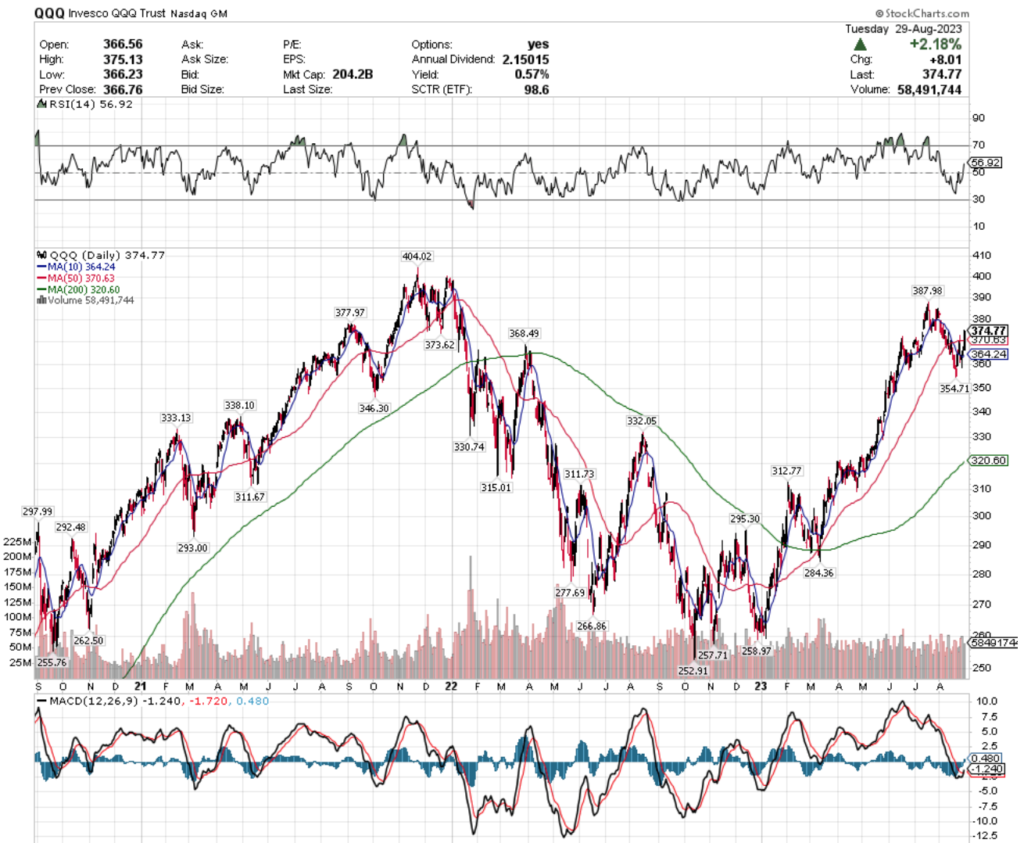
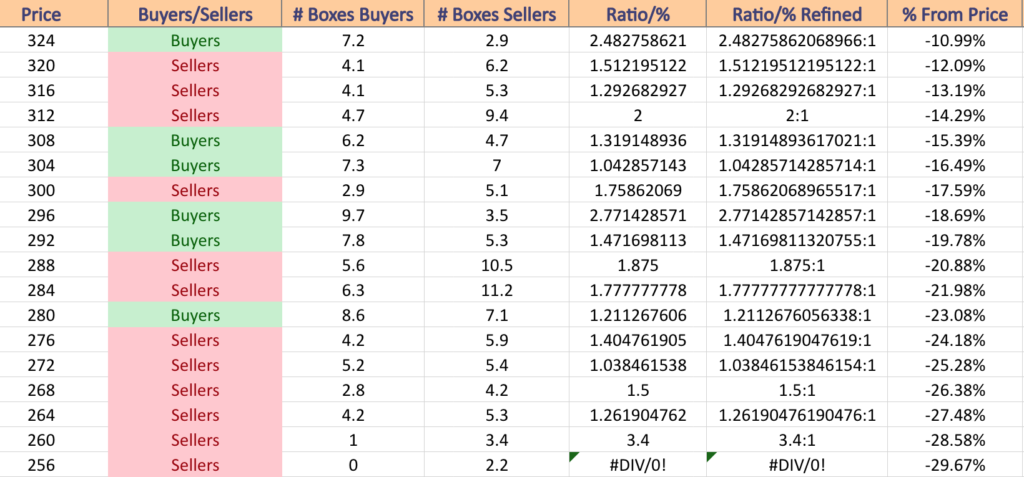
Aside from QQQ’s 10 & 50 day moving averages, their next level of support from the current price is -5.35% below their current price & the next highest level from there is -14.45% below the current price (200 day moving average).
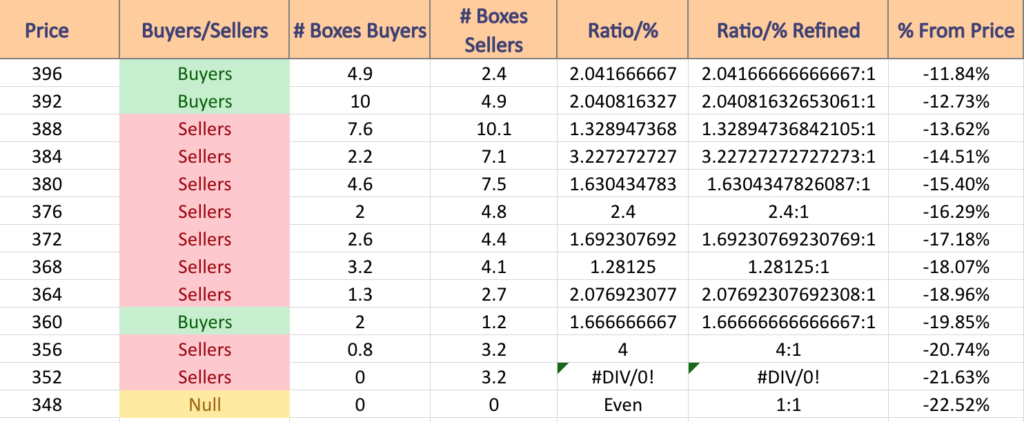
The charts & price:volume list below shows how their trading volume has been at each price-range that they have traded at over the past 2-3 years & there is a 3 year candlestick chart for an additional visual below.
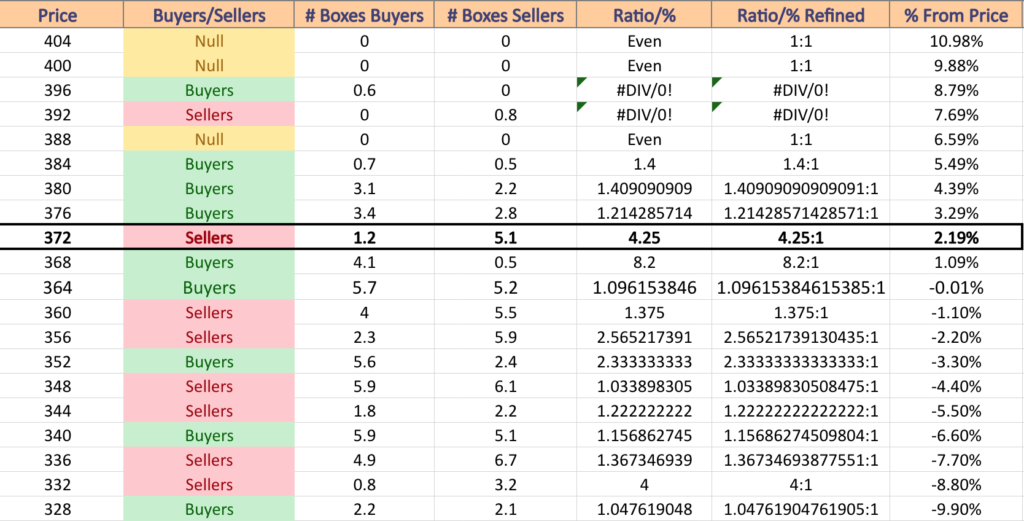
$404 – NULL – 0:0*; +10.98% From Current Price Level
$400 – NULL – 0:0*; +9.88% From Current Price Level
$396 – Buyers – 0.6:0*; +8.79% From Current Price Level
$392 – Sellers – 0.8:0*; +7.69% From Current Price Level
$388 – NULL – 0:0*; +6.59% From Current Price Level
$384 – Buyers – 1.4:1; +5.49% From Current Price Level
$380 – Buyers – 1.41:1; +4.39% From Current Price Level
$376 – Buyers – 1.21:1; +3.29% From Current Price Level
$372 – Sellers – 4.25:1; +2.19% From Current Price Level – Current Price Level
$368 – Buyers – 8.2:1; +1.09% From Current Price Level – 50 Day Moving Average
$364 – Buyers – 1.10:1; -0.01% From Current Price Level – 10 Day Moving Average
$360 – Sellers – 1.38:1; -1.1% From Current Price Level
$356 – Sellers – 2.57:1; -2.2% From Current Price Level
$352 – Buyers – 2.33:1; -3.3% From Current Price Level
$348 – Sellers – 1.03:1; -4.4% From Current Price Level
$344 – Sellers – 1.22:1; -5.5% From Current Price Level
$340 – Buyers – 1.16:1; -6.6% From Current Price Level
$336 – Sellers – 1.37:1; -7.7% From Current Price Level
$332 – Sellers – 4:1; -8.8% From Current Price Level
$328 – Buyers – 1.05:1; -9.9% From Current Price Level
$324 – Buyers – 2.48:1; -10.99% From Current Price Level
$320 – Sellers – 1.51:1; -12.09% From Current Price Level – 200 Day Moving Average
$316 – Sellers – 1.29:1; -13.19% From Current Price Level
$312 – Sellers – 2:1; -14.29% From Current Price Level
$308 – Buyers – 1.32:1; -15.39% From Current Price Level
$304 – Buyers – 1.04:1; -16.49% From Current Price Level
$300 – Sellers – 1.76:1; -17.59% From Current Price Level
$296 – Buyers – 2.77:1; -18.69% From Current Price Level
$292 – Buyers – 1.47:1; -19.78% From Current Price Level
$288 – Sellers – 1.875:1; -20.88% From Current Price Level
$284 – Sellers – 1.78:1; -21.98% From Current Price Level
$280 – Buyers – 1.21:1; -23.08% From Current Price Level
$276 – Sellers – 1.40:1; -24.18% From Current Price Level
$272 – Sellers – 1.03:1; -25.28% From Current Price Level
$268 – Sellers – 1.5:1; -26.38% From Current Price Level
$264 – Sellers – 1.26:1; -27.48% From Current Price Level
$260 – Sellers – 3.4:1; -28.58% From Current Price Level
$256 – Sellers – 2.2:0*; -29.67% From Current Price Level
Technical Analysis & Price:Volume Sentiment Analysis Of The Russell 2000 (IWM)
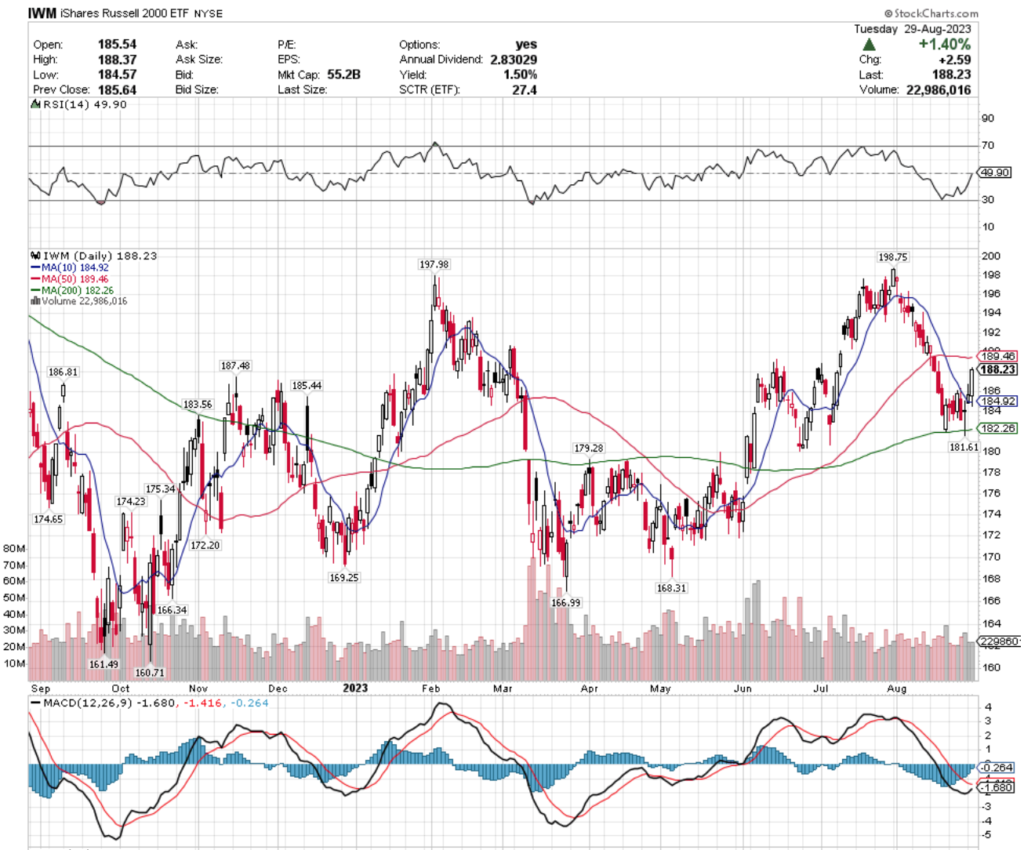
The Russell 2000 (IWM) is currently -5.29% below their 52-week high that occurred on July 31,2023.
Their RSI is neutral at 49.9, with a bearish MACD that is beginning to show signs of potentially completing a bullish crossover in the coming days.
Trading volumes for the past week have been -12.86% below average compared to the year prior (24,613,560 vs. 28,245,386.45) & the past month’s average volumes have been -12.29% below the year prior’s average (24,773,543.48 vs. 28,245,386.45).
This signal of waning enthusiasm also occurred during a steep decline for IWM from profit taking off of the 52-week high, however their support levels along the way did not show much signs of strength in the decline.
Friday’s long-legged doji signaled severe indecision to close out the week, on high volume compared to the other days & Monday’s session resulted in a shooting star candle, which signals bearish sentiment.
However, the shooting star was supported by the 10 day moving average, but that session & yesterday’s were both on mediocre volume, which does not confirm bullish sentiment behind either days’ advances.
IWM has traded at a much less accelerated pace compared to SPY & QQQ, so it has more support levels nearby than the previous two mentioned ETFs, but it too has begun to show signs of a bearish head & shoulders pattern since the middle of August.
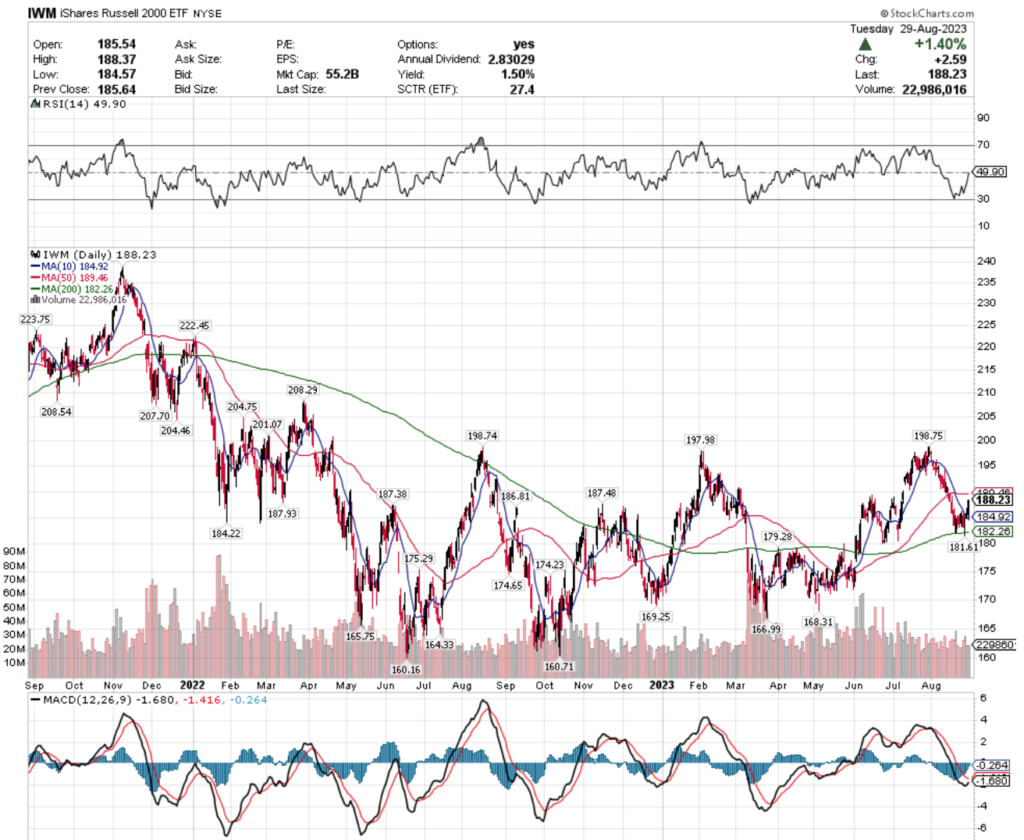
Below are the lists of the volumes at each of the price levels IWM has traded at over the past 1-2 years, as well as a 2 year candlestick chart to help better visualize how their support levels may hold up in the coming weeks.
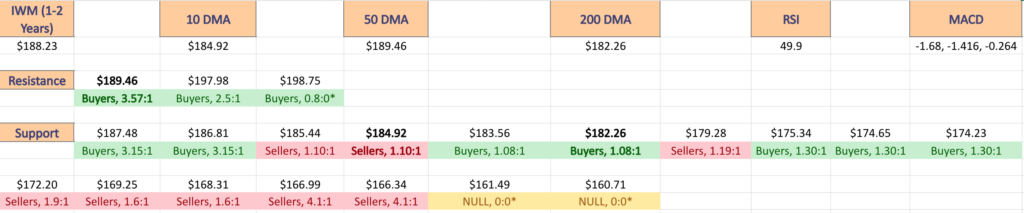
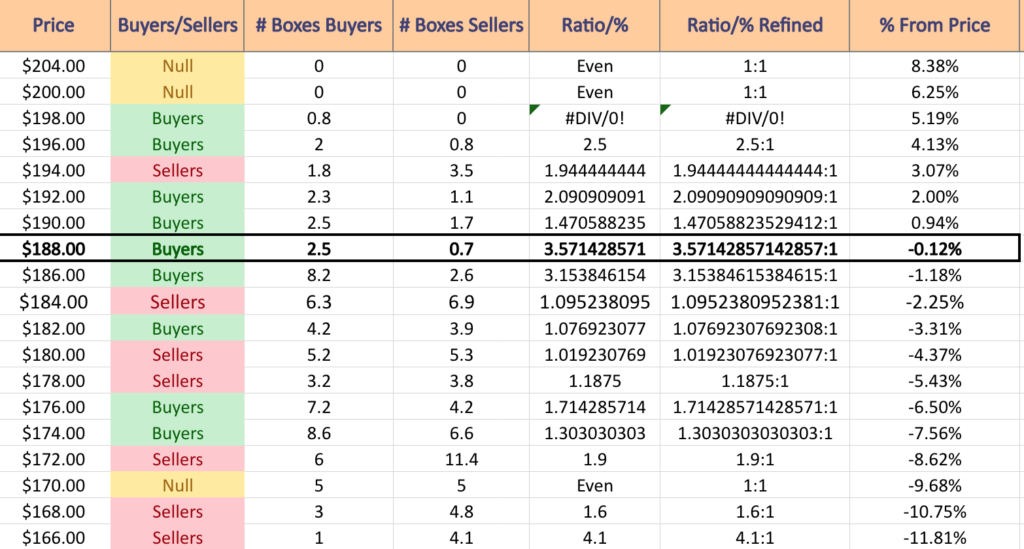
$204 – NULL – 0:0*; +8.38% From Current Price Level
$200 – NULL – 0:0*; +6.25% From Current Price Level
$198 – Buyers – 0.8:0*; +5.19% From Current Price Level
$196 – Buyers – 2.5:1; +4.13% From Current Price Level
$194 – Sellers – 1.94:1; +3.07% From Current Price Level
$192 – Buyers – 2.09:1; +2% From Current Price Level
$190 – Buyers – 1.47:1; +0.94% From Current Price Level
$188 – Buyers – 3.57:1; -0.12% From Current Price Level – Current Price Level & 50 Day Moving Average
$186 – Buyers – 3.15:1; -1.18% From Current Price Level
$184 – Sellers – 1.10:1; -2.25% From Current Price Level – 10 Day Moving Average
$182 – Buyers – 1.08:1; -3.31% From Current Price Level – 200 Day Moving Average
$180 – Sellers – 1.02:1; -4.37% From Current Price Level
$178 – Sellers – 1.19:1; -5.43% From Current Price Level
$176 – Buyers – 1.71:1; -6.5% From Current Price Level
$174 – Buyers – 1.3:1; -7.56% From Current Price Level
$172 – Sellers – 1.9:1; -8.62% From Current Price Level
$170 – Even – 1:1; -9.68% From Current Price Level
$168 – Sellers – 1.6:1; -10.75% From Current Price Level
$166 – Sellers – 4.1:1; -11.81% From Current Price Level
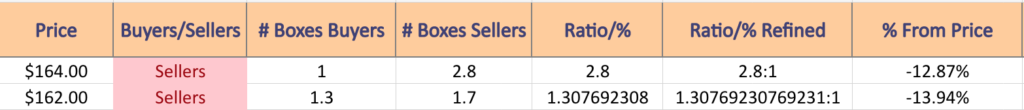
$164 – Sellers – 2.8:1; -12.87% From Current Price Level
$162 – Sellers – 1.31:1; -13.94% From Current Price Level
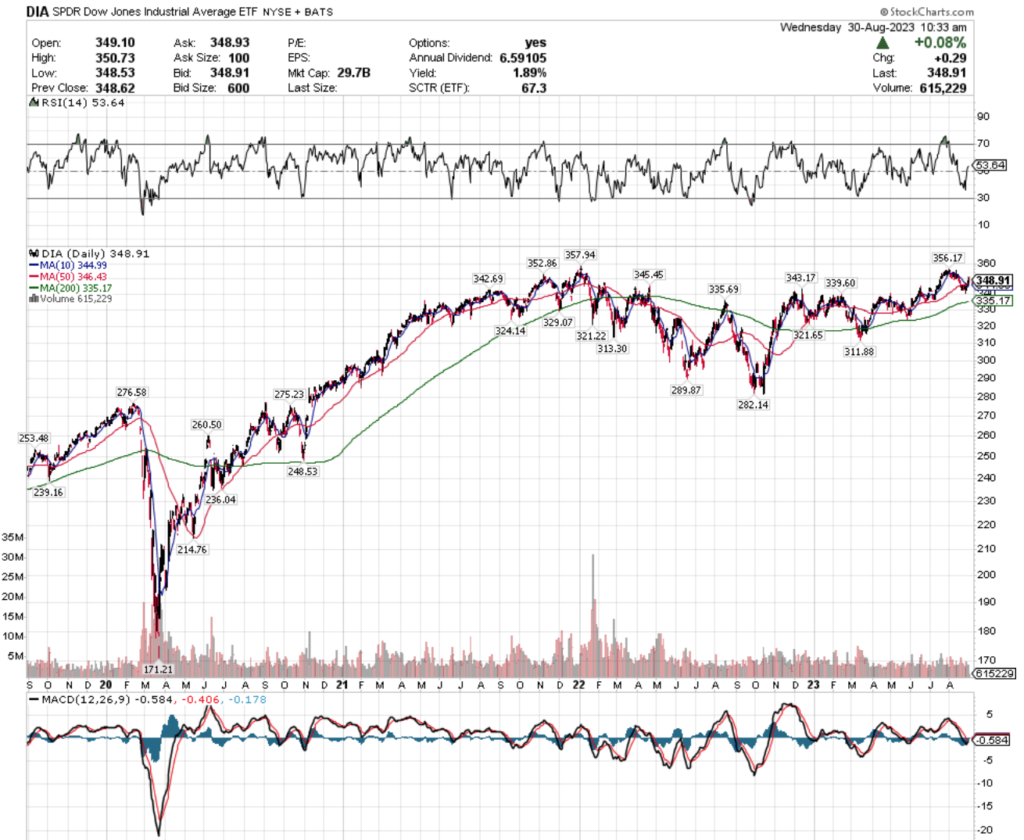
Technical Analysis & Price:Volume Sentiment Analysis Of The Dow Jones Industrial Average (DIA)
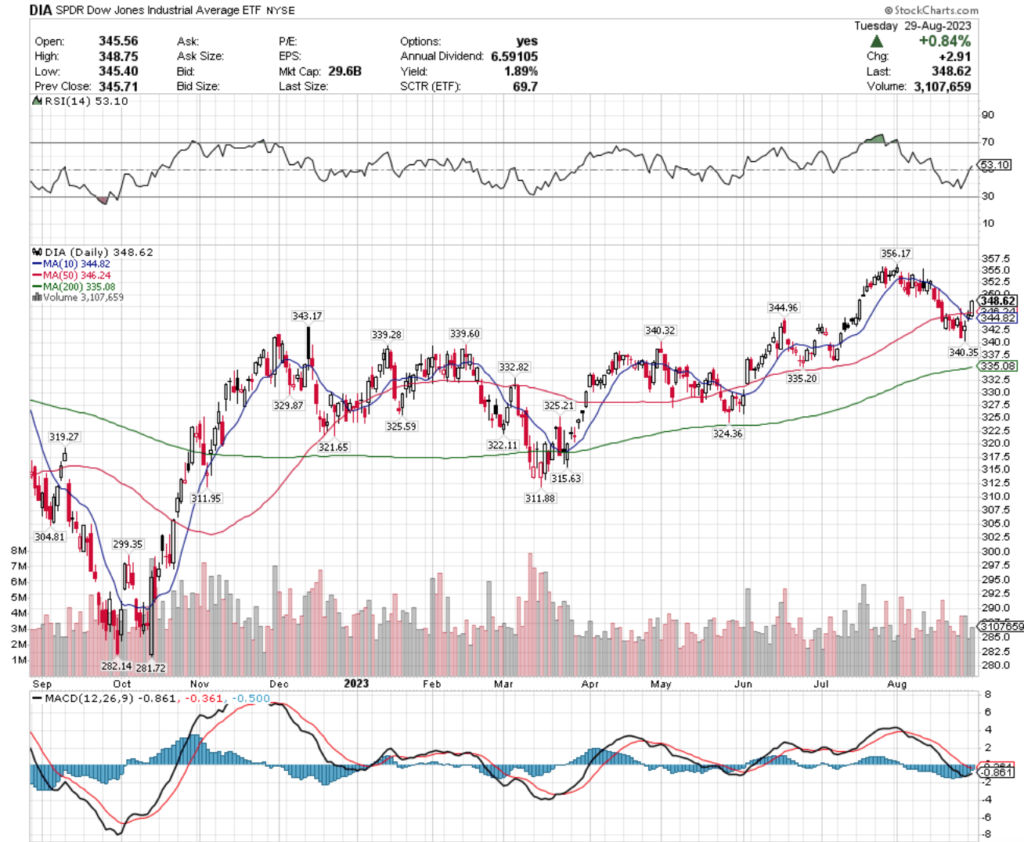
The Dow Jones Industrial Average (DIA) is currently trading -2.12% below its 52-week high from the end of July 2023.
Their RSI is neutral at 53.1, with a bearish MACD that looks to be trying to turn bullish in the coming days if they can keep up the gains of the past few sessions.
Their trading volume over the past month has declined -10.55% compared to the average volume of the past year (3,275,478.26 vs. 3,661,896.81), with this past week’s volume falling even further to -13.69% below the year prior’s average (3,160,440 vs. 3,661,896.81).
Much like SPY & QQQ, DIA’s strongest volume days of the week were Friday & Monday.
Thursday they were unable to stay above their 10 & 50 day moving averages & ultimately closed below their open, and Friday resulted in a spinning top candlestick that tested lower lows than Thursday’s session.
Monday’s gap up with on very limited volume, which is also a sign of potential weakness on the horizon.
DIA’s 10 & 50 day moving averages are two of their next three levels of support, but do not look particularly strong.
The tables below outline their volume at each price level that they’ve traded at over the past 3-4 years & I have included a 4 year chart below as well.
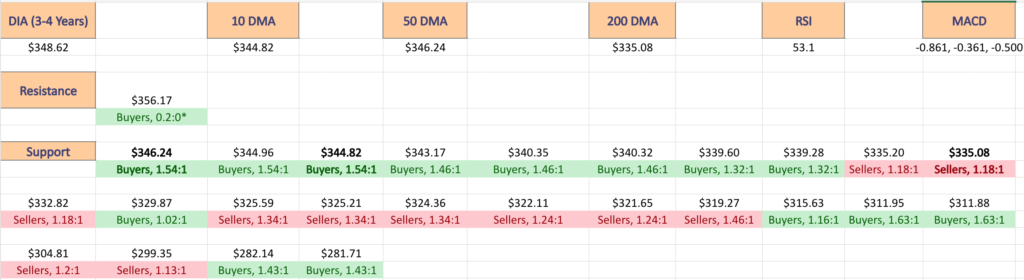
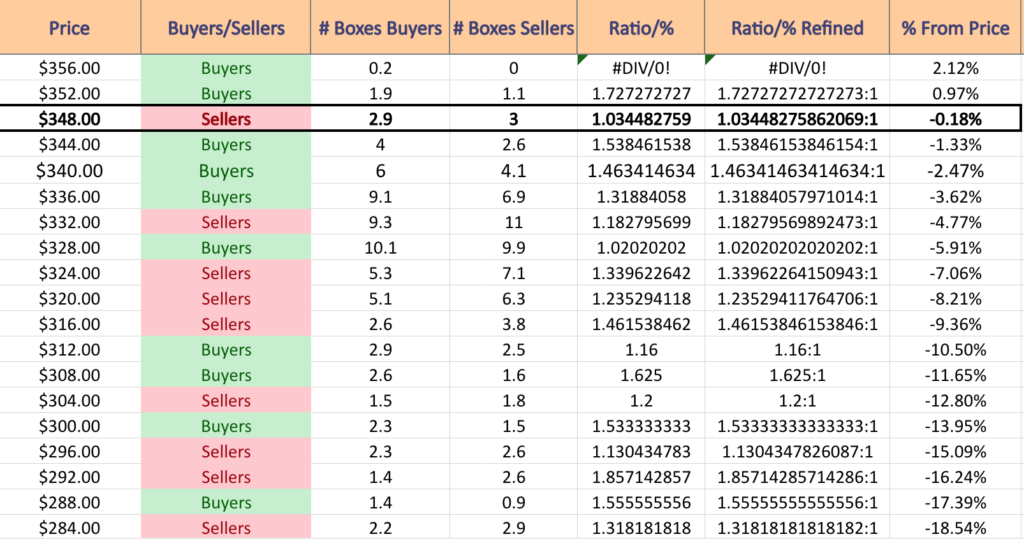
$356 – Buyers – 0.2:0*; +2.12% From Current Price Level
$352 – Buyers – 1.73:1; +0.97% From Current Price Level
$348 – Sellers – 1.03:1; -0.18% From Current Price Level – Current Share Price Level
$344 – Buyers – 1.54:1; -1.33% From Current Price Level – 10 & 50 Day Moving Average
$340 – Buyers – 1.46:1; -2.47% From Current Price Level
$336 – Buyers – 1.32:1; -3.62% From Current Price Level
$332 – Sellers – 1.18:1; -4.77% From Current Price Level – 200 Day Moving Average
$328 – Buyers – 1.02:1; -5.91% From Current Price Level
$324 – Sellers – 1.34:1; -7.06% From Current Price Level
$320 – Sellers – 1.24:1; -8.21% From Current Price Level
$316 – Sellers – 1.46:1; -9.36% From Current Price Level
$312 – Buyers – 1.16:1; -10.5% From Current Price Level
$308 – Buyers – 1.63:1; -11.65% From Current Price Level
$304 – Sellers – 1.2:1; -12.8% From Current Price Level
$300 – Buyers – 1.53:1; -13.95% From Current Price Level
$296 – Sellers – 1.13:1; -15.09% From Current Price Level
$292 – Sellers – 1.86:1; -16.24% From Current Price Level
$288 – Buyers – 1.56:1; -17.39% From Current Price Level
$284 – Sellers – 1.32:1; -18.54% From Current Price Level
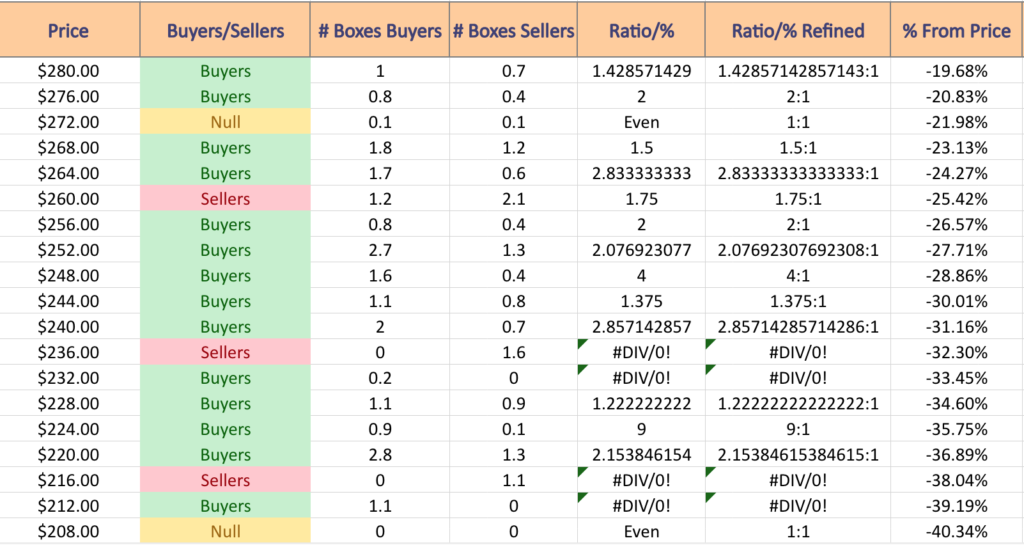
$280 – Buyers – 1.43:1; -19.68% From Current Price Level
$276 – Buyers – 2:1; -20.83% From Current Price Level
$272 – Even – 1:1; -21.98% From Current Price Level
$268 – Buyers – 1.5:1; -23.13% From Current Price Level
$264 – Buyers – 2.83:1; -24.27% From Current Price Level
$260 – Sellers – 1.75:1; -25.42% From Current Price Level
$256 – Buyers – 2:1; -26.57% From Current Price Level
$252 – Buyers – 2.08:1; -27.71% From Current Price Level
$248 – Buyers – 4:1; -28.86% From Current Price Level
$244 – Buyers 1.38:1; -30.01% From Current Price Level
$240 – Buyers – 2.86:1; -31.16% From Current Price Level
$236 – Sellers – 1.6:0*; -32.3% From Current Price Level
$232 – Buyers – 0.2:0*; -33.45% From Current Price Level
$228 – Buyers – 1.22:1; -34.6% From Current Price Level
$224 – Buyers – 9:1; -35.75% From Current Price Level
$220 – Buyers – 2.15:1; -36.89% From Current Price Level
$216 – Sellers – 1.1:0*; -38.04% From Current Price Level
$212 – Buyers – 1.1:0*; -39.19% From Current Price Level
$208 – NULL – 0:0*; -40.34% From Current Price Level
Tying It All Together
The lists & images above paint the picture as to how investors & traders have behaved at various price levels that SPY, QQQ, IWM & DIA have been at in recent history.
It is not meant to serve as investment/trading advice, and is simply a way to visualize what investor/trader sentiment has been like at each of the price levels mentioned, as well as what it was at levels of support & resistance that are denoted in the images & lists.
As always, do your own due diligence before making investing/trading decisions.
For more on the methodology on how the data was collected & put together, please refer to our original Price:Volume analysis.
*** I DO NOT OWN SHARES OF NOR OPTIONS CONTRACT POSITIONS IN SPY, QQQ, IWM, or DIA AT THE TIME OF PUBLISHING THIS ARTICLE ***