SPY, the SPDR S&P 500 ETF gained +2.23% last week, faring second best of the major four indexes in a week that was bullish across the board.
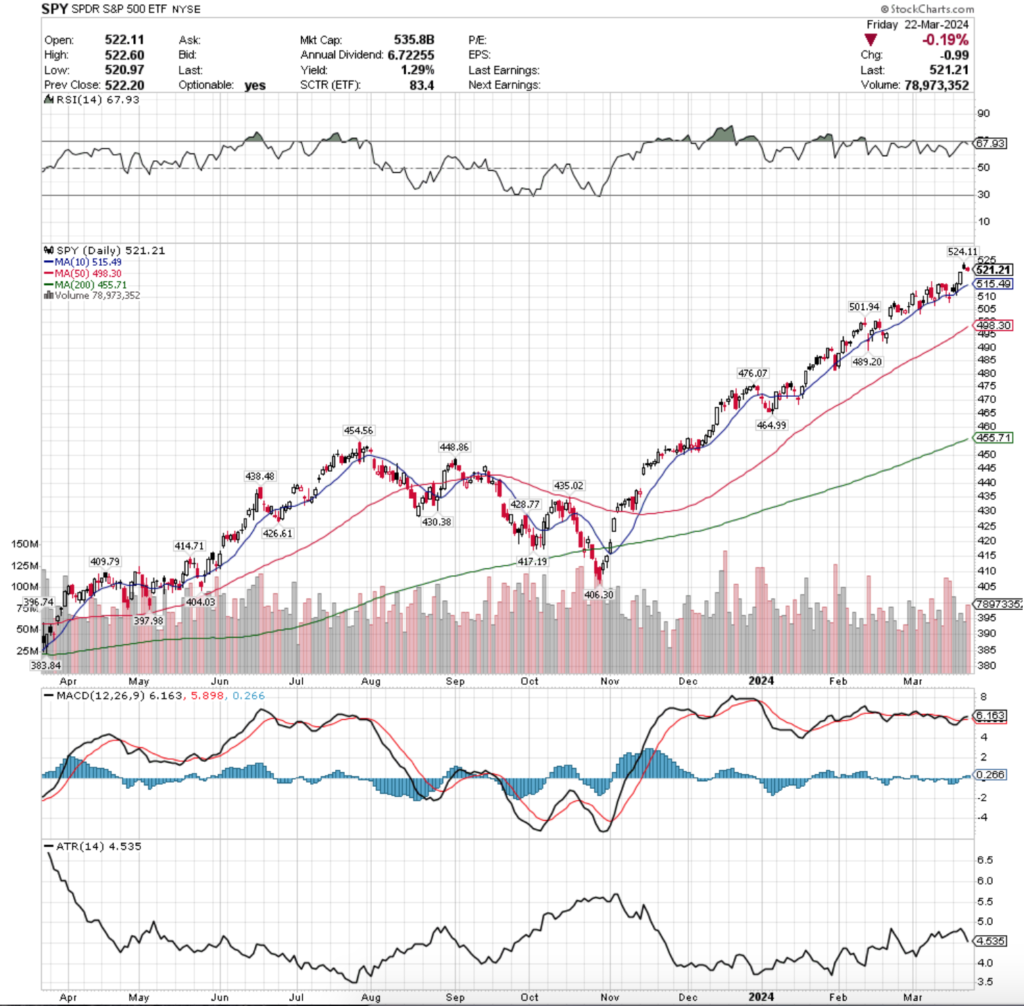
Their RSI is trending back from near-overbought conditions & is currently at 67.93, while their MACD is currently bullish, but looking to be losing steam & setting up for a bearish crossover in the coming sessions.
Volumes were -11.69% below average last week compared to the year prior (69,050,161 vs. 78,190,894), with Monday’s advancing session being the strongest volume day, while Friday’s declines into the weekend came in a close second highest for the week.
Monday kicked the week off on an uncertain note, with a spinning top candle that stayed above the 10 day moving average‘s support, however it closed lower than it opened, indicating that there was some risk-aversion.
However, Tuesday’s bullish engulfing candle showed that the bulls were back in the marketplace running up to Wednesday’s FOMC announcement.
Tuesday’s candle tested lower & temporarily dipped its lower shadow below the 10 DMA, but was able to close higher.
Wednesday saw a bullish advancing session on the heels of the interest rate announcement, where Chair Powell hinted that there is still a possibility of three rate cuts in 2024 (although he did not explicitly say it), which got market participants excited.
Thursday started off with a gap up & tested higher, setting a new all-time high for SPY, but began to signal trouble for the week’s rally, as the session closed lower than it opened, resulting in a filled candle.
This set the stage for Friday’s risk-off declines going into the weekend, which also indicated further uncertainty as the day resulted in a narrow-range spinning top candle on a -0.19% decline for the day.
The high volume level of Friday’s session compared to the other sessions of the week will be something to keep an eye on going into this week, where we will see if it was just a one-day risk off/profit taking event, or if the losses will spark a wave of near-term declines.
As has been mentioned in previous weeks’ posts, the 10 DMA will be an area to watch closely, where it is currently ~-1.2% below Friday’s closing price acting as the first line of support.
It will also be important to keep an eye on the 50 day moving average as well, which is currently the third support touch-point, but advancing higher daily & currently sits ~-3% below the 10 DMA.
As the two moving averages draw nearer to one another we will either be seeing a consolidation of sorts, or else declines that will cause them to act as resistance levels applying downward pressure on the price of SPY.
Their Average True Range has been trending downward the past few days due to the week’s lack of volatility, but it is likely to begin perking up this week.
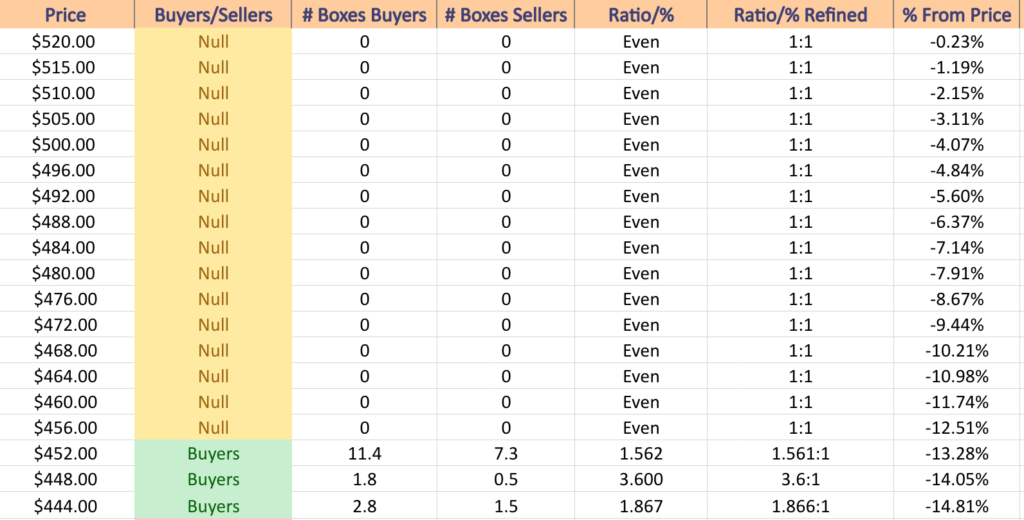
SPY has support at the $515.49 (10 Day Moving Average; Volume Sentiment: NULL, 0:0*), $501.94 (Volume Sentiment: NULL, 0:0*), $498.30 (50 Day Moving Average; Volume Sentiment: NULL, 0:0*) & $489.20/share (Volume Sentiment: NULL, 0:0*), with resistance at the $524.11/share (All-Time High; Volume Sentiment: NULL, 0:0*) price level.
QQQ, the Invesco QQQ Trust ETF advanced +3.01% last week, as market participants rushed into the tech-heavy index after hearing that there may still possibly be three FOMC interest rate cuts lined up for the remainder of this year.
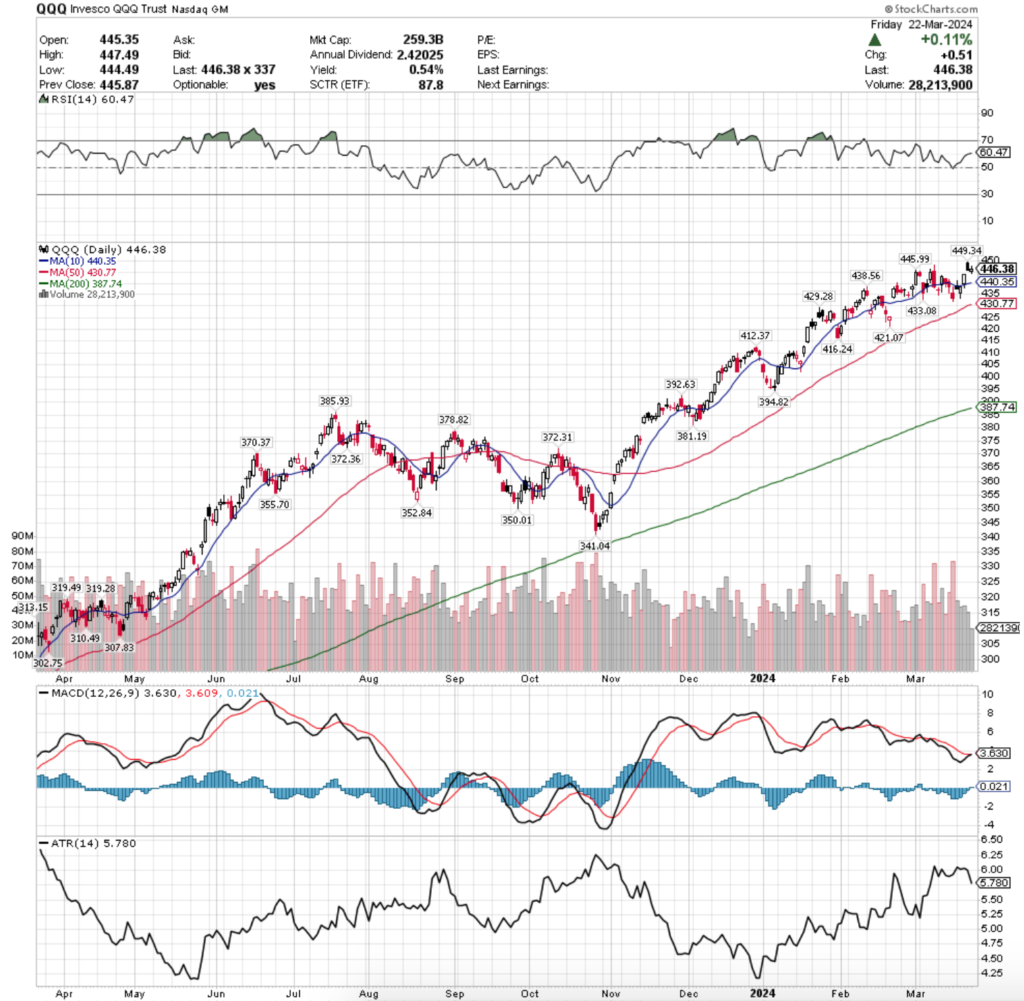
Their RSI is currently 60.47, but is beginning to show signs of rolling over bearishly in the near-term, while their MACD is currently bullish, but relatively muted & hugging the signal line tight, indicating a lack of bullish strength & a likely bearish crossover around the near-term corner.
Volumes were very low last week at -19.01% below average compared to the year prior (40,263,908 vs. 49,715,249), which is problematic due to the fact that last week was five advancing sessions for QQQ.
The lack of volume shows significant weariness about QQQ being at these high price levels, as it recently reached a new all-time high on Thursday following the FOMC announcement & press conference (like SPY).
Another troubling trend with last week’s volume is that it was highest at the beginning of the week & began to decline as the week wore on, until Friday’s lowest volume session of the week.
Monday saw the highest volume on a session marked with uncertainty, as the day opened above the support of the 10 day moving average, tested higher, and ultimately settled lower than the day’s opening price, but above the closing price of Friday & beneath the resistance of the 10 DMA.
Tuesday opened even lower beneath the 10 day moving average’s resistance, tested lower (lower shadow on day’s candle), before closing higher, closely aligned with the 10 DMA.
Wednesday began on a cautious note as QQQ opened in line with the 10 DMA’s support, tested beneath it, before ultimately rallying into the close following the FOMC rate decision.
Thursday is where the weakness began to be exposed however, as the session gapped higher, tested slightly higher than the open, before resulting in a filled candle due to the day’s close being lower than the open.
It is also worth noting that Thursday’s volume was lower than the tight volume range the first three days of the week shared.
Friday continued the theme of uncertainty & fear beginning to creep into the NASDAQ, as the session closed with very low volume on a spinning top candle, but up +0.11% on the day.
Due to the consolidation range of the previous two weeks & Thursday’s gap up QQQ is a bit better positioned away from its 10 & 50 day moving average’s support levels (~-1.3% from Friday’s close for the 10 DMA; ~-3.5% for the 50 DMA) & it has more near-term support levels that may ease any declines in the near-future.
This week will require a close eye on volumes to see if profits are taken from last week’s 5 straight advancing sessions, as well as a look at the relationship between price level:10 DMA, price level:50 DMA & 10:50 DMA relationships to see what sort of near-term support/resistance levels influence the broader direction of QQQ & the NASDAQ 100.
Their Average True Range has been declining recently, as the past week featured very little volatility, and any uptick in that will be important to keep an eye on in the event that it spurs a correction in pricing.
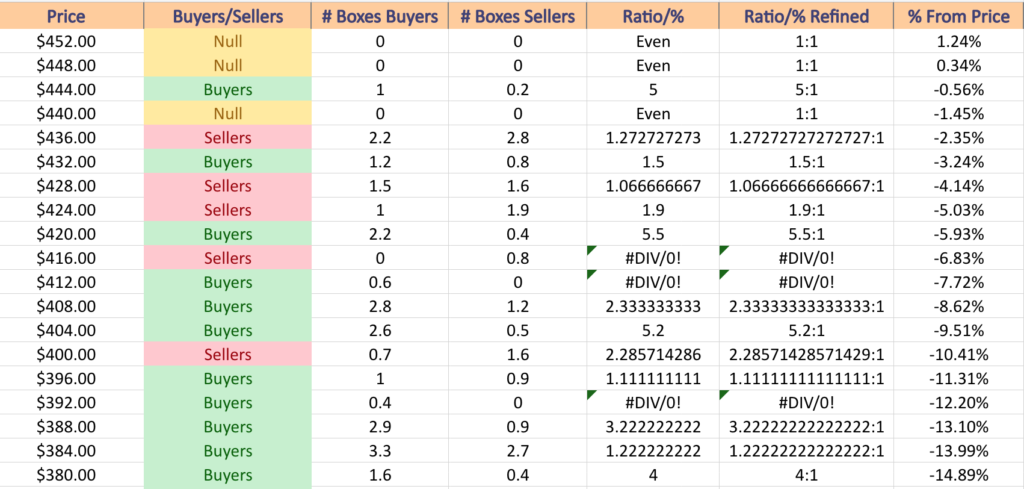
QQQ has support at the $445.99 (Volume Sentiment: Buyers, 5:1), $440.35 (10 Day Moving Average; Volume Sentiment: NULL, 0:0*), $438.56 (Volume Sentiment: Sellers, 1.27:1) & $433.08/share (Volume Sentiment: Buyers, 1.5:1), with resistance at the $449.34/share (All-Time High; Volume Sentiment: NULL, 0:0*) price level.
IWM, the iShares Russell 2000 ETF added +1.57% last week, as investors were not as eager to dive into small cap names as they had been in weeks prior.
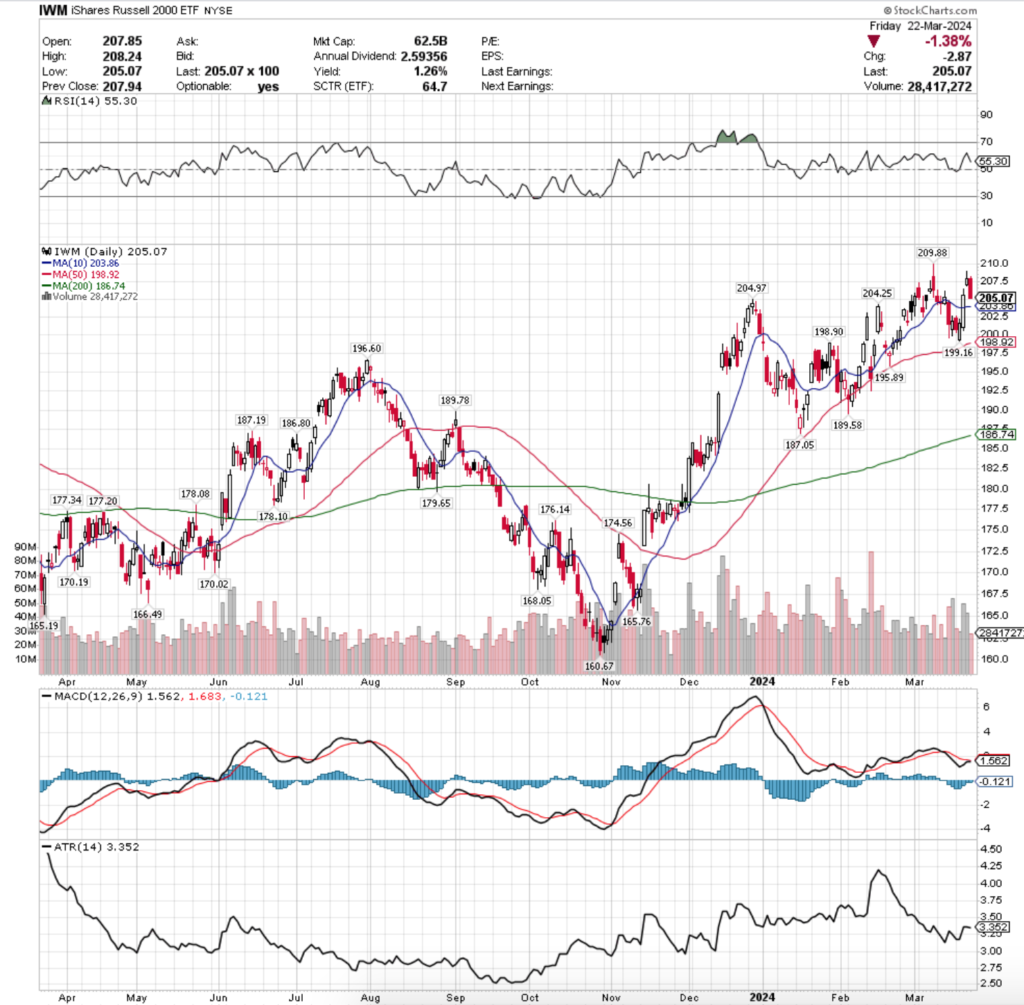
Their RSI is trending back towards the neutral level & currently sits at 55.30, while their MACD is still bearish & approaching the signal line weakly, looking as though it won’t have the strength to cross over bullishly this week & will continue on bearishly.
Volumes were +5.85% above average last week compared to the year prior (36,542,969 vs. 34,524,424), most attributed to Wednesday & Thursday’s advancing session volume after the FOMC interest rate decision announcement, which does not necessarily indicate that there is much strong sentiment in IWM currently.
Monday kicked the week off on a downhill note, with a declining session on relatively muted volume indicating that there was not much in terms of interest & bullish sentiment among market participants.
Tuesday signaled a glimmer of hope, but still no rush by the bulls as the session advanced, but on volumes that were near as weak as Monday’s, as investors were still skeptical of the IWM with the FOMC interest rate decision looming.
Wednesday opened below Tuesday’s close, tested a bit lower, before rallying on the announcement from the Fed & Chair Powell’s press conference, busting through the resistance of the 10 day moving average, testing higher, but ultimately settling below the day’s highs, leading to the upper shadow on the session’s candle.
This sentiment carried into Thursday, where the session gapped up, but ultimately sent warning signs for IWM, as the day’s candle resulted in a shooting star (near-term bearish implications) on volumes that were just below the levels seen the day before in the wide-range session rally of Wednesday.
Friday ended the week on a risk-off/profit taking note, but the wide range of the day’s candle & limited upper shadow with no lower shadow has further near-term bearish implication for IWM.
Much like SPY & QQQ, IWM’s fate this week will be heavily dependent on how their moving averages hold up as support, with the price in close proximity to the 10 DMA & the 50 DMA trailing just behind it.
The closer that the two moving averages get, the more likely it is that we will be a cool down period & should their support be broken it will be important to watch how the downwards pressure that their resistance causes impacts IWM’s price performance.
IWM has a decent amount of nearby support levels that can help slow down any declines in the near-term, but caution should be taken this week, particularly with how jumpy prices have been over the past few weeks.
Their Average True Range has flattened out after being in an uptrend in the wake of the previous week’s volatility, but should the 10 DMA’s support break down expect to see it increase & there to be a jump in volatility for IWM.
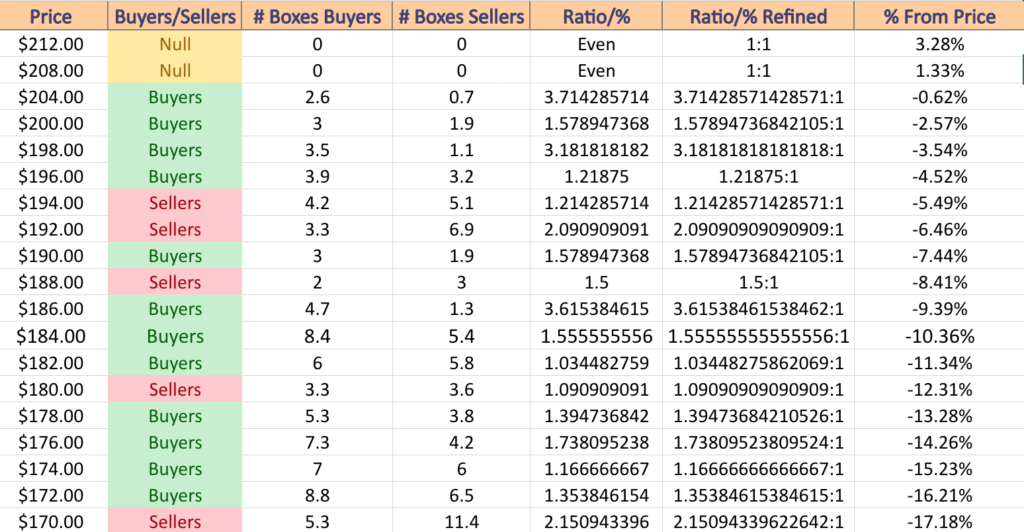
IWM has support at the $204.97 (Volume Sentiment: Buyers, 3.71:1), $204.25 (Volume Sentiment: Buyers, 3.71:1), $203.86 (10 Day Moving Average; Volume Sentiment: Buyers, 1.58:1) & $199.16/share (Volume Sentiment: Buyers, 3.18:1), with resistance at the $209.88/share (52-Week High; Volume Sentiment: NULL, 0:0*) price level.
DIA, the SPDR Dow Jones Industrial Average ETF climbed +1.95% last week, with the bulk of the advances thanks to Wednesday & Thursday’s sessions.
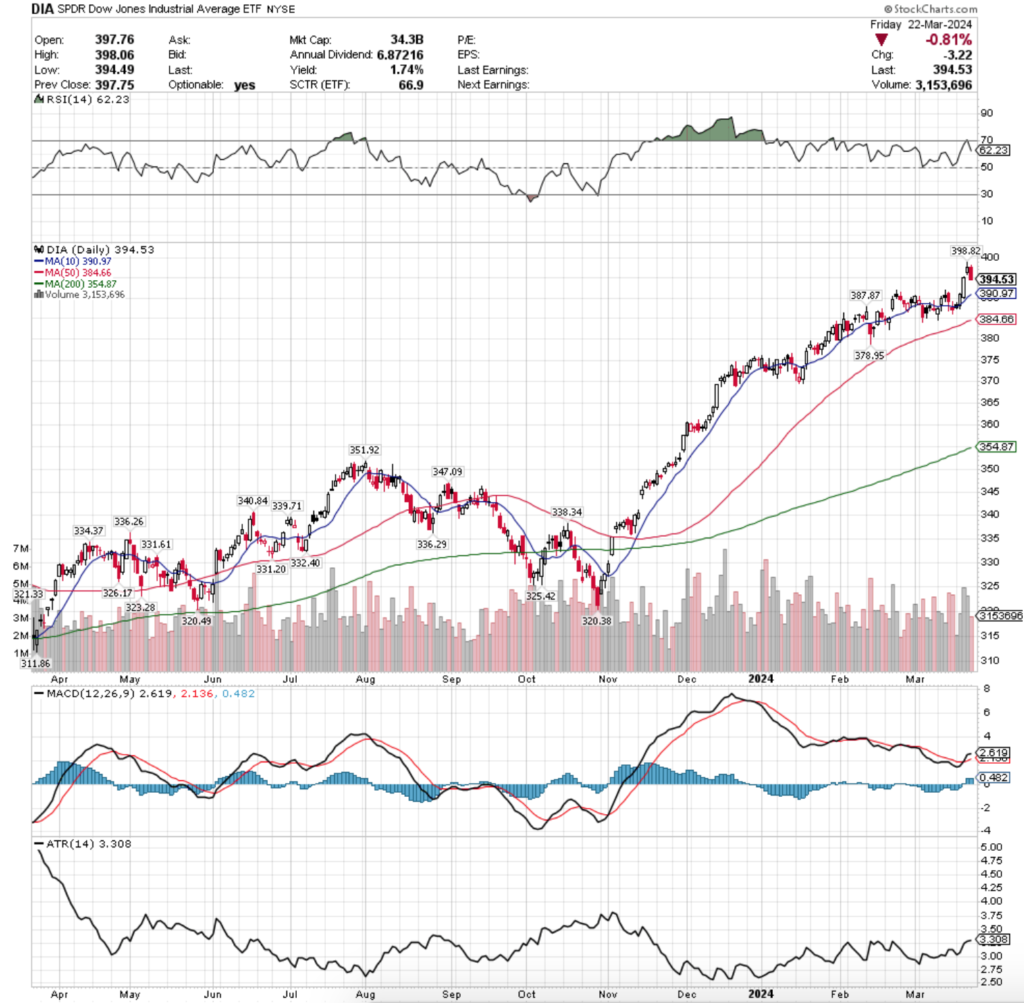
Their RSI is currently 62.23 as it comes down from overbought conditions & their MACD is currently bullish, but beginning to show signs of curling over towards the signal line which would result in a bearish crossover in the near-term.
Volumes were +3.56% above average last week compared to the year prior (3,537,777 vs. 3,416,152), which is interesting given that aside from Wednesday & Thursday the rest of the week contained relatively low volume, signaling that market participants are beginning to become exhausted & losing interest in adding risk to DIA.
Monday kicked the week off on very muted volume & a rather uncertain note, as the day opened above the 10 day moving average’s support, tested a bit higher, before ultimately closing lower than its open & beneath the resistance of the 10 DMA.
Tuesday opened about where Monday left off, tested a bit lower (lower shadow), before surging beyond the 10 DMA, but volumes were still not indicative of much strength behind the move in price.
Wednesday opened above the 10 DMA, tested lower but the support level was able to hold up & ultimately power prices higher once the FOMC announcement took place.
An observation about Wednesday’s session for DIA: there was a very small upper shadow, signaling that there was not much appetite for risk much higher than the day’s close.
Still, Thursday saw a gap higher, which will it did test a bit lower than where it opened, went on to result in a new all-time high being reached.
Wednesday had the highest volume of the week, with Thursday’s session following closely behind it leading into Friday’s risk-off/profit taking session that filled most of the window created by Thursday’s gap up.
Friday’s volumes imply that there is still more risk-off sentiment in the market, which will be something for market participants to keep an eye on in the coming week.
They also will want to be mindful of the 10 & 50 day moving averages, which are currently drawing nearer to both one another & the current price level.
DIA has limited near-term support levels due to the nature of the slow/steady gains that they have made in 2024, as well as their consolidation periods that have marked the better parts of February & March of 2024 following their aggressive ascent that took place between late October & mid-December of 2023.
Their Average True Range has ticked up following the latter half of last week as volatility has expanded since the aforementioned consolidation range(s).
Expect to see a continued uptick in DIA ATR, as volatility looks to be increasing in the near-term.
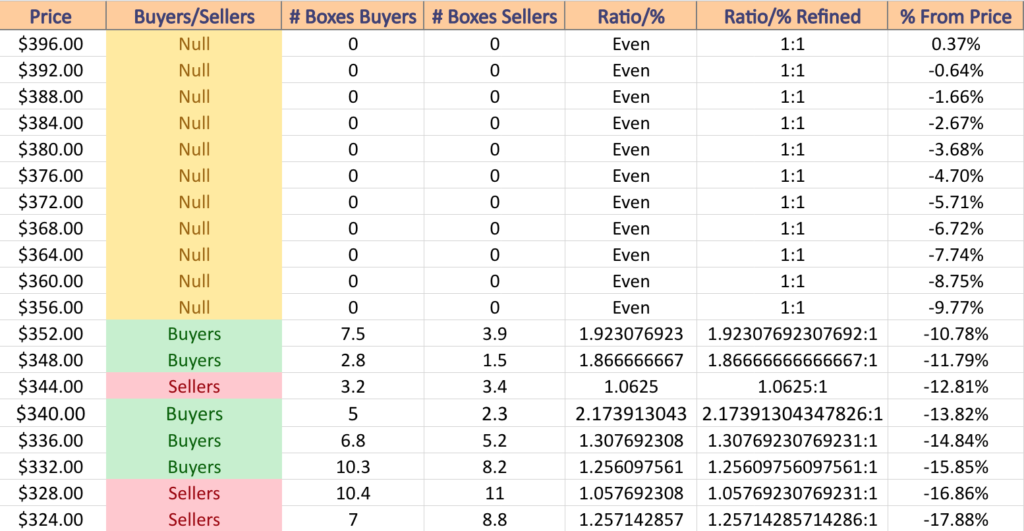
DIA has support at the $390.97 (10 Day Moving Average; Volume Sentiment: NULL, 0:0*), $387.87 (Volume Sentiment: NULL, 0:0*), $384.66 (50 Day Moving Average; Volume Sentiment: NULL, 0:0*) & $378.95/share (Volume Sentiment: NULL, 0:0*), with resistance at the $398.82/share (All-Time High; Volume Sentiment: NULL, 0:0*) price level.
The Week Ahead
Monday kicks the week off with New Home Sales data at 10 am.
There are no earnings reports of importance being released on Monday.
Durable-Goods Orders & Durable-Goods minus Transportation data is released Tuesday at 8:30 am, followed by S&P Case-Schiller Home Price Index (20 Cities) data at 9 am & Consumer Confidence data at 10 am.
Tuesday morning before the bell’s earnings calls include GDS Holdings, McCormick, & TD Synnex, with Concentrix, GameStop, nCino & Progress Software all scheduled to report earnings after the day’s closing bell.
There are no major economic data announcements scheduled for Wednesday.
Wednesday morning before the bell’s earnings reports include Cintas, Paychex & UniFirst, with Braze, H.B. Fuller, Jefferies, MillerKnoll, Sprinklr & Verint Systems scheduled to report earnings after the closing bell.
Thursday brings us Initial Jobless Claims & GDP (2nd Revision) data at 8:30 am, Chicago Business Barometer (PMI) data at 9:45 am & Pending Home Sales & Consumer Sentiment (Final) data at 10 am.
Walgreens & BRP are scheduled to report earnings before the opening bell on Thursday, followed by Oxford Industries, Semtech, Sharecare, Torrid & Vuzix reporting after the day’s closing bell.
The week winds down Friday with Advanced U.S. Trade Balance in goods, Advanced Retail Inventories, Personal Income (Nominal), Personal Spending (Nominal), PCE Index, Core PCE Index, Core PCE Index, PCE (Year-over-Year) & Core PCE (Year-over-Year) data at 8:30 am.
Friday will not have any earnings reports due to the market being closed for Good Friday.
See you back here next week!
*** I DO NOT OWN SHARES OR OPTIONS CONTRACT POSITIONS IN SPY, QQQ, IWM OR DIA AT THE TIME OF PUBLISHING THIS ARTICLE ***