SPY, the SPDR S&P 500 ETF dipped -0.95% this week, while the VIX closed at 20.33, indicating an implied one day move of +/-1.28% & an implied one month move of +/-5.88% for the S&P 500.
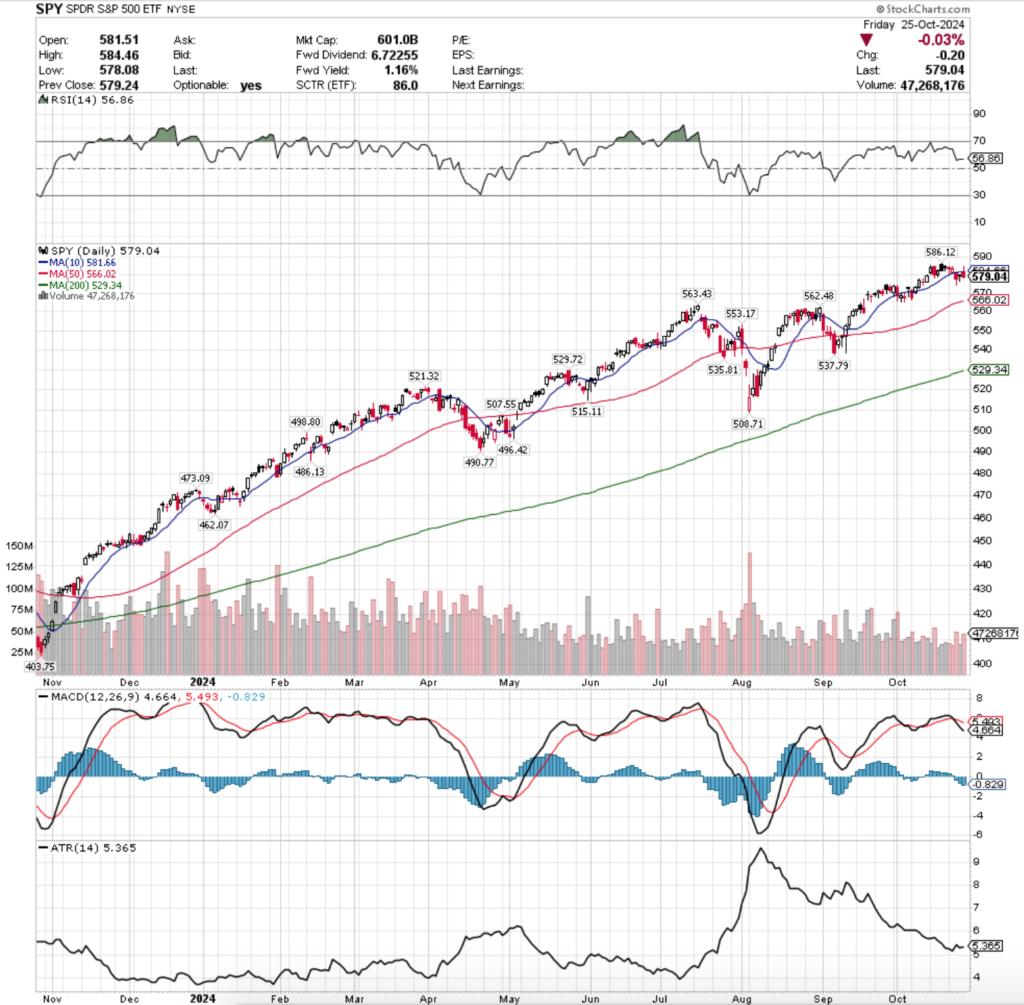
Their RSI has flattened out just above the neutral 50 level & sits at 56.86, while their MACD crossed over bearishly on Wednesday.
Volumes were -35.77% below the previous year’s average (40,436,000 vs. 62,957,183), as investors continue to sit on edge waiting to see what mega cap tech earnings & PCE/inflation data tell us this week.
Monday the week began on a sour note, as the session’s candle resulted in a dragonfly doji that tested the support of the 10 day moving average.
While support held up, volumes were even lower than last week’s, indicating that there was still a good deal of fear & uncertainty about SPY’s outlook for the week.
This continued into Tuesday, where on the lowest volume of the week SPY opened in line with the prior day’s close, only to continue lower throughout the day & settle rested atop the support of the 10 DMA.
Wednesday the 10 DMA’s support broke down, as the session opened below it, tested briefly above it only to fall & close lower, with a large lower shadow signaling that there was still more downside appetite among market participants, but that the bulls had temporarily forced a stronger close.
Thursday saw a glimmer of optimism, as another dragonfly doji candle occurred while SPY tried to claw back some of Wednesday’s losses, but note that the volume was extremely weak on Thursday, which does not indicate that there was much bullish sentiment behind they day’s move.
Thursday’s candle could be considered a bullish harami, but based on the low volume sentiment behind the session & the lower close than open it should be viewed bearishly.
One area of hope from Thursday’s session was that the low of the day was not as low as Wednesday’s, but this is nothing to hitch your wagon to just yet.
Friday managed to open higher, but still below the 10 DMA’s resistance, break temporarily above the resistance level, before ultimately closing near the low of they day -0.03% on the second highest volume of the week.
This “risk-off” into the weekend did not set the stage for an enthusiastic new week & indicates that there is still a bit of skepticism among market participants about the current strength of the S&P 500.
As we look to the coming week the 10 day moving average’s relationship to SPY’s share price remains one of the most important areas to keep an eye on this week.
Support gave out & resistance held strong in the latter half of the week, which will remain important in determining the direction SPY goes in heading into the latter portion of the week.
If the price stays below the 10 DMA’s resistance for too long market participants will become exhausted & impatient likely leading to some selling pressure forcing SPY’s price lower.
This is especially true if there is not a meaningful increase in volume, as the current tumbleweed low levels are unsustainable in the long run if SPY’s valuation is to remain justified near all-time highs.
The direction that volume increases in & the magnitude of the increase will also remain important to watch, as it will shed light into which way market participants are likely to continue moving in once a trend has been established.
Watching how investors are participating will help you to anticipate which direction things will move in in the short-to-medium term.
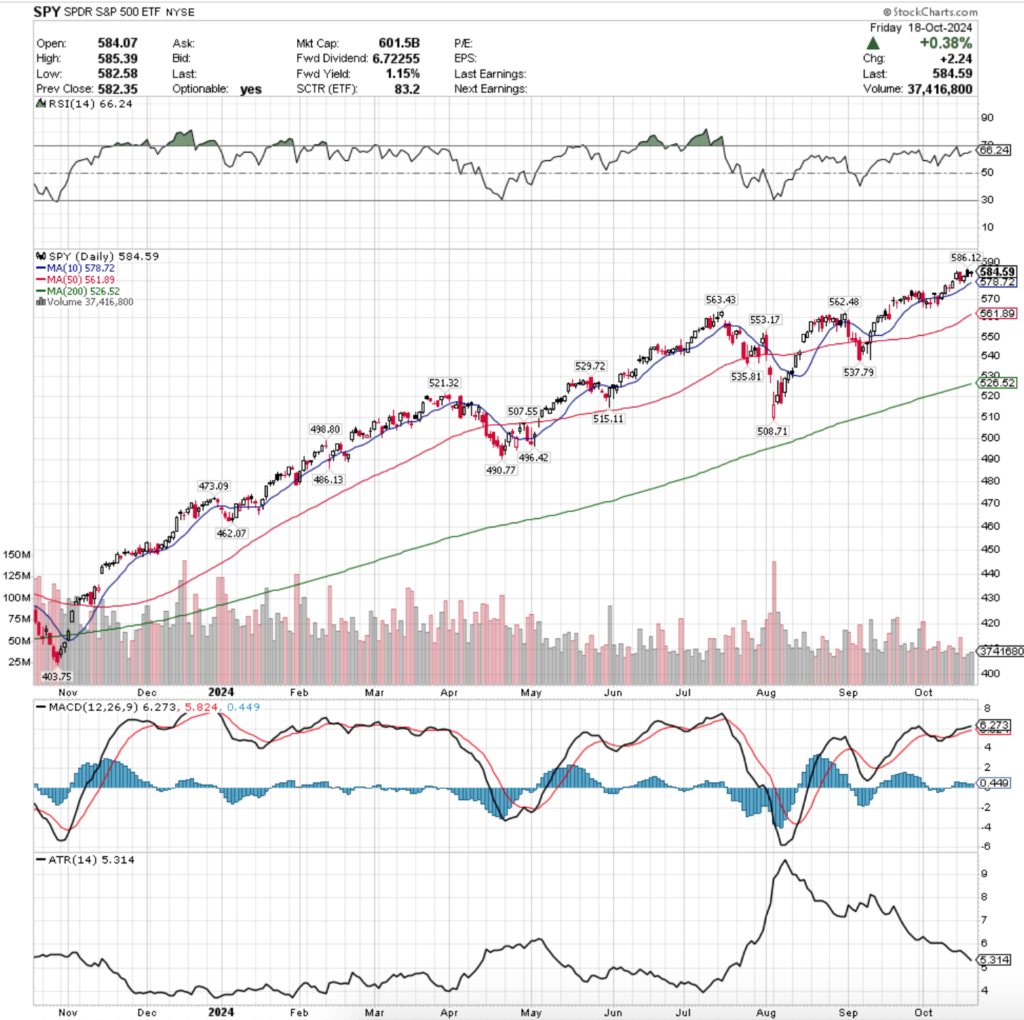
Something else of note for this week is that now that SPY’s price is below the 10 DMA, the first support level (S1) is their 50 DMA, which is continuing to rise.
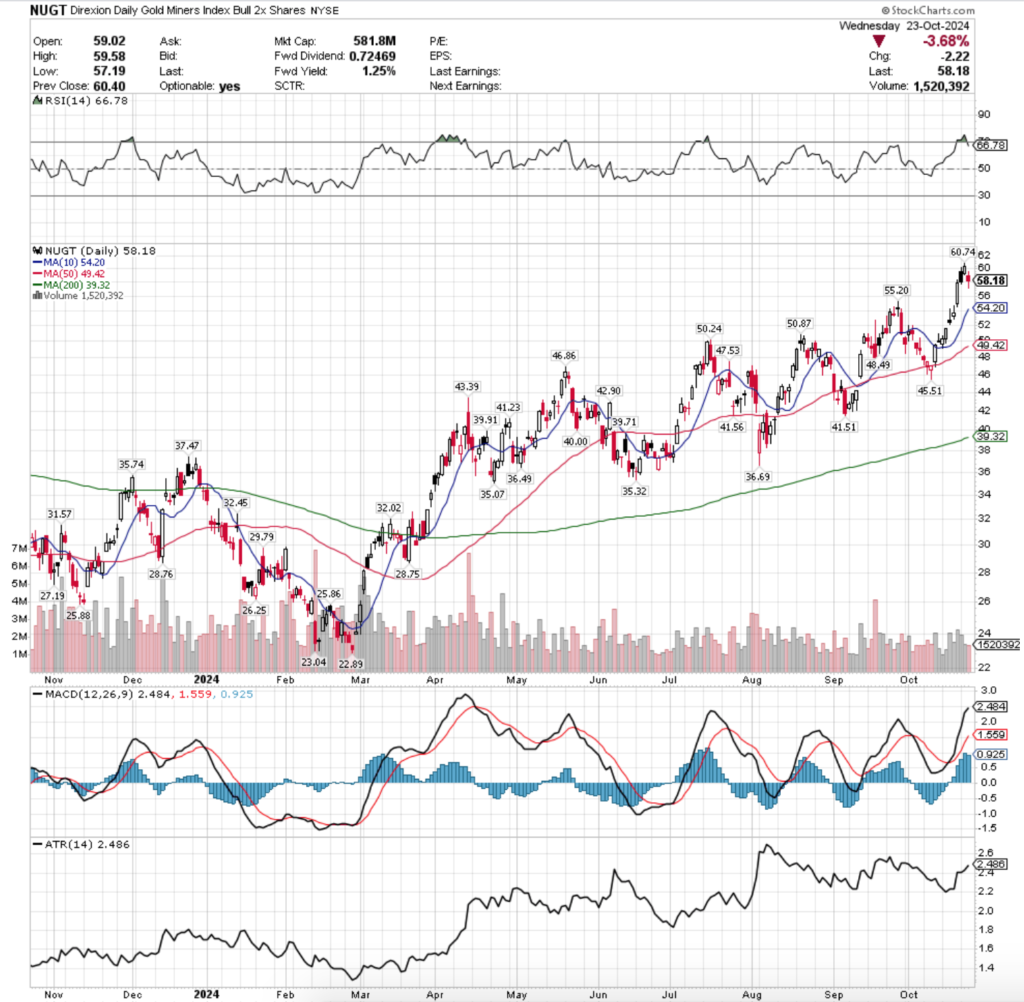
Looking at their past year’s chart (above) you can see that more often than not in the past year when the price has gone between these two moving averages there has often been declines, many of which have been able to break down & test the 50 DMA’s support (and two in particular that broke down through it entirely).
This leads to something else that has begun emerging from SPY’s chart over the past week, the appearance of a potential bearish head & shoulders set up forming.
Look back to 9/19/2024’s gap up session & note that the left shoulder forming, with the recent all-time high as the head & the right shoulder yet to form.
Should the moving averages observation above hold true that will begin the formation of the right hand shoulder over a 5-6 week period (assuming a more rapid decline doesn’t take place instead).
The low volume of the past couple of weeks has made this become even more of a possibility as there is no fuel in SPYs tank & looking at their MACD & RSIs it begins to look even more strongly a possibility.
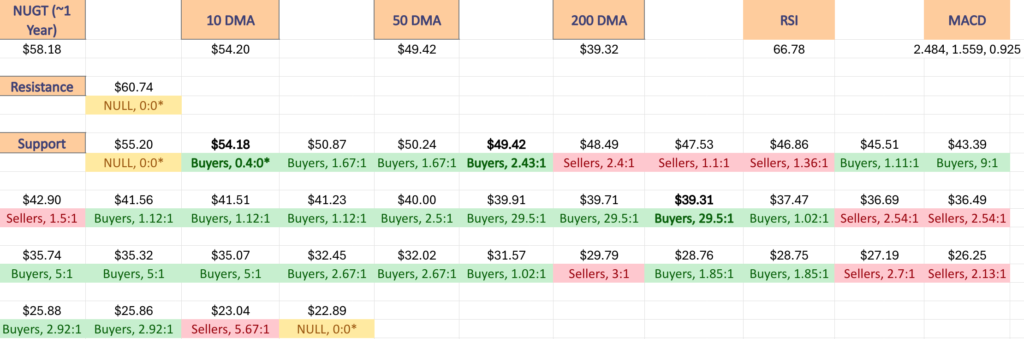
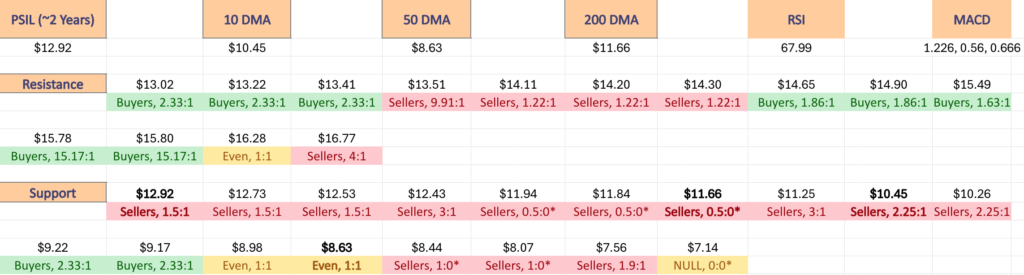
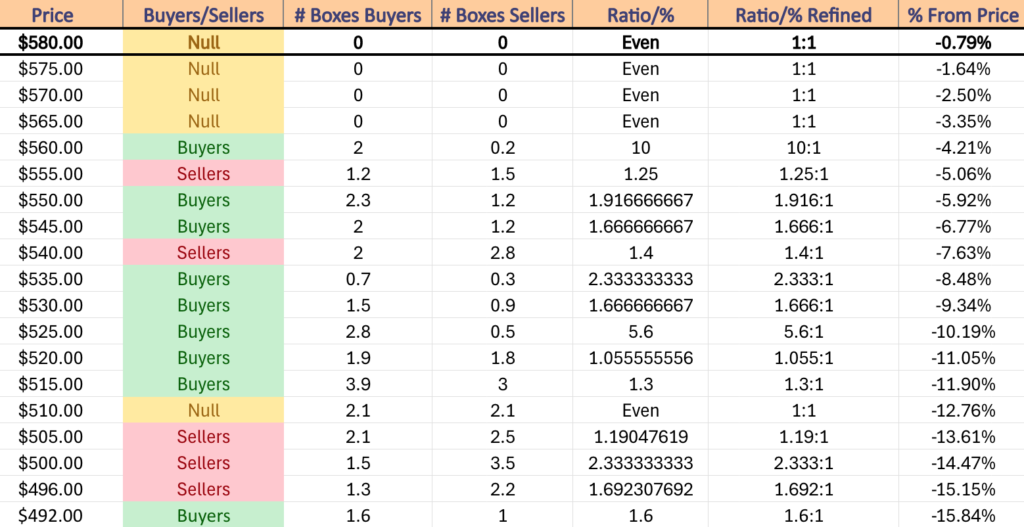
SPY has support at the $566.02 (50 Day Moving Average, Volume Sentiment: NULL, 0:0*), $563.43 (Volume Sentiment: Buyers, 10:1), $562.48 (Volume Sentiment: Buyers, 10:1) & $553.17/share (Volume Sentiment: Buyers, 1.92:1) price levels, with resistance at the $581.66 (10 Day Moving Average, Volume Sentiment: NULL, 0:0*) & $586.12/share (All-Time High, Volume Sentiment: NULL, 0:0*) price levels.
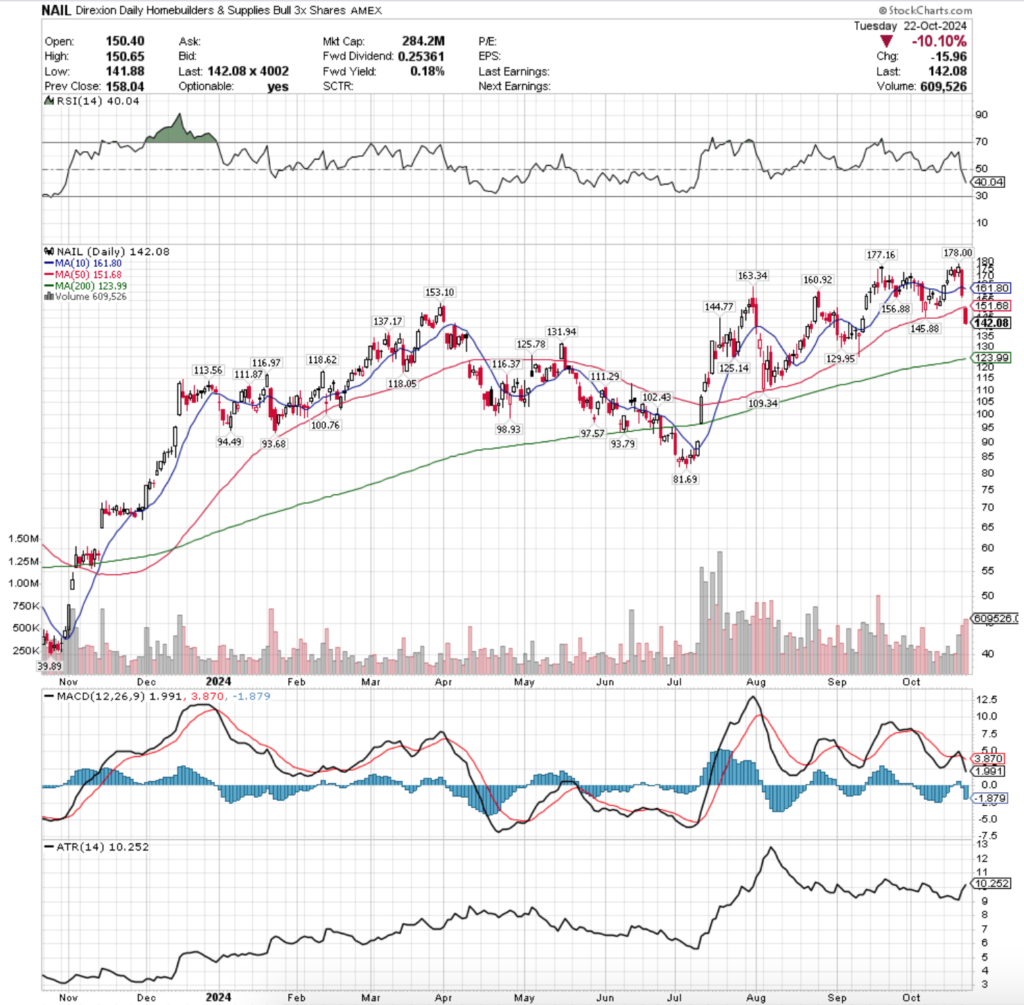
QQQ, the Invesco QQQ Trust ETF advanced +0.17% last week, faring the best of the major four index ETFs.
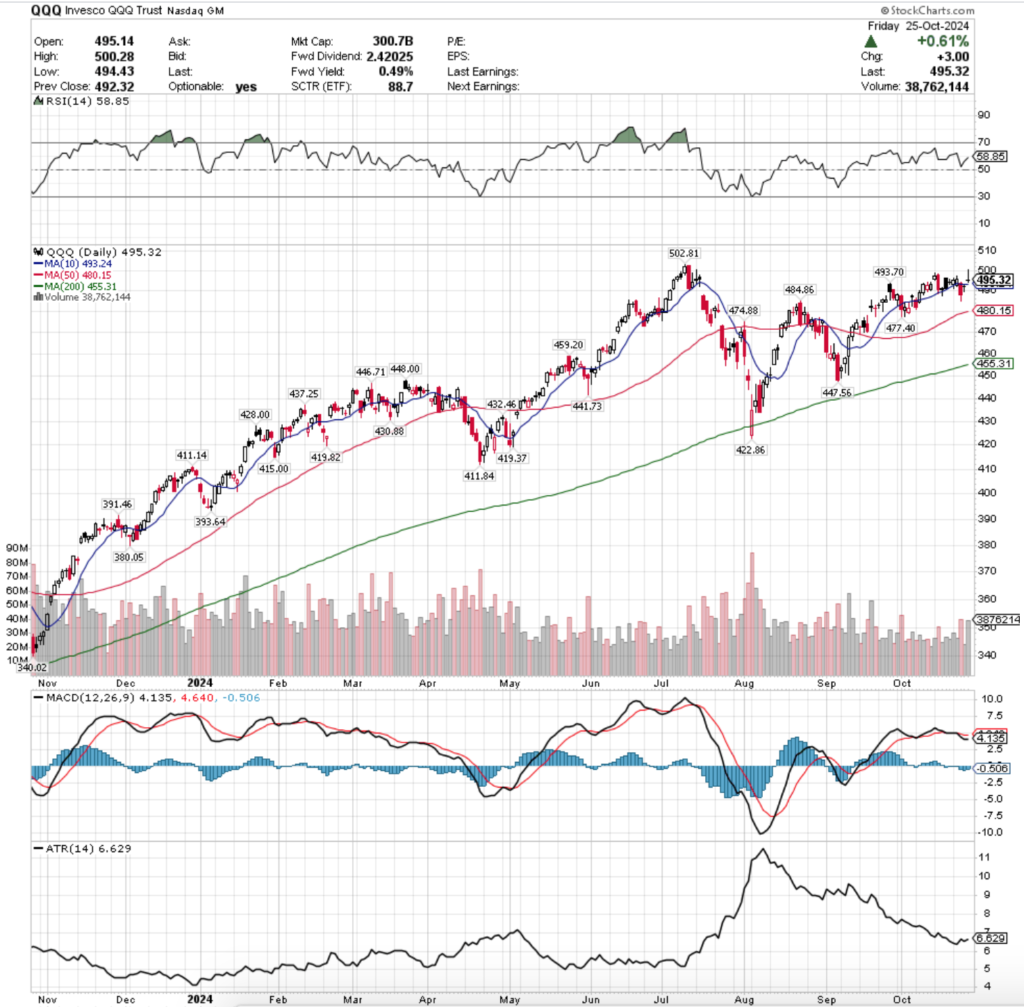
Their RSI is trending towards the overbought level of 70 & currently sits at 58.85, while their MACD crossed over bearishly last week.
Volumes were -21.75% below the previous year’s average level (31,432,000 vs. 40,167,659), which as noted in last week’s market review note is severely low in relation to the volumes that QQQ (and the other index ETFs sans-IWM) had previously enjoyed in years past.
QQQ had a different week from SPY, but still did not have a strong performance as investors have begun to sour on the two indexes in favor of IWM & DIA recently.
QQQ opened the week on a quite uncertain note, where mediocre volume resulted in a bullish engulfing candle that resulted in a spinning top.
They briefly broke down through the 10 day moving average’s support during the day, but managed to power higher to close the day higher.
The weak volume & temporary support break down are cause for concern though, which QQQ showed on Tuesday.
While at first glance Tuesday was another bullish engulfing candle & it did not close with the same “indecision” surrounding it that Monday’s spinning top indicated, it should be noted that the volume was weak & that the session opened below the resistance of the 10 DMA.
The fact that the support level was feeble enough to be broken through before the market opened is not indicative of strength & conviction behind QQQ, which was proven with Wednesday’s declining session.
While prices were able to briefly break above the 10 DMA’s resistance, they spent most of the session below it & Wednesday’s volume was the strongest of the week, which is telling about the lack of investor confidence in QQQ as there has not been any major run up to trim profits from & volume hadn’t been that high since 10/1/2024 (also declining volume).
The session’s lower shadow also signals that there was more downside appetite.
Thursday showed the weakest volume of the week for QQQ on a session that closed in a dragonfly doji, indicating indecision, particularly as the 10 DMA was not crossed.
It created a harami cross pattern with Wednesday’s session, which led to Friday’s gap up open that skipped right over the 10 DMA’s resistance.
Friday’s move came on the second highest volume of the week, indicating that there was some support behind it from market participants, however it closed as a gravestone doji, indicating that the bears were still out in full force & likely signaling that there was some intra-day profit taking after the gap up, based on the height of the upper shadow.
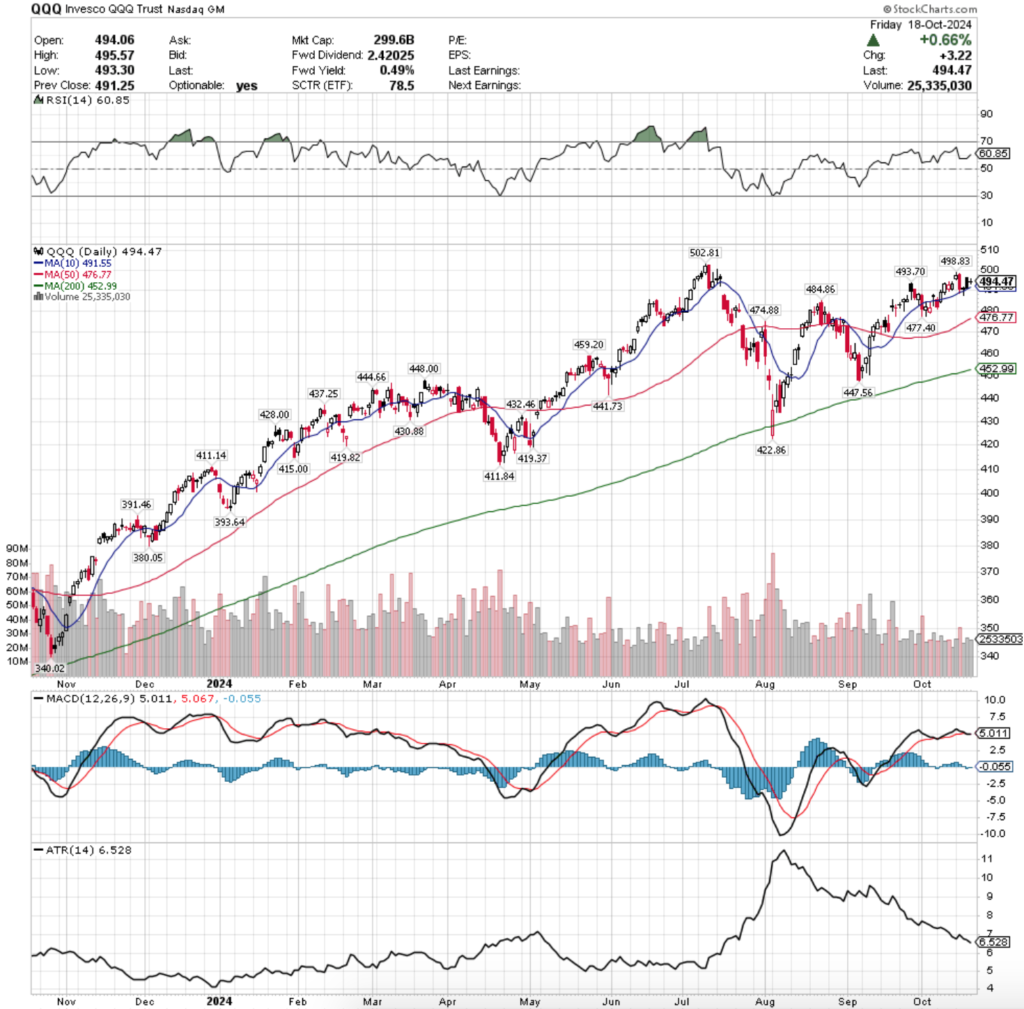
QQQ’s week ahead will also be heavily dependent on how the price is in relation to their 10 DMA, which closed Friday as their second level of support (S2).
In the event that prices make a break lower & get pinned between the 10 & 50 DMAs there is additional local support to help prop prices up, but the curve of the 10 DMA should be cause for concern.
Once the 10 DMA curls over as much as it has recently it has led to lower prices in the coming sessions that come in the form of steeper declines vs. consolidation.
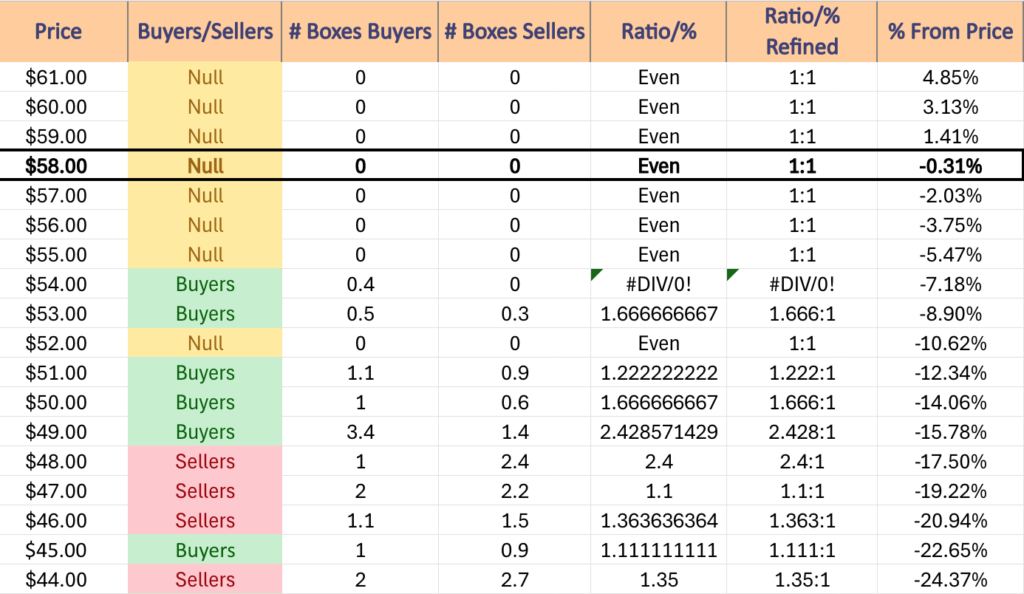
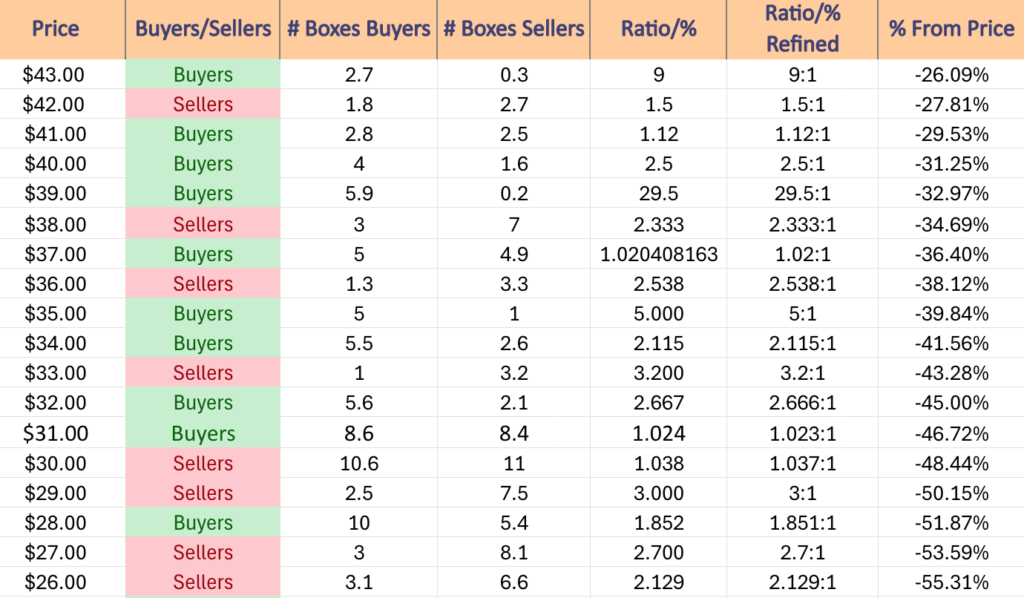
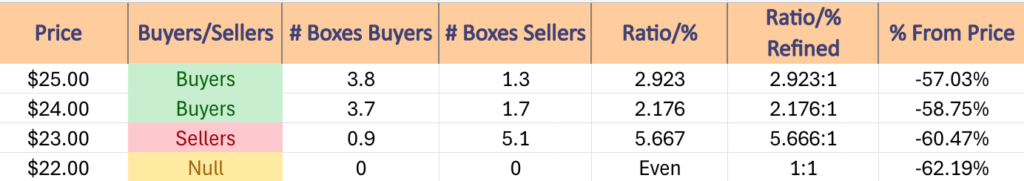
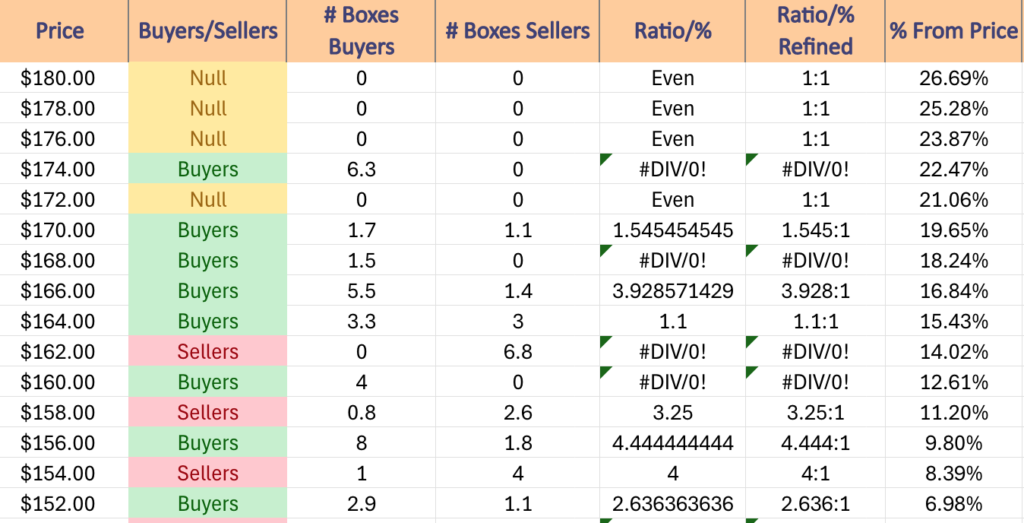
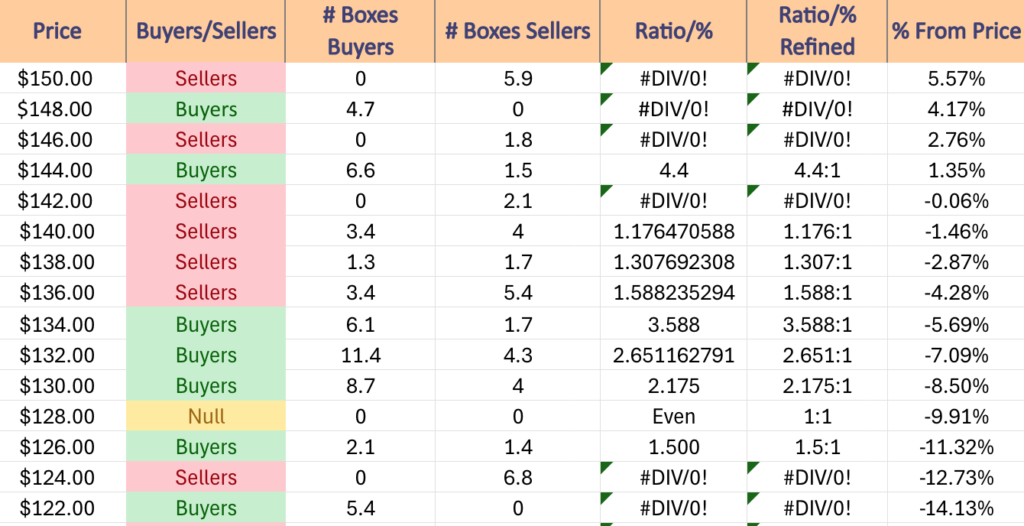
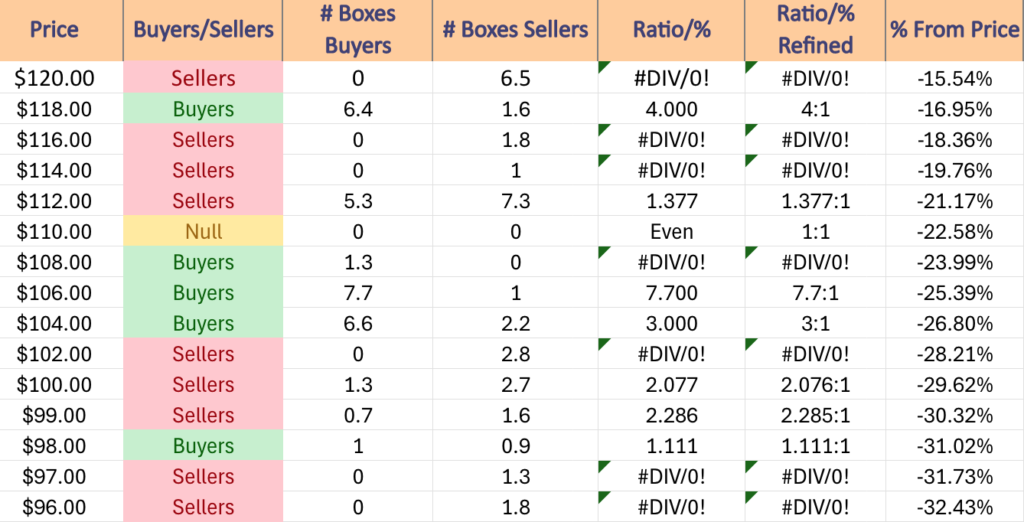
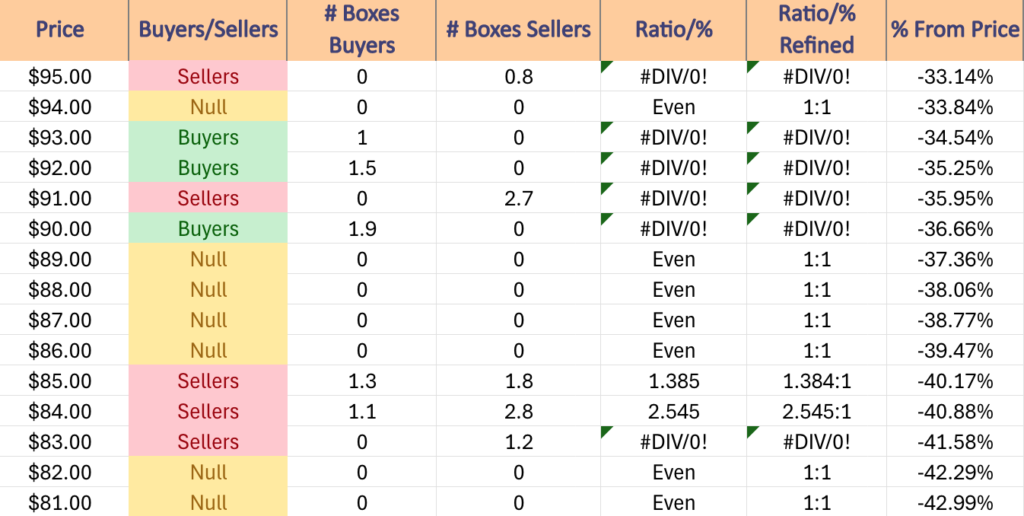
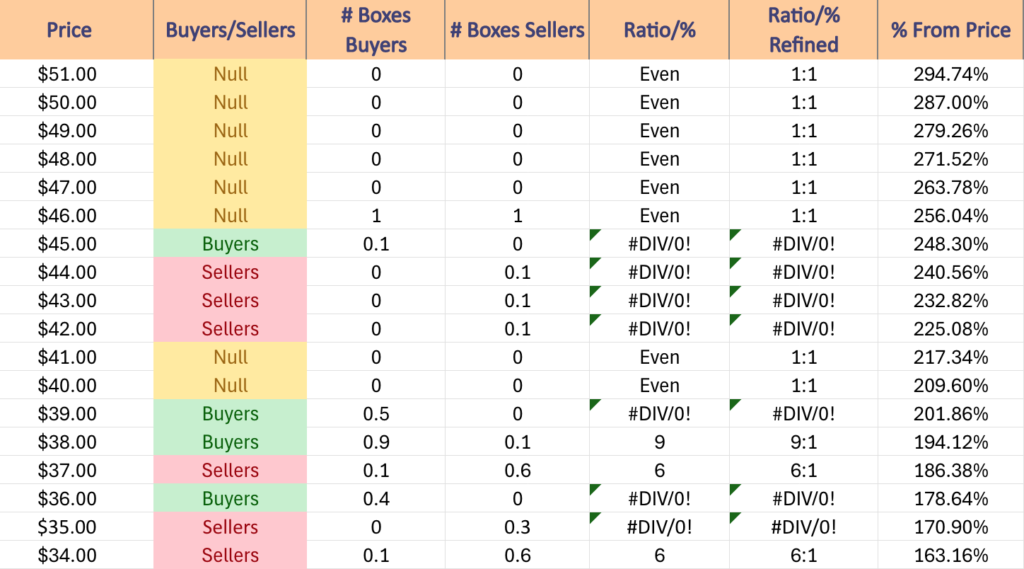
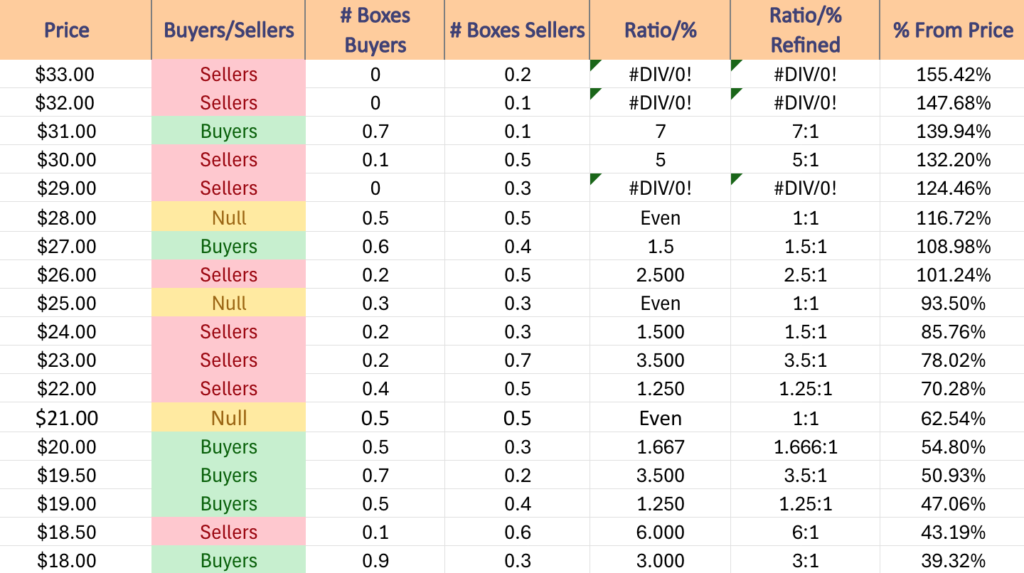
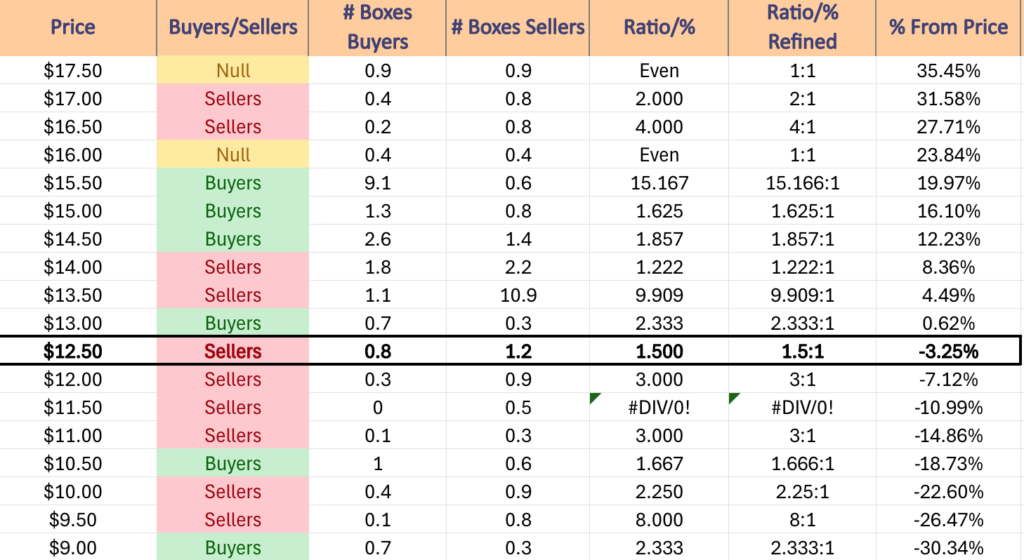
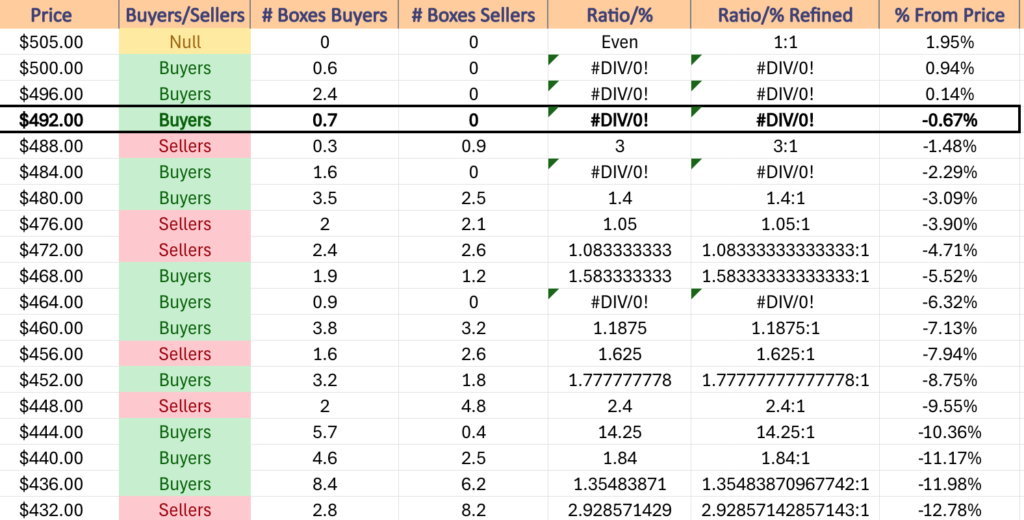
When referencing the volume sentiment by price level table below you’ll notice that this may well lead to a 5%+ decline based on the Buyer:Seller sentiment at these levels over the past ~2 years.
While this week’s earnings calls may be enough of a catalyst to forge higher for QQQ, they too are showing signs of a bearish head & shoulders pattern emerging over a similar time period as SPY’s.
Friday’s high would become the head (assuming nothing in the days to come is higher than it), giving it 4-6 weeks until the right shoulder is formed (in the event that it does not decline more rapidly).
In the event of an earnings catalyst this week, it will be imperative to see how the $502.81 resistance level holds up, as in the event that it is broken through the landscape for QQQ will change (pending on how their oscillators react to the jump).
While QQQ has shown higher peaks & higher troughs since the declines of July, the lackluster participation rate being signaled by their current volume levels raises cause for concern still moving into the week ahead & like SPY, watching their the direction & fluctuations that their volume goes in will lend tells into where they head next.
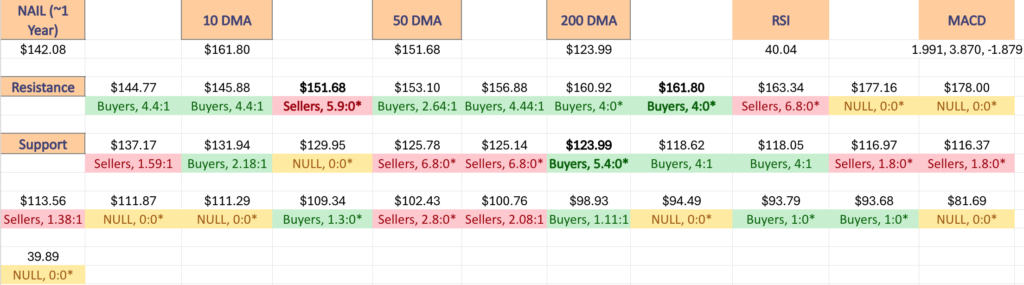
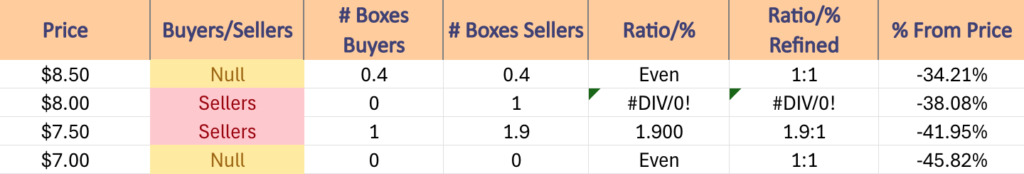
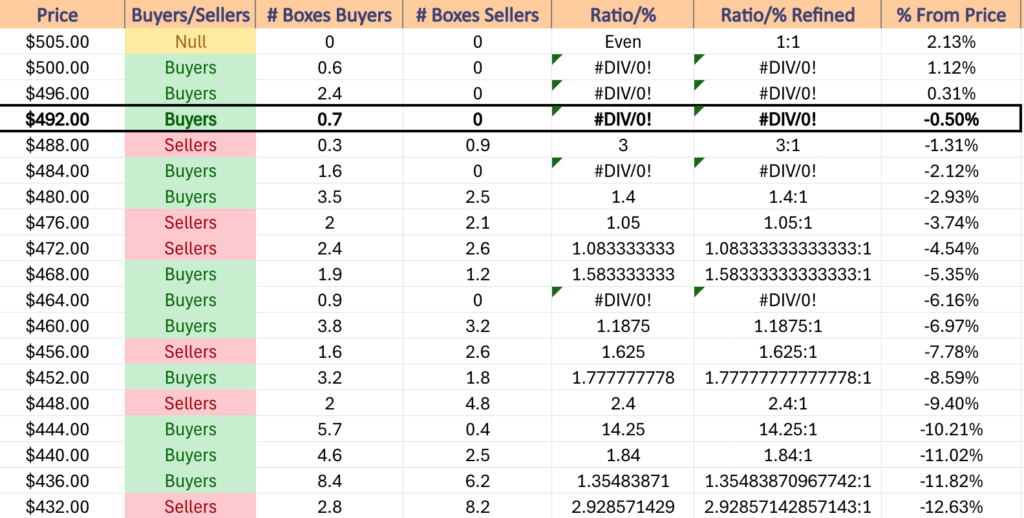
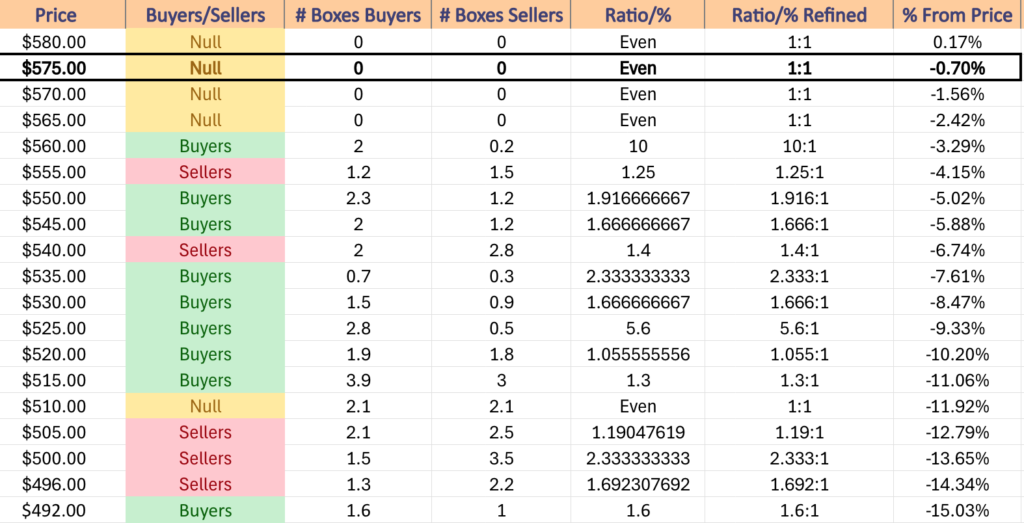
QQQ has support at the $493.70 (Volume Sentiment: Buyers, 0.7:0*), $493.24 (Volume Sentiment: Buyers, 0.7:0*), $484.86 (Volume Sentiment: Buyers, 1.6:0*) & $480.15/share (50 Day Moving Average, Volume Sentiment: Buyers, 1.4:1) price levels, with resistance at $493.70/share (All-Time High, Volume Sentiment: Buyers, 0.7:0*) price levels.
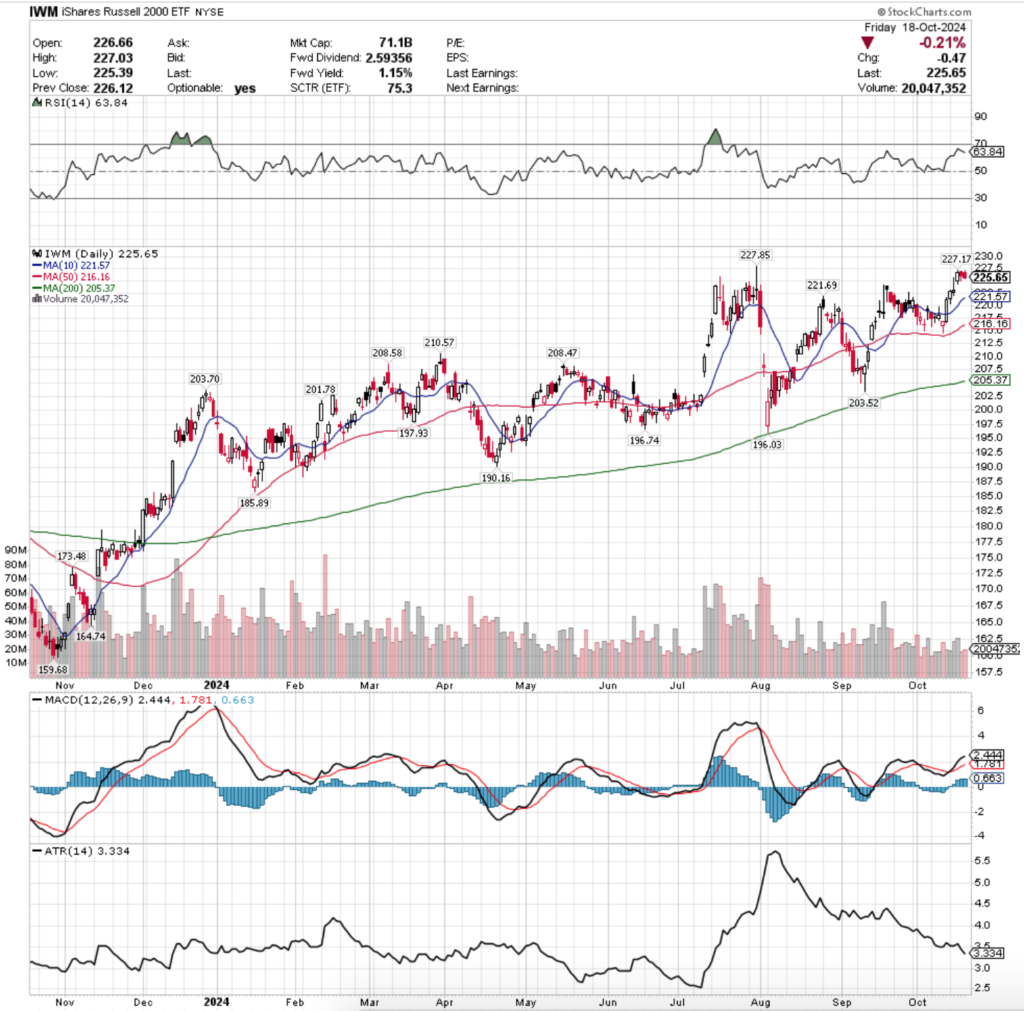
IWM, the iShares Russell 2000 ETF declined -3% last week, as investors shunned the small cap heavy index.
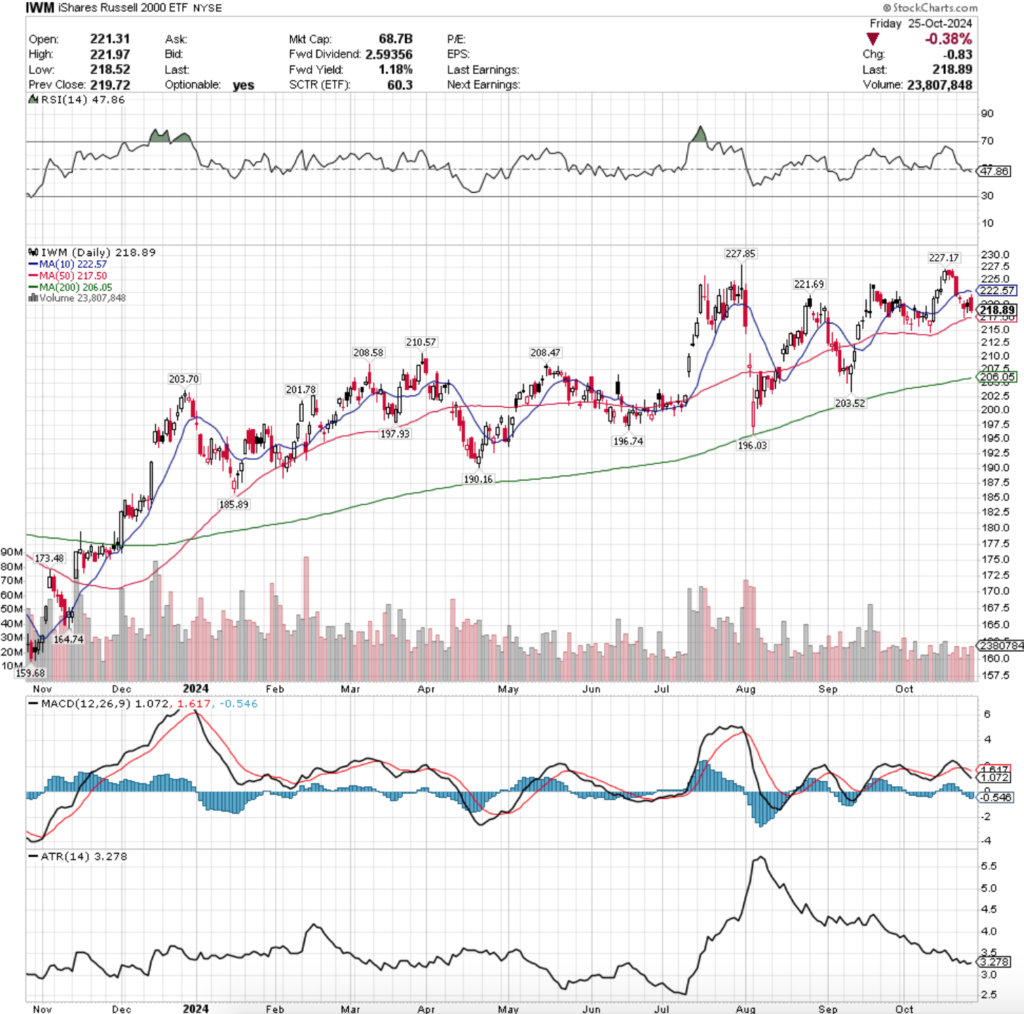
Their RSI recently crossed below the neutral mark of 50 & sits currently at 47.86, while their MACD has been bearish since Wednesday.
Volumes were -38.02% below the prior years average (21,100,000 vs. 34,043,929), which is peculiar, given that the Russell has fared the best of the major four indexes in terms of volume since 4/19/2024 & is something to consider in any analysis of the small cap index.
After rounding the prior week out with a couple of bad sessions the pain continued into the new week for IWM, as the session opened lower & proceeded to decline -1.74% & meeting the support of the 10 day moving average (briefly breaking down below it) on some of the highest volume of the week.
While some may attribute this to profit taking, it seems a bit lopsided compared to the volumes of the week & a half prior’s run up & should be viewed with a skeptical eye.
Tuesday the ship continued to sink, as the session opened on a gap down beneath the 10 day moving average’s support & closed as a hanging man candle (bearish).
Volume was noticeably weaker than the previous day’s, however the emphasis here should be placed on the fact that the session opened up with all faith in the 10 DMAs support level obliterated.
Wednesday followed suit, opening on a gap down again & despite showing some bulls had entered the chat (upper shadow) the bears were still in control, forcing the session to almost test the support of the 50 day moving average beneath it.
Bulls were able to rush in & force the close to be in the top ~33% of the day’s range though, and there was a lot of shares trading hands compared to most of the rest of October based on their “high” volume.
The dim outlook continued into Thursday, when the session opened higher, tested higher & then proceeded to retrace over 50% of the prior day’s range & ultimately closed below its opening price, indicating weakness & poor spirits among market participants given the low volume of the day.
Friday the bandaid was ton off, as a high volume for the week session resulted in a bearish engulfing candle that sat almost perfectly between the resistance of the 10 DMA & support of the 50 DMA.
Every part of Friday’s candle eclipsed Thursday’s, leading to the oscillator readings mentioned above & the curling over of their 10 day moving average’s resistance which looks set to apply downward pressure on IWM’s price.
While we’ve noted in past weeks that IWM’s volume has not taken as big of a hit as the other major three index ETFs, volume & the direction it occurs in will still be very telling about the next direction IWM takes in the coming weeks & should be paid close attention to.
Much like SPY & QQQ, the relationship between price & the 10 & 50 day moving averages will be important to note as well, especially as they’re both also signaling a potential near-term head & shoulders pattern whose left shoulder formed in mid-September.
Another thing of note regarding IWM’s 50 DMA’s support is that should it break down, there are no other touch-points until $210.57/share & the 50 DMA is in s Seller dominated price block (3.3:1).
While the $208 support zone has been dominated by the Buyers 2:1 in recent history & the $210.57/share point is contained in this price block, it may not be the sturdiest of support & should be viewed with caution.
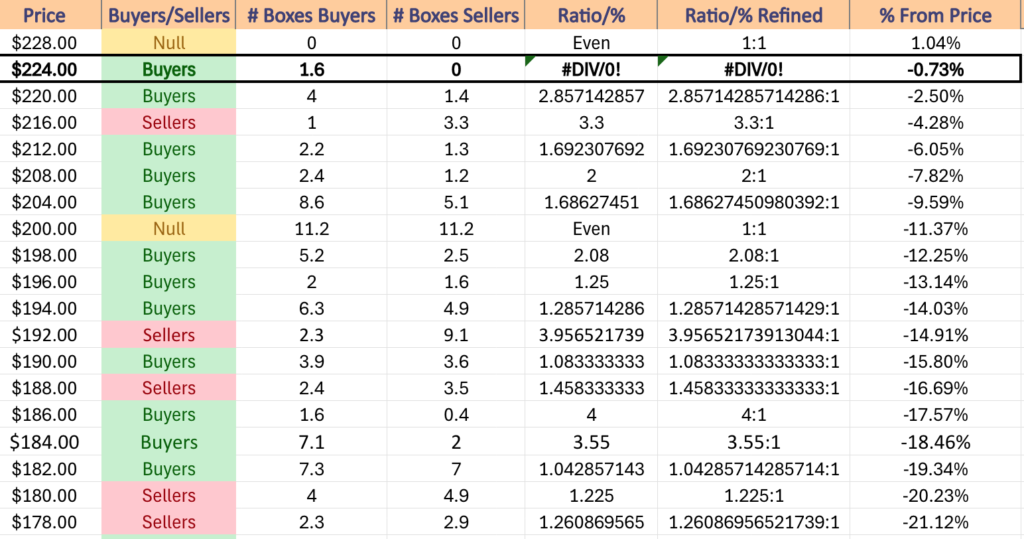
IWM has support at the $217.50 (50 Day Moving Average, Volume Sentiment: Sellers, 3.3:1), $210.57 (Volume Sentiment: Buyers, 2:1), $208.58 (Volume Sentiment: Buyers, 2:1) & $208.47/share (Volume Sentiment: Buyers, 2:1) price levels, with resistance at the $221.69 (Volume Sentiment: Buyers, 2.86:1), $222.57 (10 Day Moving Average, Volume Sentiment: Buyers, 2.86:1), $222.17 (Volume Sentiment: Buyers, 2.86:1) & $227.85/share (Volume Sentiment: Buyers, 1.6:0*) price levels.

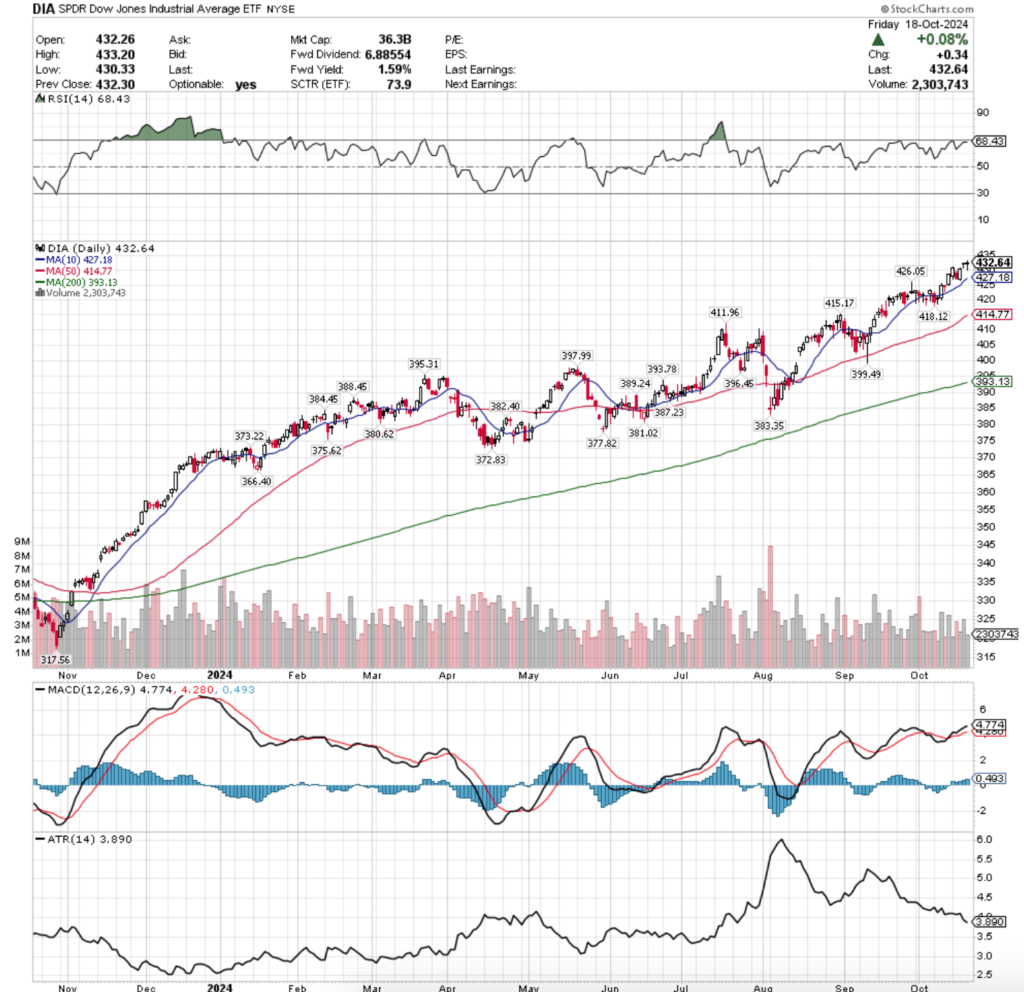
DIA, the SPDR Dow Jones Industrial Average ETF fell -2.66% last week, as blue chip names were not in favor vs. the tech heavy NASDAQ.
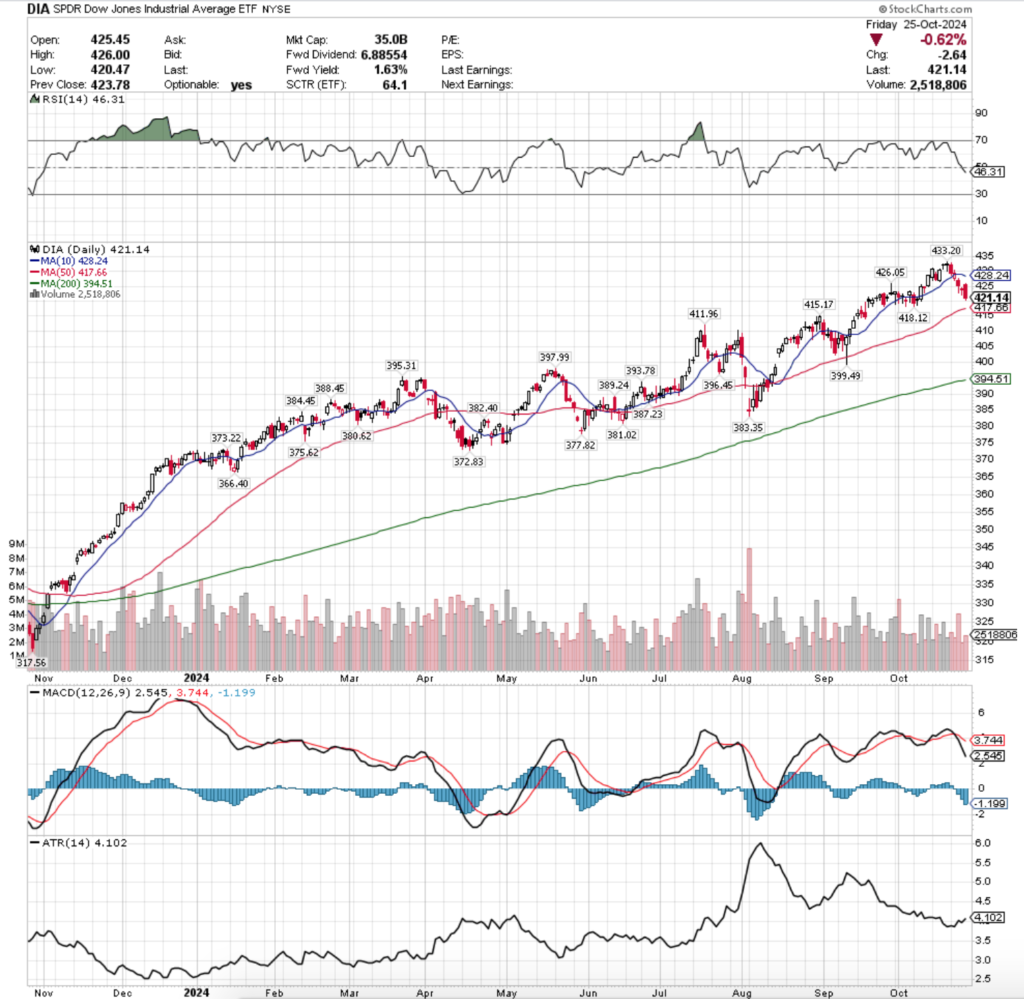
Their RSI also just crossed through the neutral 50 mark & sits currently at 46.31, while their MACD has also been bearish since Wednesday.
Volumes were -22.17% below the previous year’s average (2,696,000 vs. 3,464,048), as investors are even skittish on buying into the blue chip index so close to all-time highs.
The week began & ended on a weak note for DIA following a new all-time high hit on Friday & a pair or dragonfly doji candles closing out the week before.
Monday’s bearish engulfing candle set the stage for a week of pain for DIA, as it started the week off with a test of the support of the 10 day moving average.
While it didn’t break down the support level on Monday, Tuesday gapped lower on the open before turning upwards & closing near in-line with the 10 DMA’s resistance, after briefly breaking through it (upper shadow).
Wednesday the pain got worse, when the week’s highest volume session began with a gap down that ultimately tested -0.96% lower than its opening price during the session, despite bulls managing to step in & for the close to be about midway between the day’s range.
Thursday the sad song continued for DIA, as it opened on a gap lower & closed as a hanging man candle (bearish).
Friday the trend remained alive & well, as the session declined -0.62% on a bearish engulfing candle, setting this week up for more bearish performance from the looks of things.
DIA also has the same head & shoulders pattern appearing from mid-September as SPY, QQQ & IWM have & their oscillators & moving averages are also beginning to show this forming.
Keep an eye on their volume in the coming weeks, particularly which direction it appears to be moving in as that will lead prices.
Like the three aforementioned ETFs, the coming week will also be marked by where DIA’s price winds up in relation to their 10 & 50 DMAs, which as you can see looking at their chart will likely be what causes the H&S pattern to form based on the current layout.
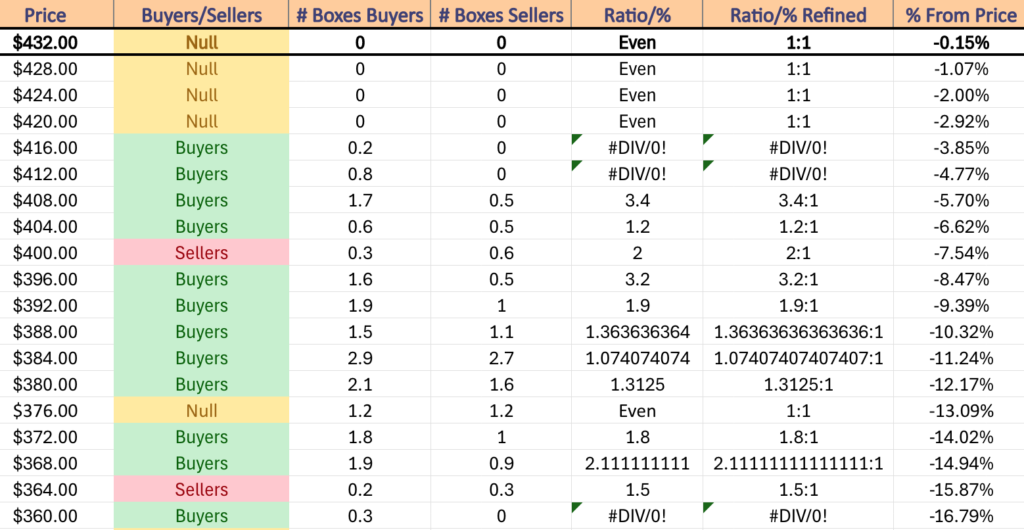
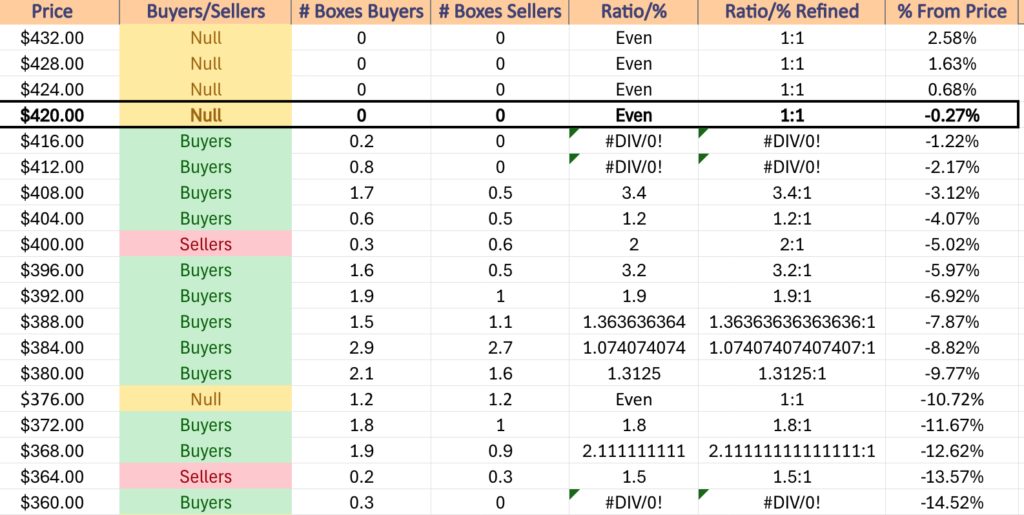
DIA has support at the $418.12 (Volume Sentiment: Buyers, 0.2:0*), $417.66 (Volume Sentiment: Buyers, 0.2:0*), $415.17 (Volume Sentiment: Buyers, 0.8:0*) & $411.96/share (Volume Sentiment: Buyers, 3.4:1) price levels, with resistance at the $426.05 (Volume Sentiment: NULL, 0:0*), $428.24 (10 Day Moving Average, Volume Sentiment: NULL, 0:0*) & $433.20/share (All-Time High, Volume Sentiment: NULL, 0:0*) price levels.
The Week Ahead
Monday there are no major U.S. Economic Data Reports or Fed Speakers.
Acadia Realty Trust, Bank of Hawaii, CenterPoint Energy, Hope Bancorp, ON Semiconductor, PROCEPT BioRobotics & SJW all report earnings before Monday’s opening bell, followed by Agilysys, Amkor, Atlas Energy Solutions, Boot Barn Holdings, Brixmor Property, Brown & Brown, Cadence Design, Calix Networks, Camping World, Capital Southwest, CCC Intelligent Solutions, COPT Defense Properties, Crane, CVR Energy, Douglas Dynamics, Element Solutions, Encompass Health, F5 Networks, Flowserve, Ford Motor, Harmonic, Inari, Kforce, Kilroy Realty, Leggett & Platt, LTC Properties, NorthWestern, PotlatchDeltic, Rambus, Regency Centers, Safehold, SBA Communications, Skyline Champion, TransMedics Group, Trex, UFP Industries, Ultra Clean Holdings, V.F. Corp, Waste Management & Welltower after the session’s close.
S&P Case-Shiller Home Price Index (20 Cities) data comes out at 9 am on Tuesday, followed by Consumer Confidence & Job Openings Data at 10 am.
Tuesday kicks off with earnings from American Tower, Armstrong World Industries, Asbury Automotive, ATI Inc., CBIZ, CECO Environmental, Check Point Software, Comcast, Commvault Systems, Corning, CTS Corp, D.R. Horton, DT Midstream, Eagle Materials, Ecolab, Enterprise Products, ESAB Corp., Franklin Electric, Frontier Group Holdings, Graphic Packaging, H&E Equipment, Harmony Biosciences, Hayward Holdings, HNI, Hubbell, Incyte, IPG Photonics, ITT, Janus International Group, JetBlue Airways, Kiniksa Pharmaceuticals, Leidos, Masco, McDonald’s, MSCI, Northwest Bancshares, PayPal Holdings, Pfizer, Phillips 66, PJT Partners, Royal Caribbean, Scorpio Tankers, Shutterstock, SoFi Technologies, Stanley Black & Decker, Sysco, Tenet Healthcare, Xerox & Zebra Technologies, with 10x Genomics, Adtalem Global Education, Advanced Micro Devices, Alignment Healthcare, Allison Transmission, Alphabet, American Homes 4 Rent, Artisan Partners Asset Management, BioMarin Pharmaceutical, BXP, Caesars Entertainment, Cheesecake Factory, Chemed, Chipotle Mexican Grill, Chubb, DaVita, Edison International, Electronic Arts, Enovix, EQT Corp., Essex Property, Exelixis, ExlService, Expand Energy, Extra Space Storage, First Commonwealth, First Solar, FirstEnergy, FMC Corp, Huron Consulting, IDEX Corp, Ingevity, Landstar System, Littelfuse, Meritage Homes, Mirion Technologies, Modine Manufacturing, Mondelez International, NerdWallet, O-I Glass, ONEOK, Park Hotels & Resorts, PROS Holdings, Provident Financial Services, Qorvo, Reddit, Republic Services, SAGE Therapeutics, Skyward Specialty Insurance Group, Snap, STAG Industrial, Stryker, Udemy, UMB Financial Corp, Unisys, Unum Group, Varonis Systems, Visa, W.P. Carey, Werner Enterprises & Zurn Elkay Water Solutions scheduled to report after the closing bell.
Wednesday kicks off with ADP Employment data at 8:15 am, with GDP, Advanced U.S. Trade Balance in Goods, Advanced Retail Inventories & Advanced Wholesale Inventories data at 8:30 am.
AbbVie, AerCap, AFC Gamma, Allete, Ares Capital, Arvinas, Automatic Data Processing, Avanos Medical, Avnet, Axalta Coating Systems, Bausch + Lomb, Bausch Health, Biogen, Blackbaud, Brinker International, Bunge, Caterpillar, CDW, Chefs’ Warehouse, Clean Harbors, Clearway Energy, Columbus McKinnon, Curbline Properties, Dana, Eli Lilly, Exelon, Extreme Networks, Fiverr, Flex, Fortive, Garmin, Gates Industrial, GE HealthCare, Gentherm, Gibraltar Industries, GlaxoSmithKline, Global Payments, Group 1 Auto, Healthcare Realty, Hess, Hess Midstream Partners, Humana, Illinois Tool Works, IMAX, InMode, Intra-Cellular Therapies, JinkoSolar, Kirby, Kraft Heinz, Leonardo DRS, LivaNova, Martin Marietta, Materion, Monro Muffler, Navient, Neurocrine Biosciences, NiSource, NovoCure, Oil States, Omnicell, OneMain Holdings, OneSpaWorld, Option Care Health, Oshkosh, Otis Worldwide, Parsons, ProPetro, Reynolds Consumer Products, Shake Shack, Silgan Holdings, SiteOne Landscape Supply, Stepan, Terex, The Vita Coco Company, Tradeweb Markets, Trane, TTM Technologies, United Therapeutics, Verisk Analytics, Vulcan Materials, Wingstop, XPO & Zimmer Biomet are all scheduled to report earnings before Wednesday’s opening bell, followed by Meta Platforms, Acadia Healthcare, Advanced Energy, Aflac, Albany International, Alkami Technology, Allegiant Travel, Allstate, Alphatec, Altair Engineering, American Water Works, Amgen, Antero Midstream, Antero Resources, Arch Capital, Arcosa, AXIS Capital, Axos Financial, Beacon Roofing Supply, Benchmark Electronics, Bio-Rad Labs, Booking Holdings, C.H. Robinson, Cactus, Carvana, Casella Waste, CF Industries, Clorox, Cognex, Cognizant Technology Solutions, Coinbase Global, Columbia Sportswear, Compass Diversified, Comstock, Confluent, CONMED, Corcept Therapeutics, Credit Acceptance, Curtiss-Wright, Custom Truck One Source, DoorDash, eBay, Employers Holdings, Energy Recovery, Envista, EPR Properties, Equinix, Equity Residential, Ethan Allen, Etsy, Everest Group, Federal Realty, Floor & Decor, FormFactor, Four Corners Property Trust, FTAI Aviation, Gen Digital, GoDaddy, Green Brick Partners, Hanover Insurance, Herbalife Nutrition, Hercules Capital, Houlihan Lokey, Hub Group, Independence Realty Trust, Informatica, Invitation Homes, iRhythm, KLA Corporation, Lemonade, LPL Financial, Magnolia Oil & Gas, Manitowoc, Matson, MediaAlpha, Merit Medical, MetLife, MGM Resorts, Microsoft, MicroStrategy, Mid-America Apartment Communities, Mister Car Wash, Monolithic Power, Murphy USA, MYR Group, National Storage Affiliates, NETGEAR, New Mountain Finance, Nextracker, NV5 Global, Omega Health, Paramount Group, Paycom Software, Paylocity, Penumbra, Pilgrim’s Pride, PriceSmart, Procore Technologies, Prudential, Public Storage, Remitly Global, Riot Platforms, Robinhood Markets, Roku, Root, Inc., Rush Enterprises, Rush Street Interactive, Ryan Specialty Group, Silicon Motion, Sleep Number, Sprouts Farmers Market, SPX Technologies, STAAR Surgical, Starbucks, Stem, Sturm Ruger, Summit Materials, Sunnova Energy, Teekay Tankers, Teladoc, Tenable, Trupanion, Twilio, UDR, Universal Display, Ventas, Warrior Met Coal, Watts Water Technologies & WillScot Mobile Mini after the closing bell.
Personal Income, Personal Spending, PCE Index, PCE (Year-over-Year), Core PCE Index, Core PCE (Year-over-Year) & Initial Jobless Claims data are all released Thursday morning at 8:30 am, followed by Pending Home Sales data at 10 am.
Thursday morning’s earnings calls include 1-800-FLOWERS, Agios Pharmaceuticals, Allegro Microsystems, Alnylam Pharma, Altria, Alumis, Ametek, APi Group, Aptiv, Arrow Electronics, Avient, Ball Corp, Bandwidth, BCE Inc, Belden, BorgWarner, Bristol Myers Squibb, California Water Service, Canada Goose, Canadian Natural Resources, Cheniere Energy, Cinemark, CMS Energy, ConocoPhillips, Cullen/Frost, Donnelley Financial, Driven Brands, Dun & Bradstreet, Eaton, Ecovyst, EMCOR Group, Entergy, Enviri Corporation, Estee Lauder, Federal Signal, Ferrari, First Majestic Silver, Fresh Del Monte, Generac, Genesis Energy, Gildan Activewear, Grainger, Granite Construction, Green Plains, HF Sinclair, Huntington Ingalls, Hyatt Hotels, IdaCorp, IDEXX Labs, Inhibrx Biosciences, Insperity, International Paper, Intercontinental Exchange, InterDigital, IQVIA, Itron, Janus Henderson Group, Kellanova, Kimco Realty, Kontoor Brands, Kymera Therapeutics, Lancaster Colony, Laureate Education, Lazard, LendingTree, Li Auto, Lightspeed, Lincoln Electric, Lincoln National, Linde, Madrigal Pharmaceuticals, Malibu Boats, Mastercard, Merck, MGP Ingredients, Mobileye Global, Norwegian Cruise Line, Open Text, Organon, Patrick Industries, PBF Energy, Peabody Energy, Peloton Interactive, PHINIA, Quanta Services, Radware, Regeneron Pharmaceuticals, Roblox, SharkNinja, SolarWinds, Southern, STMicroelectronics, SunCoke Energy, TC Energy, Teleflex, The Cigna Group, Trinity Industries, Uber Technologies, Uniti Group, Upbound Group, Utz Brands, Vontier, WEC Energy Group, Wendy’s, Willis Towers Watson, Xcel Energy & Xylem, with Amazon.com, Apple, ACCO Brands, Agnico-Eagle Mines, Alliant Energy, Amcor, Ardelyx, Asure Software, Atlassian, BJ Restaurants, Camden Property, CNO Financial, Cohu, Concentra Group Holdings Parent, Coterra Energy, CubeSmart, Customers Bancorp, Dorman Products, Eastman Chemical, El Pollo Loco, Fox Factory Holding, Grid Dynamics, Halozyme Therapeutics, ICF International, Ingersoll-Rand, Intel, Juniper Networks, Lemaitre Vascular, MasTec, Mercer International, Onto Innovation, Quaker Chemical, Reinsurance Group of America, Sabra Health Care REIT, Select Medical, SkyWest, SM Energy, Sonoco Products, Tennant, U.S. Steel, Verra Mobility, Viavi, VICI Properties & Vir Biotechnology reporting after the closing bell.
Friday morning brings us U.S. Employment Report, U.S. Unemployment Rate, U.S. Hourly Wages & Hourly Wages Year-over-Year data at 8:30 am, followed by S&P final U.S. Manufacturing PMI data at 9:45 am, Construction Spending & ISM Manufacturing data at 10 am & Auto Sales data.
Alpha Metallurgical Resources, ArcBest, Ares Management, BrightSpring Health Services, Cardinal Health, Cboe Global Markets, Chart Industries, Charter Communications, Chevron, Church & Dwight, DigitalBridge, Dominion Energy, Enbridge, Essent Group, Exxon Mobil, fuboTV, Imperial Oil, Interface, LyondellBasell, Magna, Moog, nVent Electric, Pediatrix Medical Group, PPL Corp, Protolabs, RBC Bearings, Simon Properties, T. Rowe Price, Telus, TXNM Energy, TXNM Energy & Wayfair are all scheduled to report earnings before Friday’s opening bell.
See you back here next week!
*** I DO NOT OWN SHARES OR OPTIONS CONTRACT POSITIONS IN SPY, QQQ, IWM OR DIA AT THE TIME OF PUBLISHING THIS ARTICLE ***