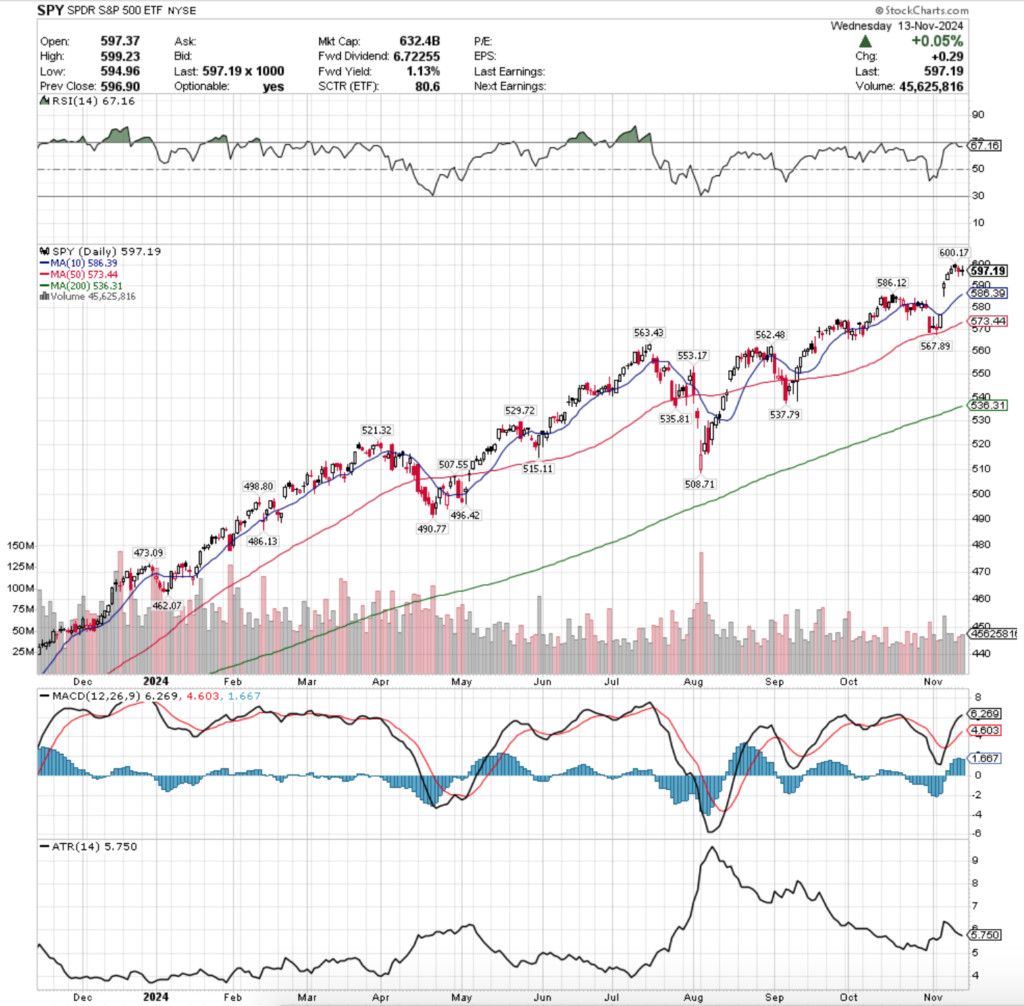
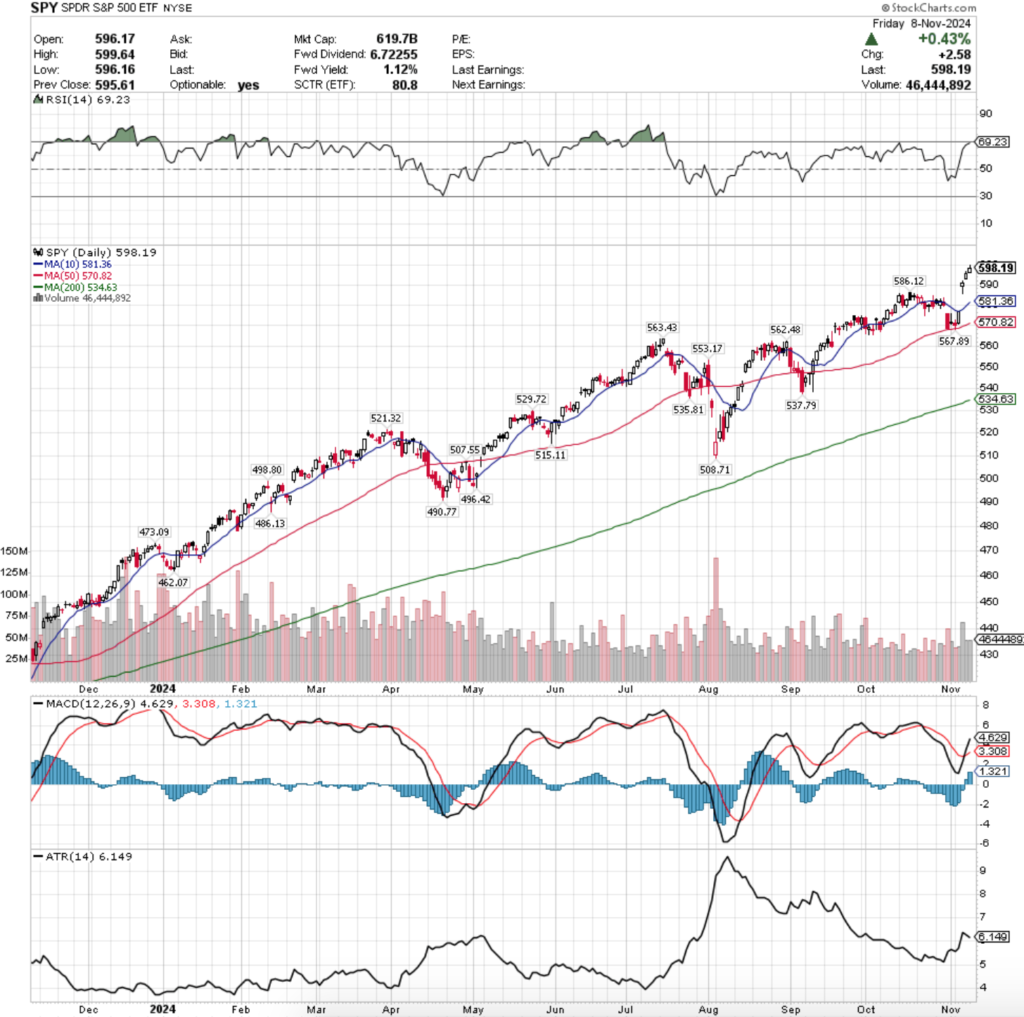
SPY, the SPDR S&P 500 ETF slid -2.08% this week, while the VIX closed at 16.14, indicating an implied one day move of +/-1.02% & an implied one month move of +/-4.67% for the S&P 500.
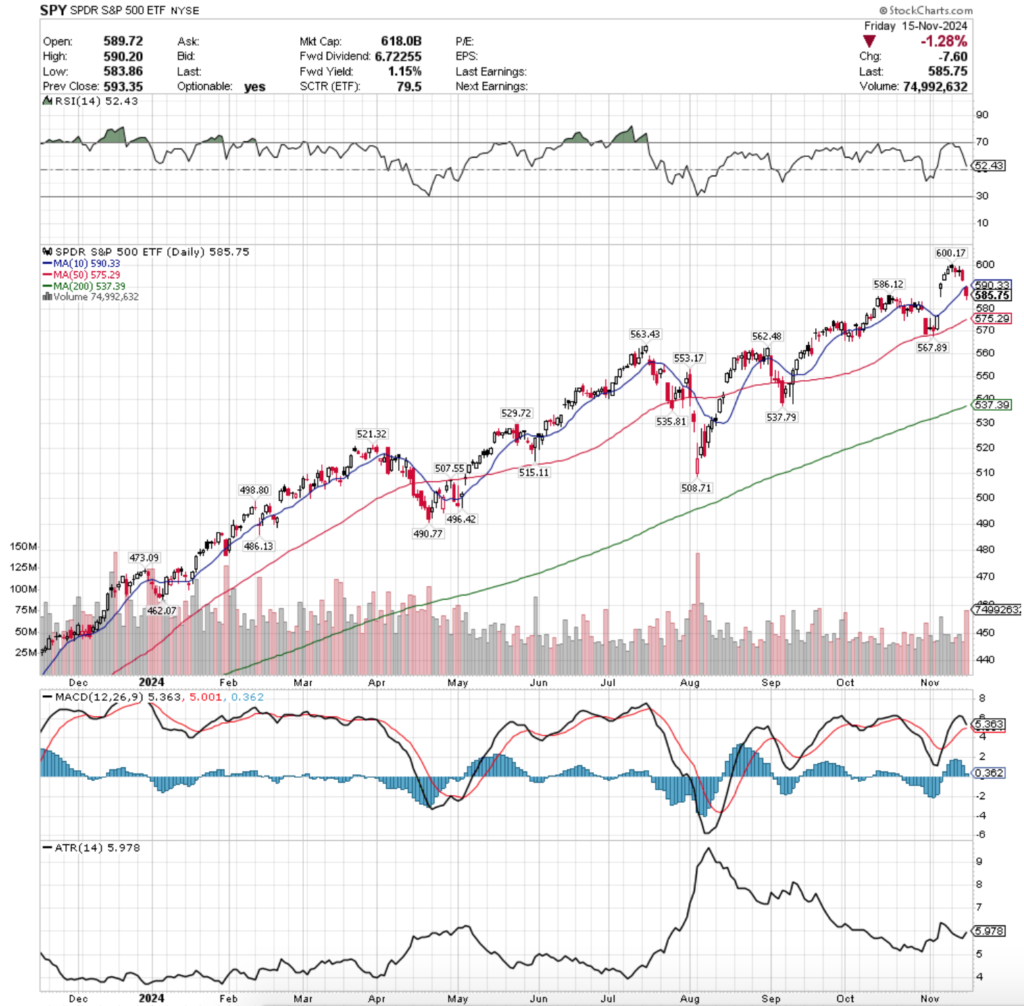
Their RSI is trending back down toward the neutral level & currently sits at 52.43, while their MACD has curled over bearishly & will likely cross the signal line within the first day or two of the week.
Volumes were -23.98% lower than the prior year’s average level (46,144,000 vs. 60,703,202), as investors are still timid near all-time highs for SPY.
For over seven months now volumes have been drastically lower than they had been in the years prior, which brings up questions regarding is it hesitancy due to the high price levels & valuations, or is there something else out there that is keep money on the sidelines.
Last Monday SPY kicked the week off on a foreboding note, as despite an advancing session that hit their current all-time high, the day resulted in a hanging man candle that closed lower than it opened (bearish).
It should also be noted that this was the lowest volume session of the day, which makes the move even more alarming.
Tuesday the bad times continued, as the day opened lower, tested slightly higher, only to decline & reinforce the negative sentiment that Monday began the week with.
Wednesday the market temporarily found equilibrium as the day resulted in a doji candle that closed slightly higher than the day prior’s on the second highest volume of the week.
Things resumed heading south on Thursday with a declining session that began filling in the window created by the previous Thursday’s gap up session.
Friday was a risk off into the weekend type of day, opening on a gap down near the 10 day moving average & blowing through the support level to close lower on the day on the highest volume of the week.
This coming week should be interesting (this note is late as I was OOO Monday) as there are a handful of Fed speakers & NVDIA’s earnings report is due out Wednesday.
The Fed speakers aren’t likely to tell us anything we don’t already know & it seems that SPY is consolidating within Friday’s candle’s range while waiting to see what comes from that report.
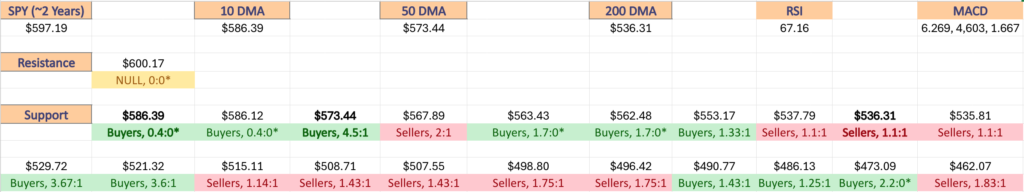
In the event it moves us to the upside the $600.17/share mark will be where all eyes focus to see if the resistance level can be broken.
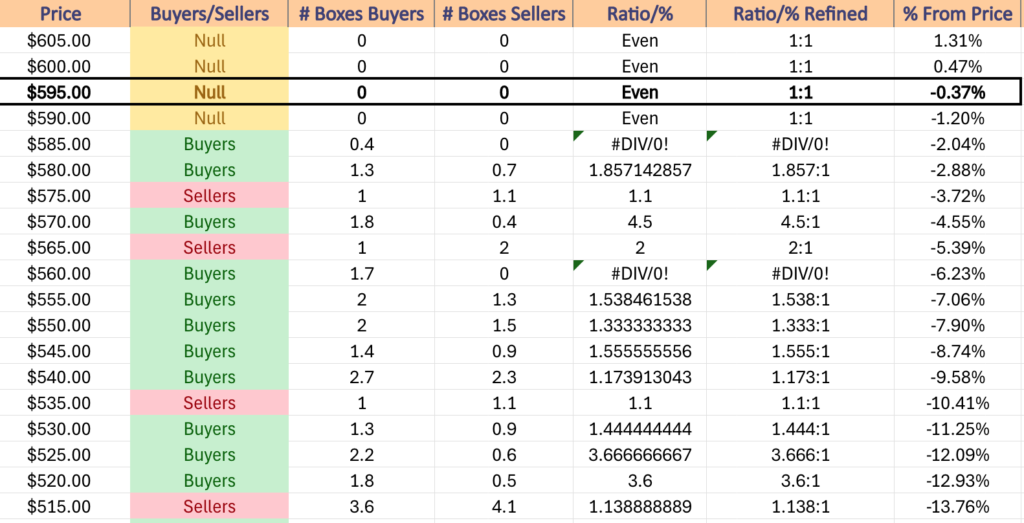
In the event it’s a downside surprise the window that is at the $580/share level from October will be in focus, as it was gapped both below & over & because the $575-579.99 level is a seller dominated price zone which will likely cause further declines.
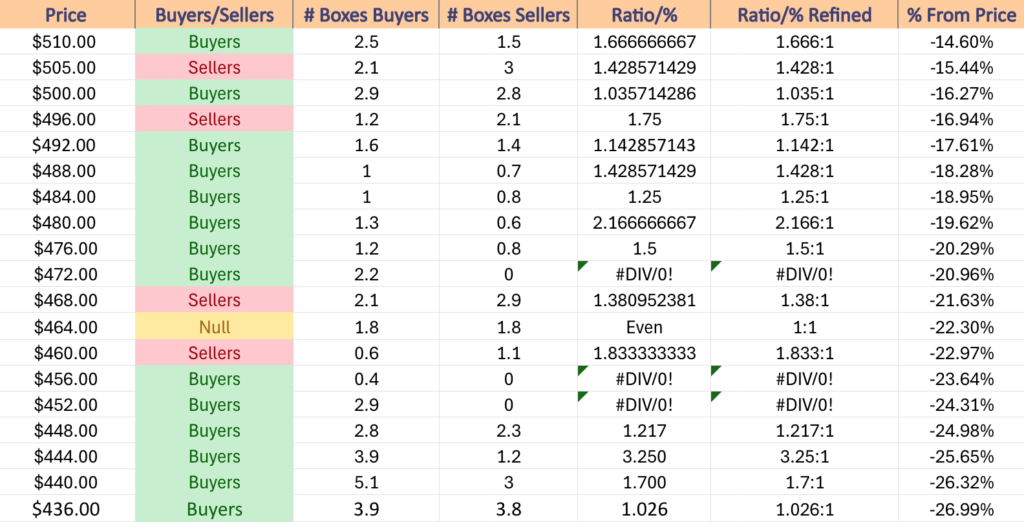
This will be problematic as there are not many local support levels for SPY from its current price & may mean it struggles to find footing until after a loss of 3-5%.
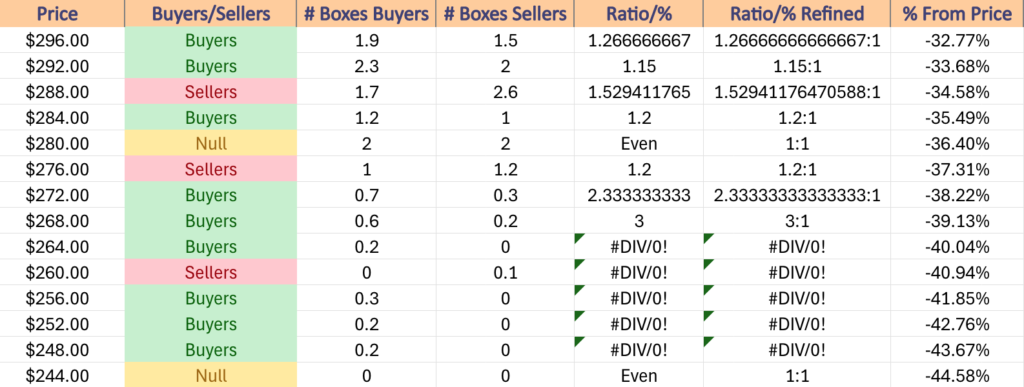
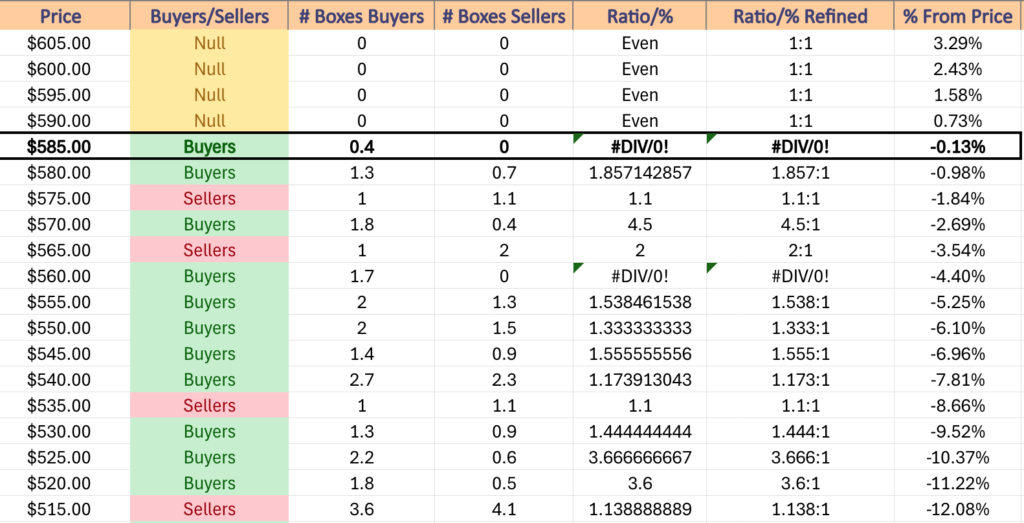
SPY has support at the $586.12 (Volume Sentiment: Buyers, 0.4:0*), $575.29 (50 Day Moving Average, Volume Sentiment: Sellers, 1.1:1), $567.89 (Volume Sentiment: Sellers, 2:1) & $563.43/share (Volume Sentiment: Buyers, 1.7:0*) price levels, with resistance at the $590.33 (10 Day Moving Average, Volume Sentiment: NULL, 0:0*) & $600.17/share (All-Time High, Volume Sentiment: NULL, 0:0*) price levels.
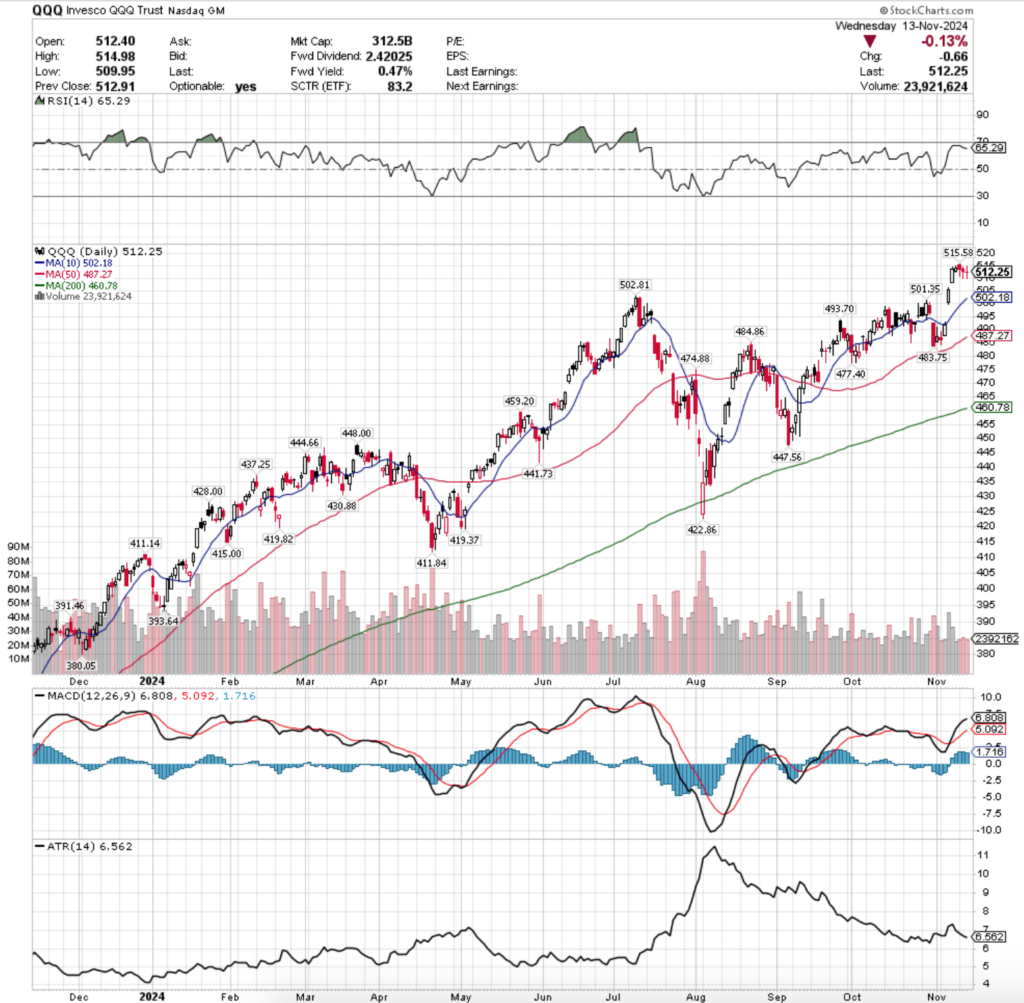
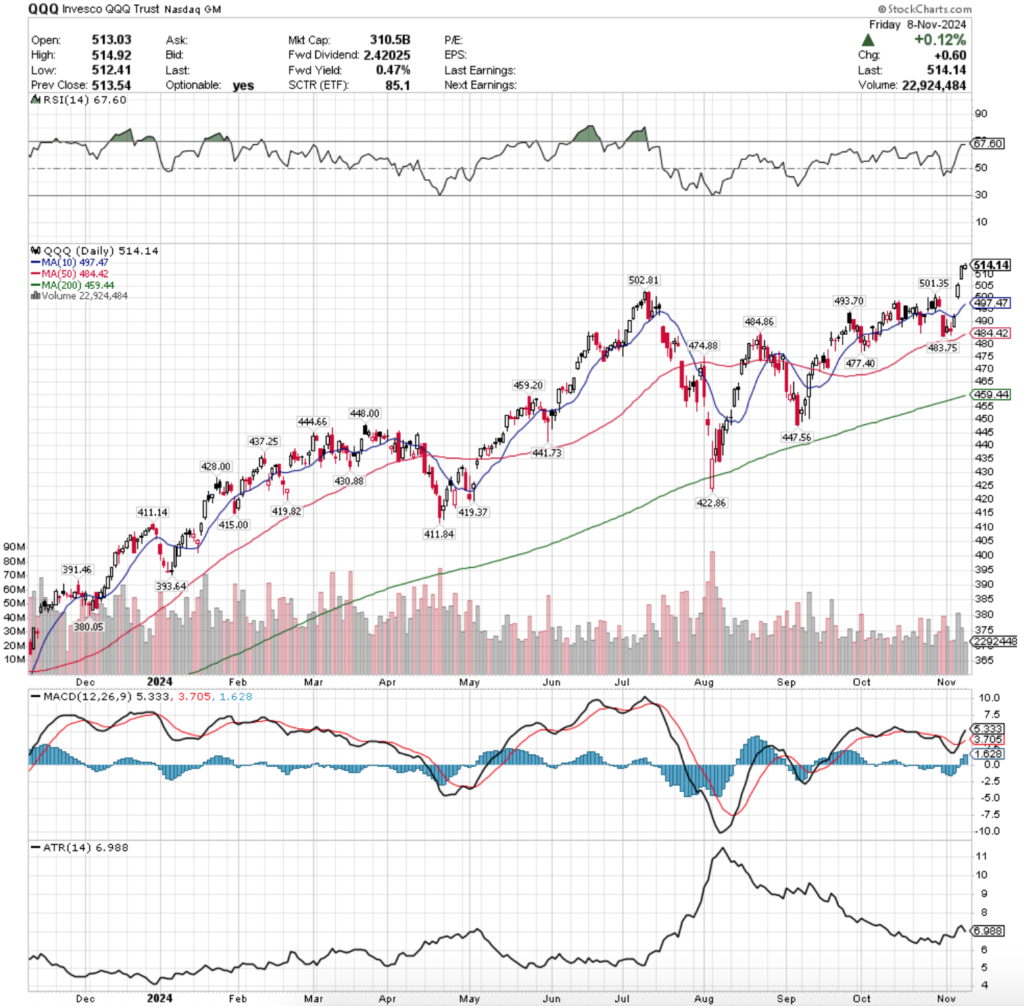
QQQ, the Invesco QQQ Trust ETF dropped -3.42% last week, as market participants were taking some profits after the prior week’s gap up sessions.
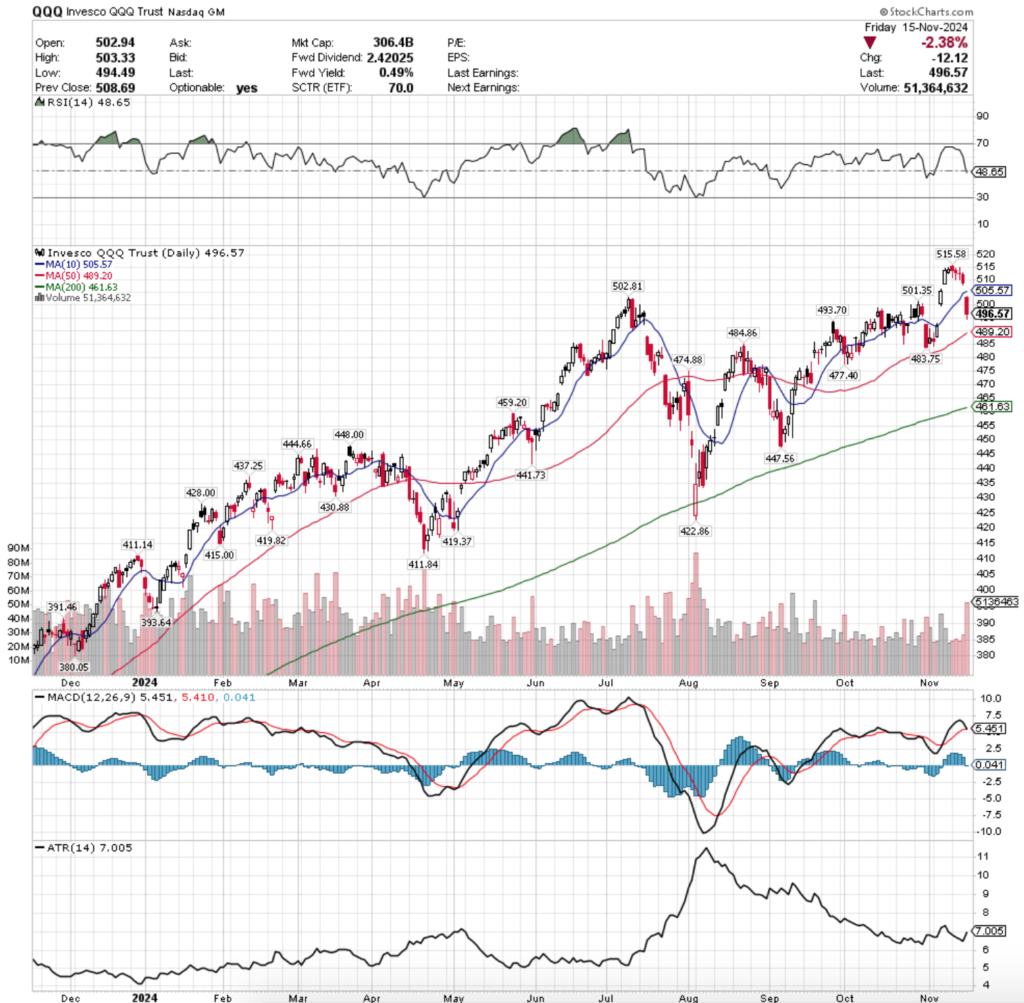
Their RSI is has just passed bearishly through the neutral level of 50 & sits currently at 48.65, while their MACD is set to cross the signal line bearishly during Monday’s session.
Volumes were -21.76% below the previous year’s average level (30,342,000 vs. 38,782,885), which like SPY means that they were dramatically lower than the prior year’s average from seven months ago, begging the question of where this money is & why.
QQQ’s week looks awfully similar to SPY’s, except that all of QQQ’s candles are red, while SPY had some that were filled black as they closed lower than they opened but advanced on the open.
Monday resulted in a new all-time high for QQQ on low volume that also was a hanging man candle, predicting the bearishness the rest of the week followed with.
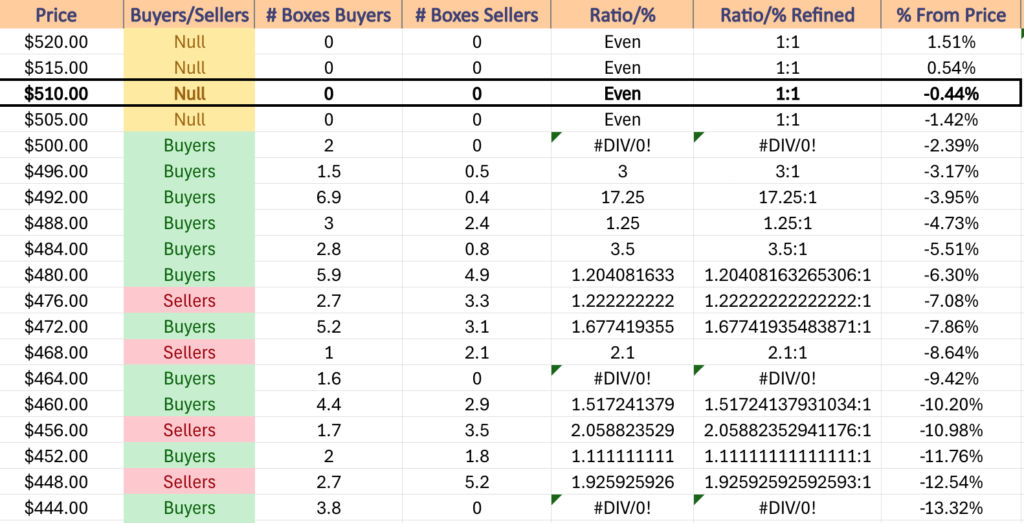
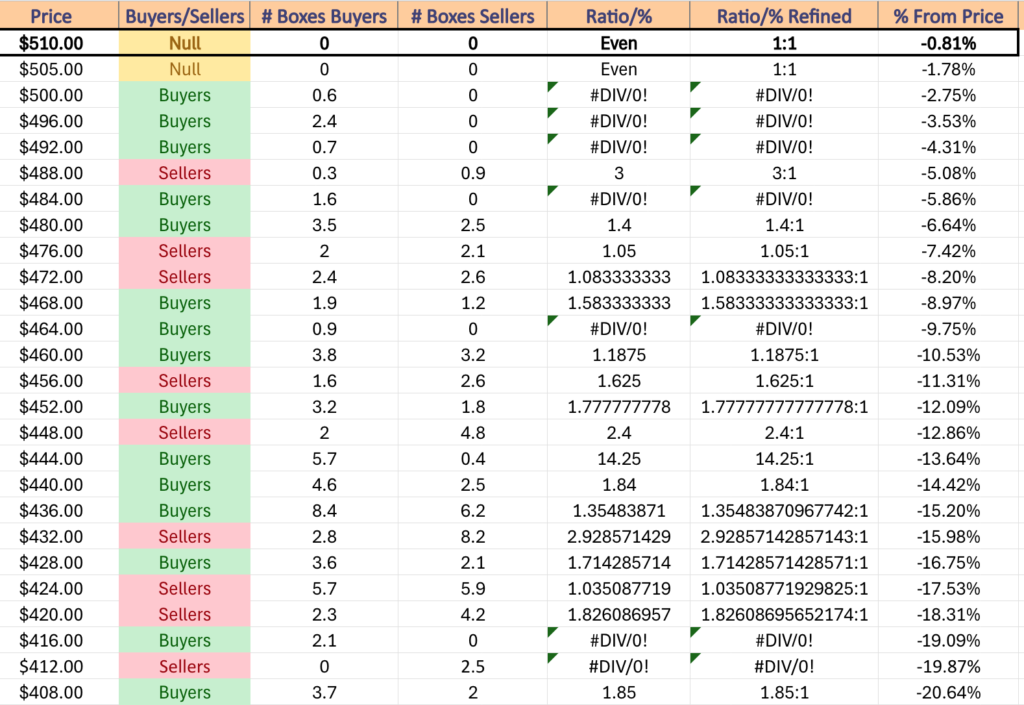
Tuesday continued lower, but the $510/share level was not broken through as investors seemed to think that was a fair valuation again on Wednesday when prices approached it, but did not break down through it.
Wednesday closed in a doji, indicating that there was temporary equilibrium in the eyes of market participants, before Thursday finally broke down the $510/share level to close beneath it.
Friday everything fell apart as QQQ gapped down to open below the 10 day moving average’s support & only continued lower throughout the day on the week’s highest volume.
Profits from the prior week’s gaps were taken 0ff of the table as investors await NVDA’s earnings report on Wednesday, as it will lend clues into the state of technology names.
In the event of a good report, QQQ has a few resistance levels to break through before they reach their all-time high, as like SPY so far this week they’ve just consolidated into the range set by Friday’s candle’s real body.
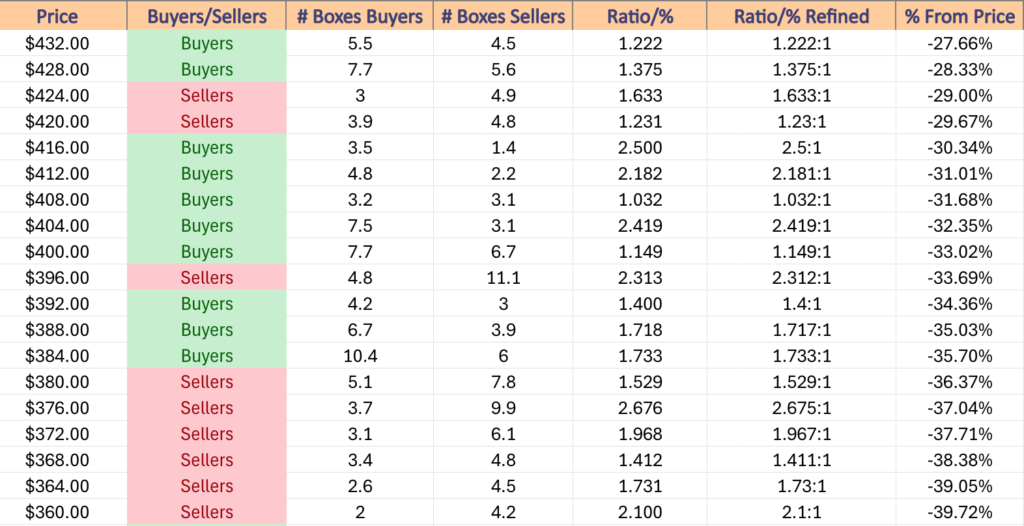
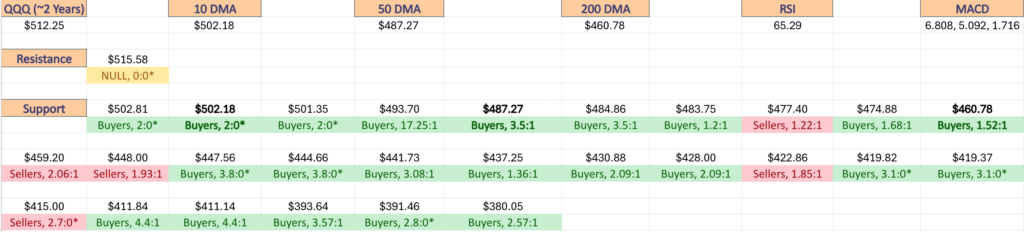
In the event they break out above the $502.81 mark the 10 DMA’s resistance will be interesting, given how hard they fell through it on Friday as a support level.
On the downside the 50 DMA is the second nearest support level, with the $493.70 one occurring in a price level that has been overwhelming strong for the buyers historically.
While Friday’s high volume may be viewed as some as ammunition getting ready to be reemployed in the market, based on how low volumes have been in the past seven months & how high Friday’s bearish session’s volume was we may be looking at more declining behavior in the near-term.
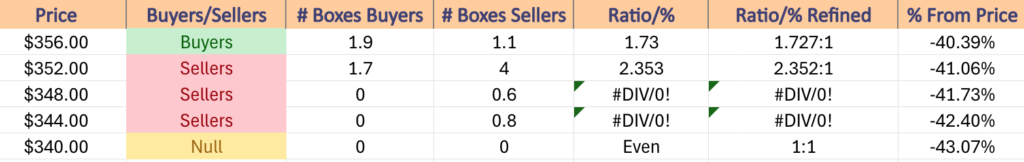
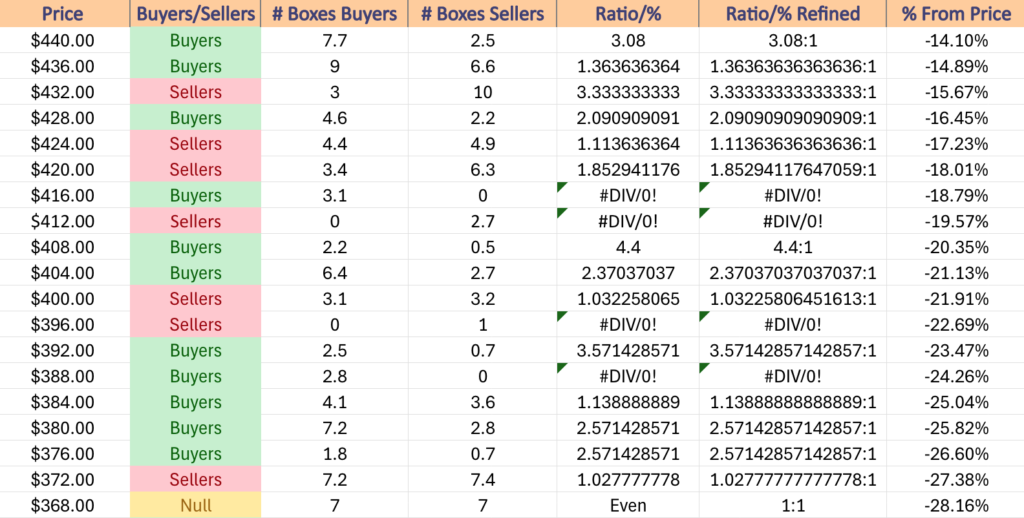
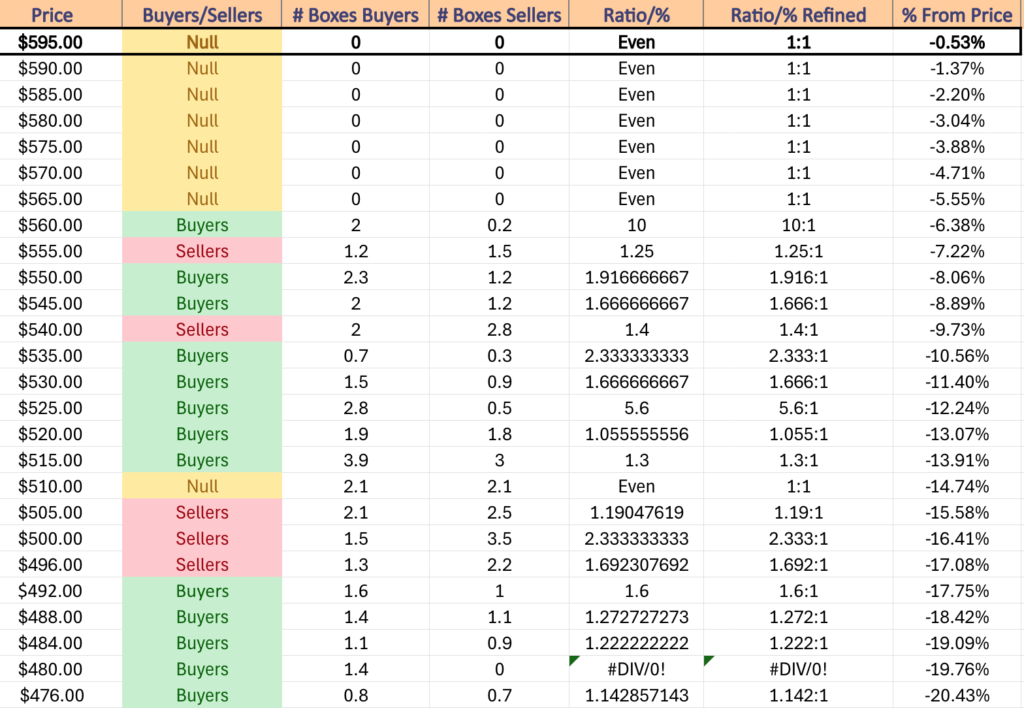
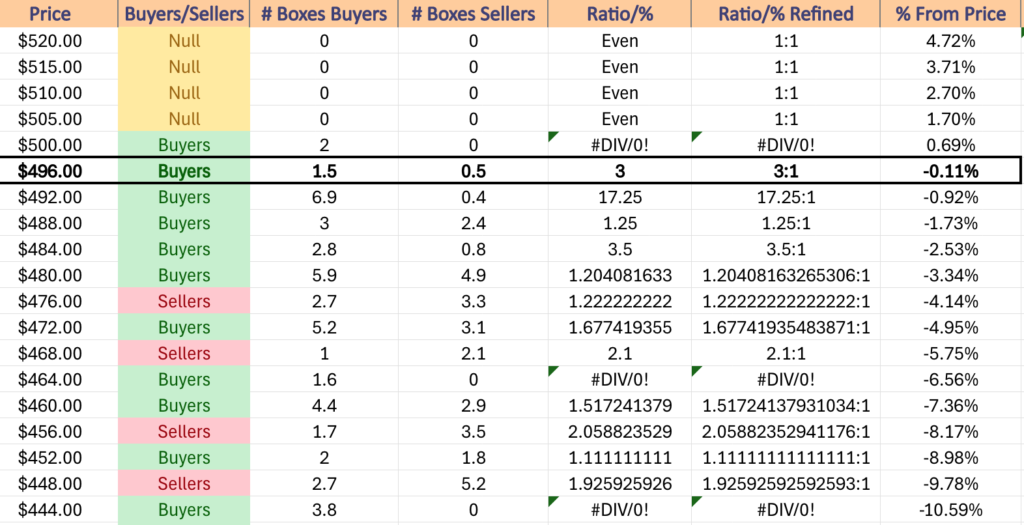
QQQ has support at the $493.70 (Volume Sentiment: Buyers, 17.25), $489.20 (50 Day Moving Average, Volume Sentiment: Buyers, 1.25:1), $484.86 (Volume Sentiment: Buyers, 3.5:1) & $483.75/share (Volume Sentiment: Buyers, 1.2:1) price levels, with resistance at the $501.35 (Volume Sentiment: Buyers, 2:0*), $502.81 (Volume Sentiment: Buyers, 2:0*), $505.57 (10 Day Moving Average, Volume Sentiment: NULL, 0:0*) & $515.58/share (All-Time High, Volume Sentiment: NULL, 0:0*) price levels.
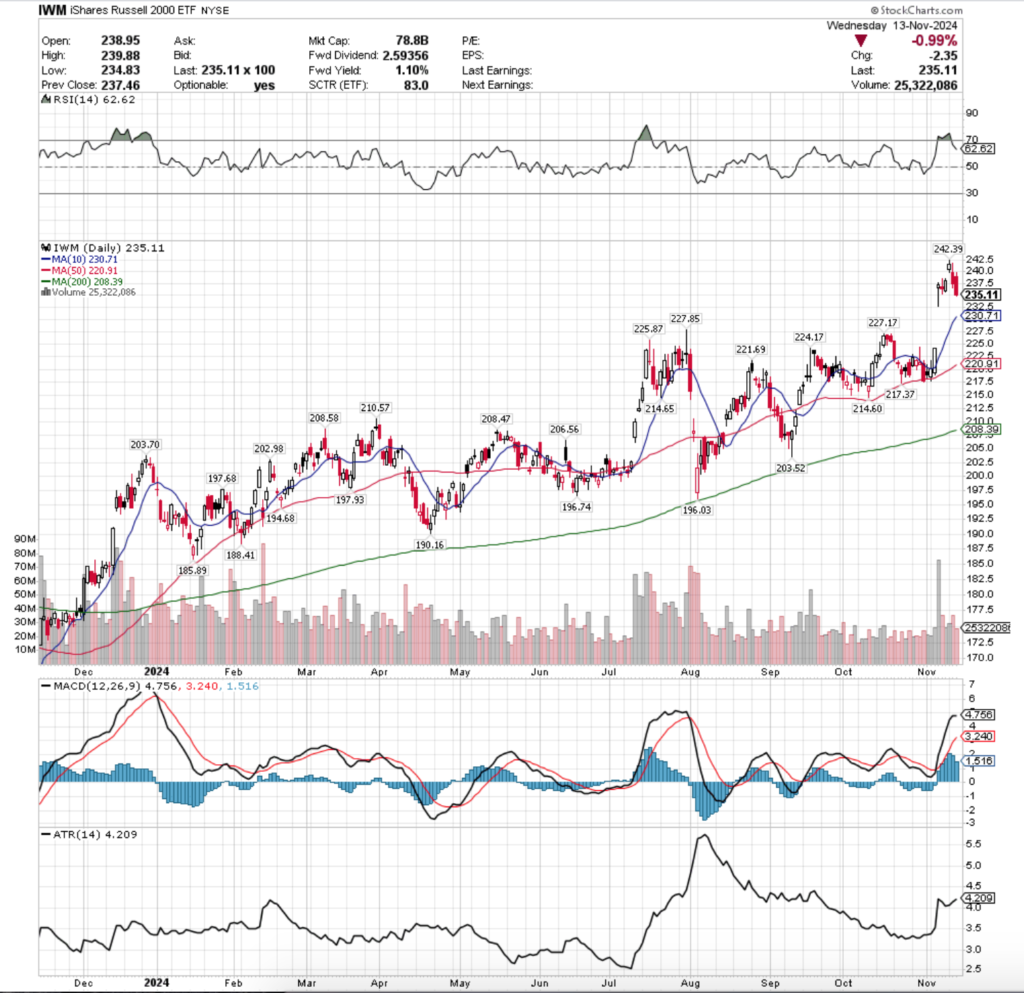
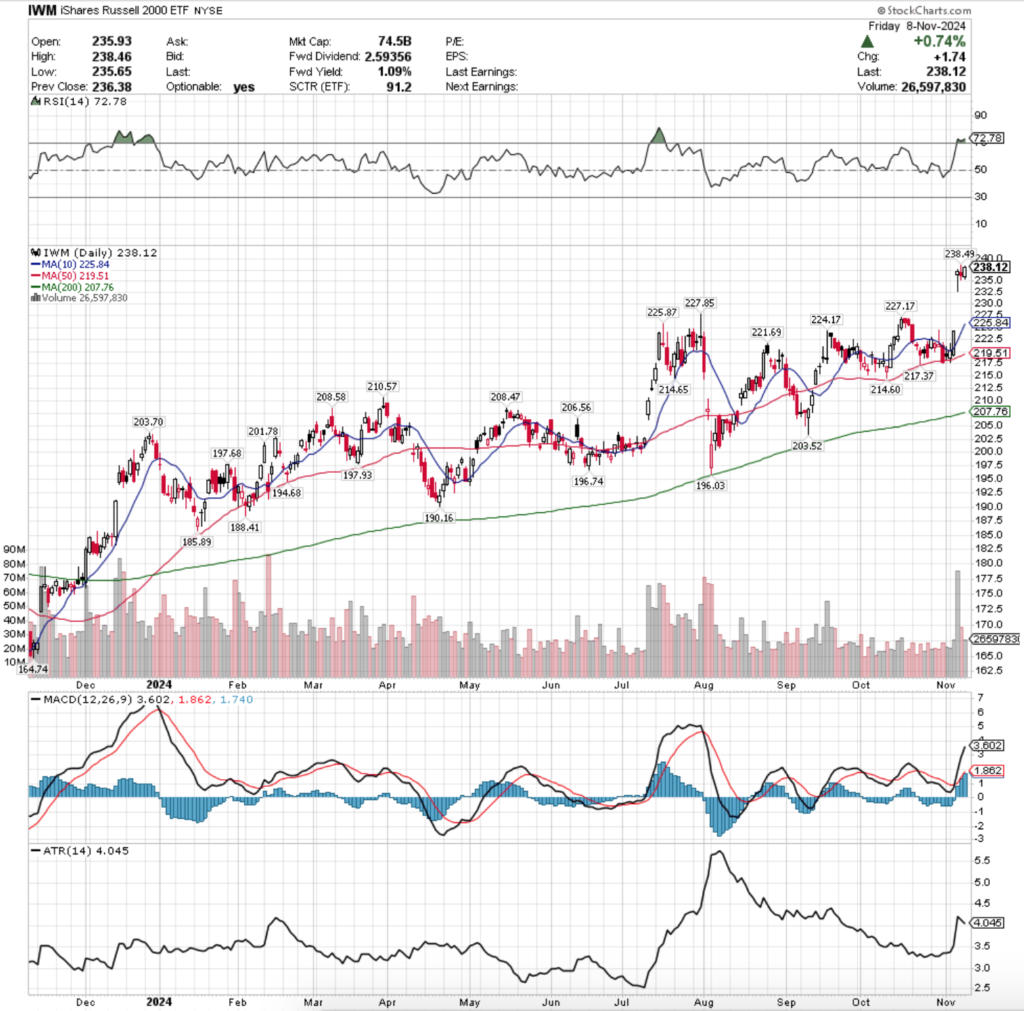
IWM, the iShares Russell 2000 ETF had the worst week of the major four index ETFs, declining -4.05% as investors took profits on the heels of their outperformance from last week.
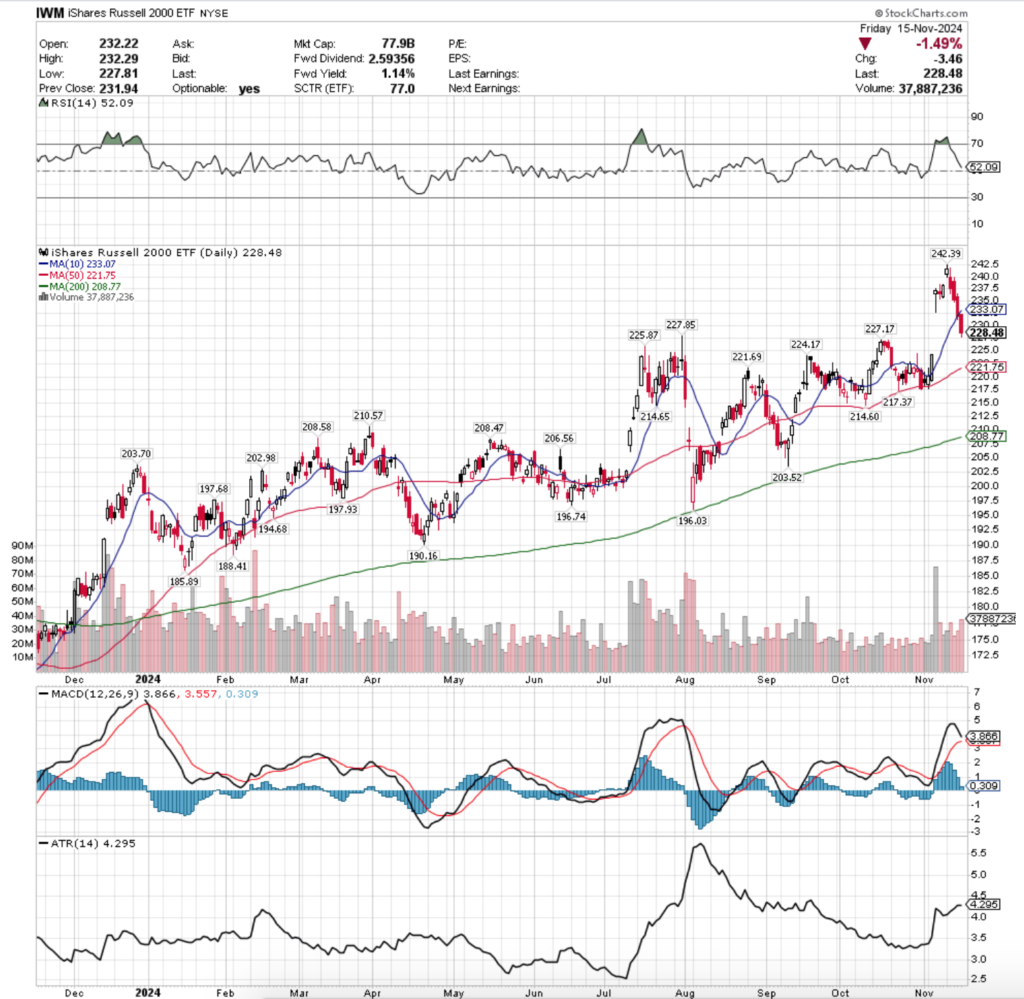
Their RSI is near the neutral 50 mark & sits at 52.09, while their MACD is bearishly approaching the signal line & looks set to cross over it early this week.
Volumes were -7.19% below the previous year’s average level (30,872,000 vs. 33,265,375), which is rare to see these days, as IWM has been trading at higher volume levels than it had been seven months ago (unlike SPY & QQQ).
Unlike SPY & QQQ, WM’s week kicked off on an advancing session that reached a new all-time high, but it was on low volume & resulted in a spinning top candle which means that there was a bit of uncertainty among market participants.
This led to the avalanche of tall red candles that came throughout the rest of the week, as investors took their profits from the previous week & went running.
Thursday’s session saw a temporary breakdown of the 10 DMA’s support, which led to Friday’s open below it & continued move downward towards near the $227.50/share level ($227.81).
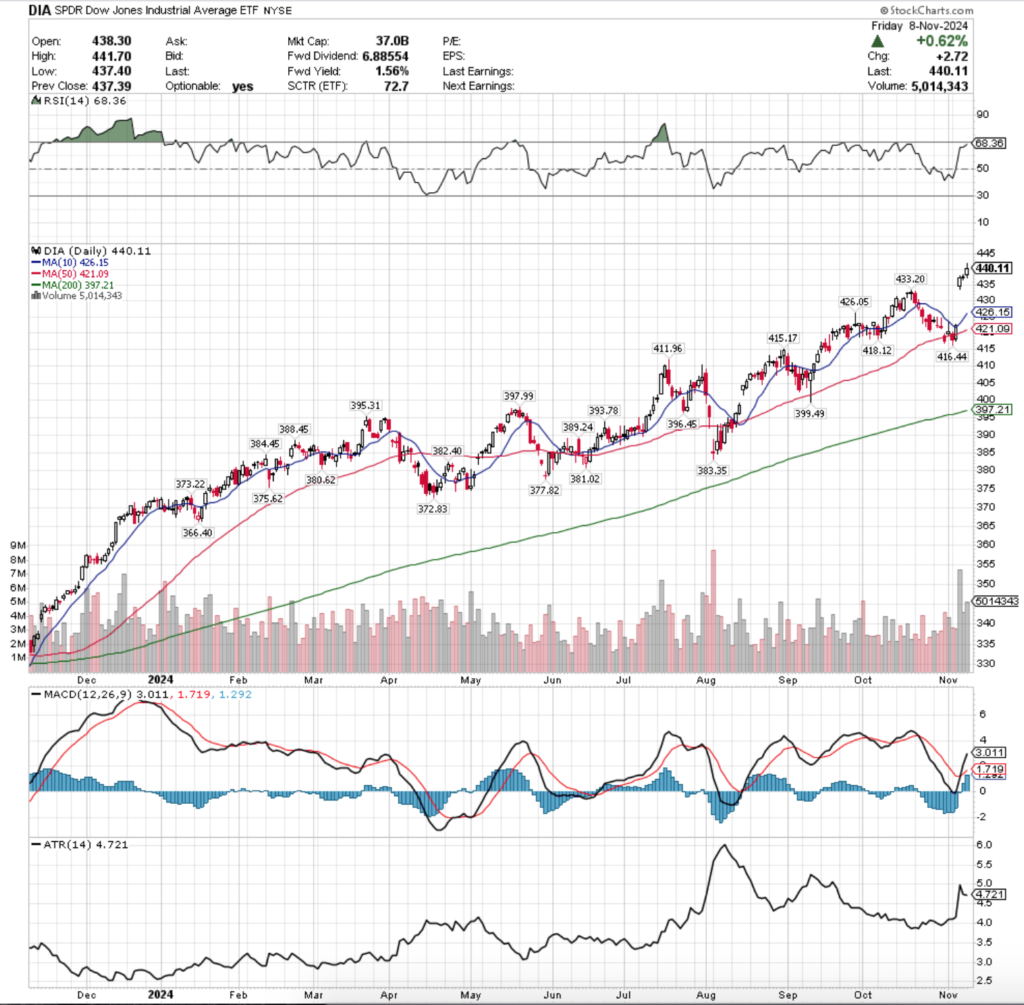
IWM’s closing level on Friday sits right atop the $227/share support zone, but the window created by last Wednesday is still sitting open & the past couple of weeks have shown both the tops & bottoms of IWM’s trading begin to close up & narrow, indicating that there is an added degree of uncertainty in the market right now.
Should the window continue to close, the 50 Day Moving Average will become the place of focus as it continues moving higher & will likely be near the bottom of the window by the time a test comes.
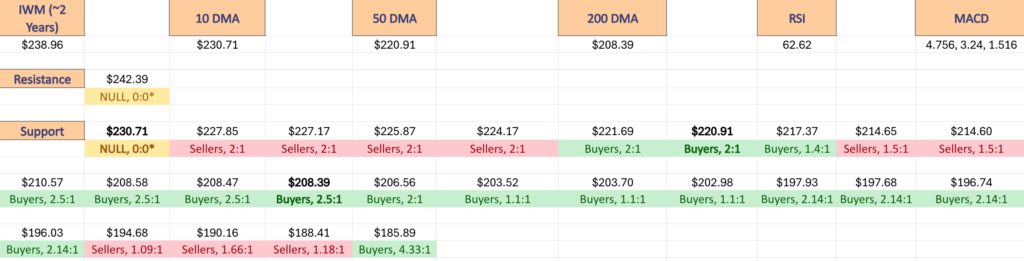
The first four support levels from Friday’s close have been seller dominated 2:1 over the past 3-4 years.
As for the upside, if IWM breaks above its 10 DMA the only resistance level above it is the all-time high, which it will need some strong volume to break above.
This may prove difficult, given that IWM’s current average prior year’s volume is already higher than it was seven months ago, which is not the case for SPY or QQQ.
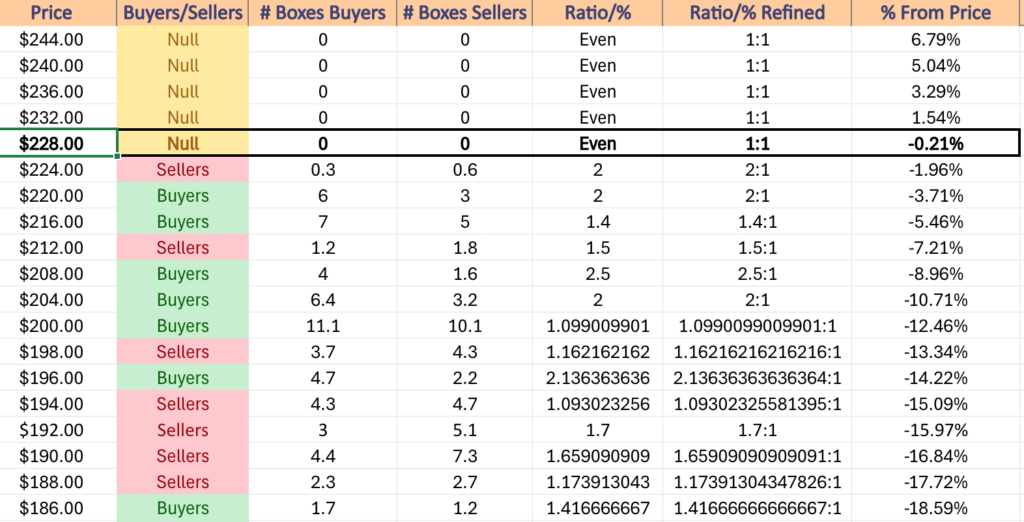
IWM has support at the $227.85 (Volume Sentiment: Sellers, 2:1), $227.17 (Volume Sentiment: Sellers, 2:1), $225.87 (Volume Sentiment: Sellers, 2:1) & $224.17/share (Volume Sentiment: Sellers, 2:1) price levels, with resistance at the $233.07 (10 Day Moving Average, Volume Sentiment: NULL, 0:0*) & $243.39/share (All-Time High, Volume Sentiment: NULL, 0:0*) price levels.
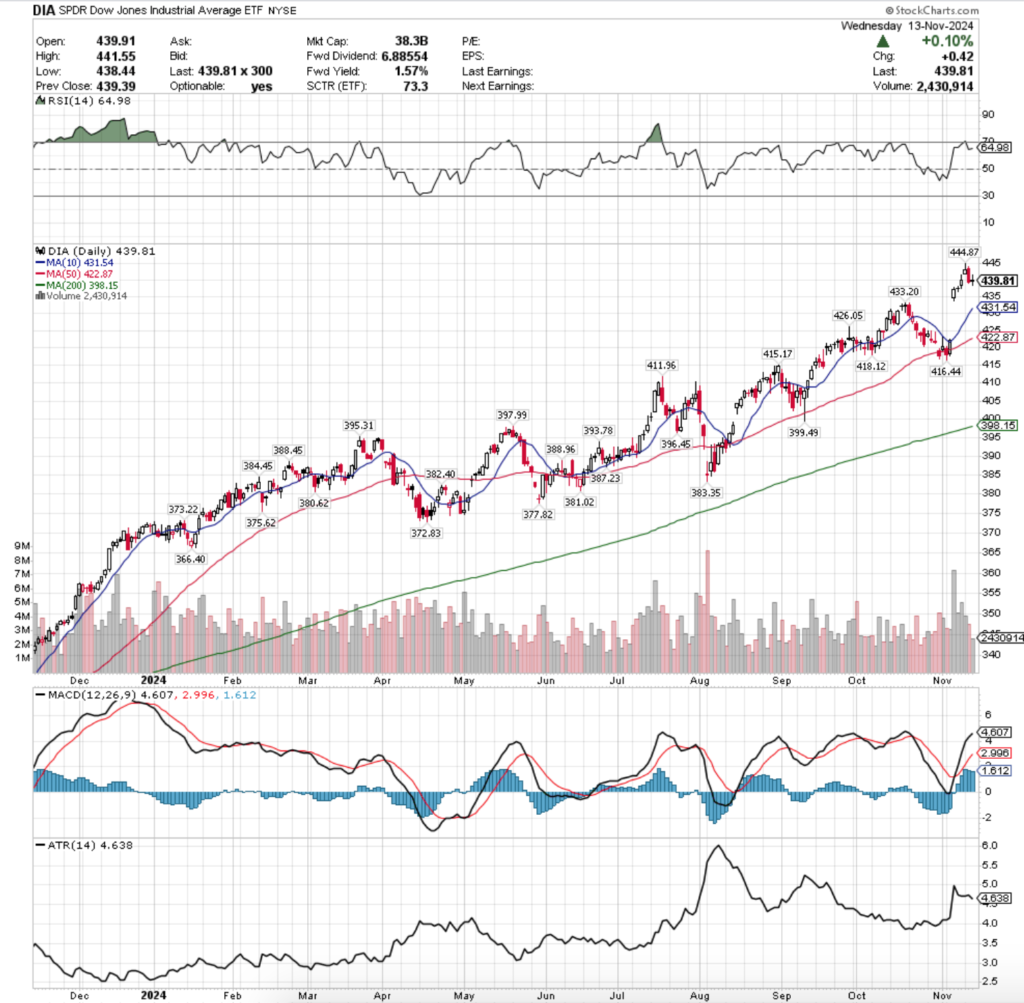
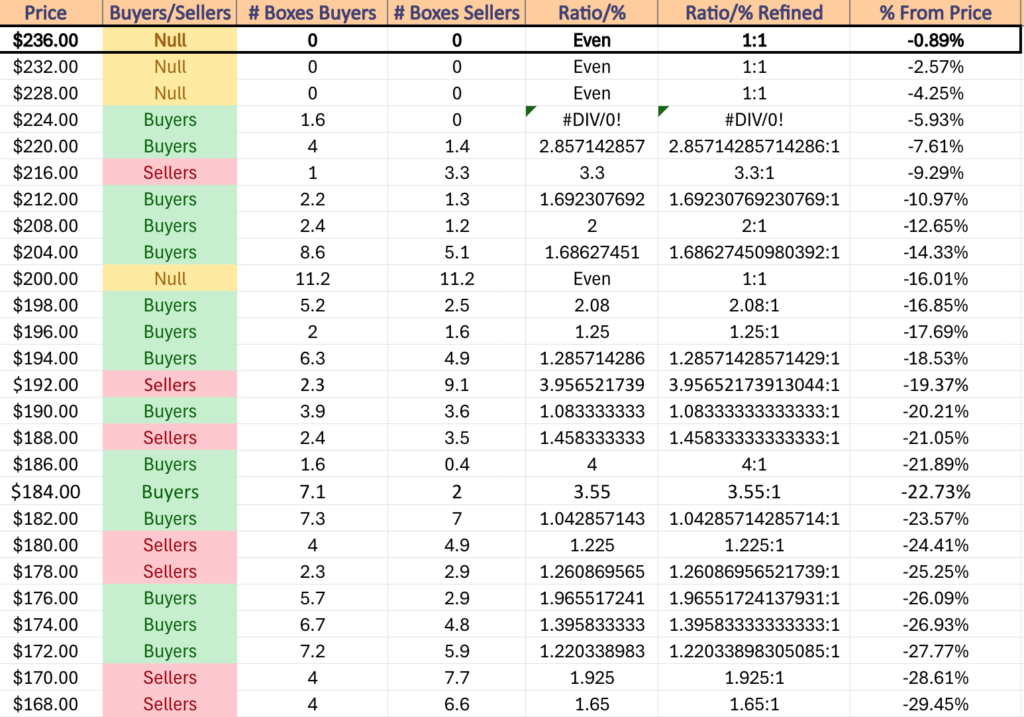
DIA, the Dow Jones Industrial Average ETF fared the best this week of the major four index ETFs, falling just -1.27%.
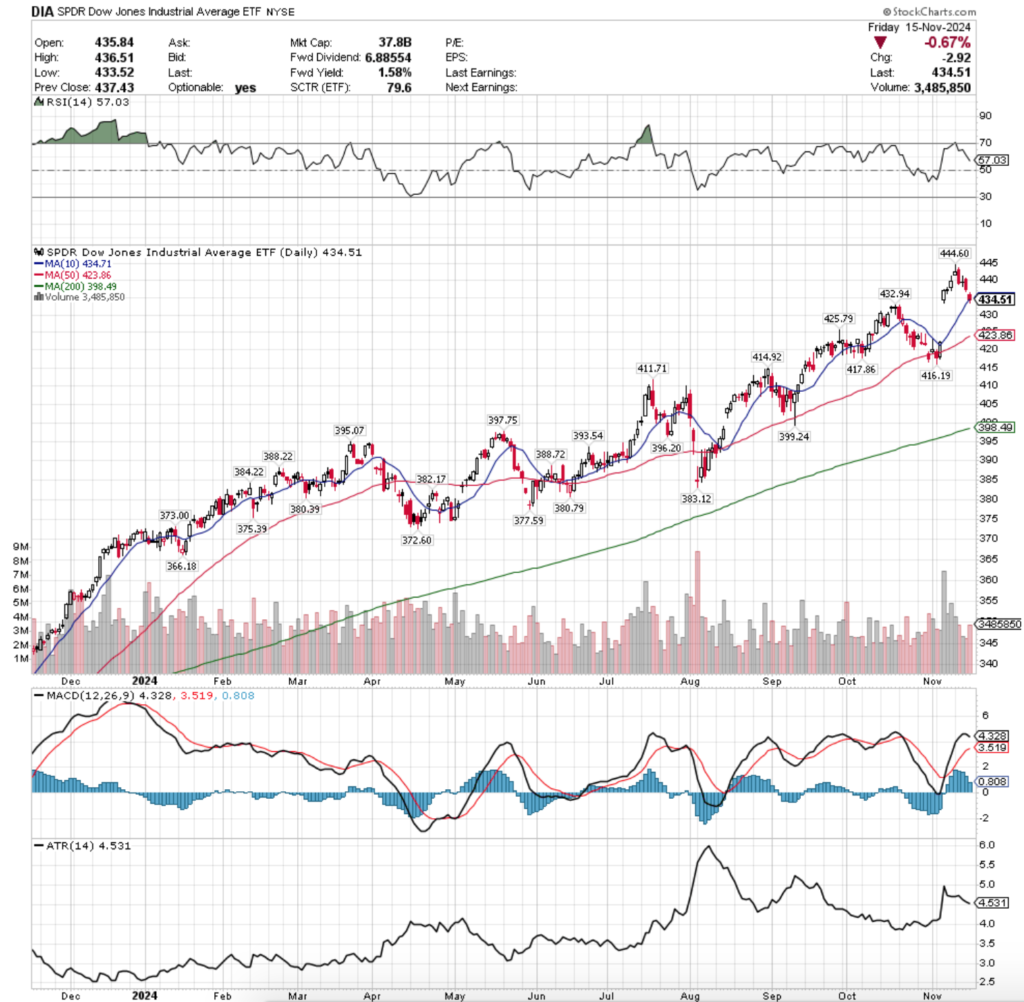
Their RSI is trending back down towards neutral & sits currently at 57.03, while their MACD has curled over bearishly & looks primed to cross through the signal line by mid-week.
Volumes were -8.4% below the prior year’s average (3,162,000 vs. 3,451,937), as investors are skittish, but still wetting their beaks on the blue chip index’s components.
Monday kicked off the week with a shooting star candle (bearish) with a new all-time high for DIA.
Tuesday set the stage for some hard times to come, when a bearish engulfing candle sent DIA below the $440/share level before Wednesday’s doji candle that finished relatively in line with Tuesday’s close.
Wednesday the pain continued, as DIA opened higher before another wide-range bearish engulfing candle came from the day’s session, which led to the pain DIA felt Friday when prices gapped down & continued lower after the open to close just below the resistance of the 10 day moving average.
Tomorrow will be an interesting day, as NVDA’s earnings do not directly impact DIA or IWM as they are not a component of those indexes, which will be something for folks to keep in mind over the coming two days of trading.
DIA has a large window from the previous week to fill in on the downside, with their all-time high being the only resistance level, but one that will be a formidable level to break above.
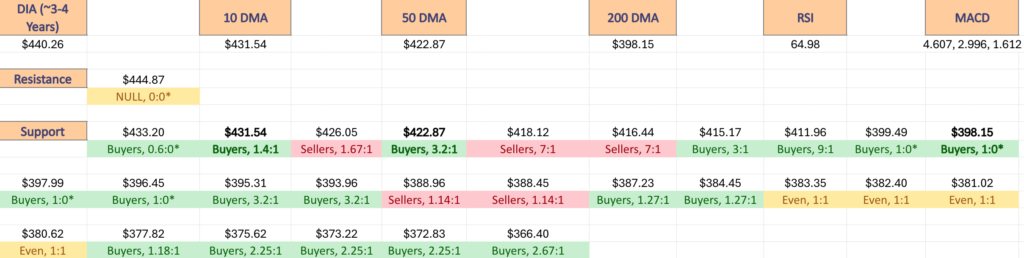
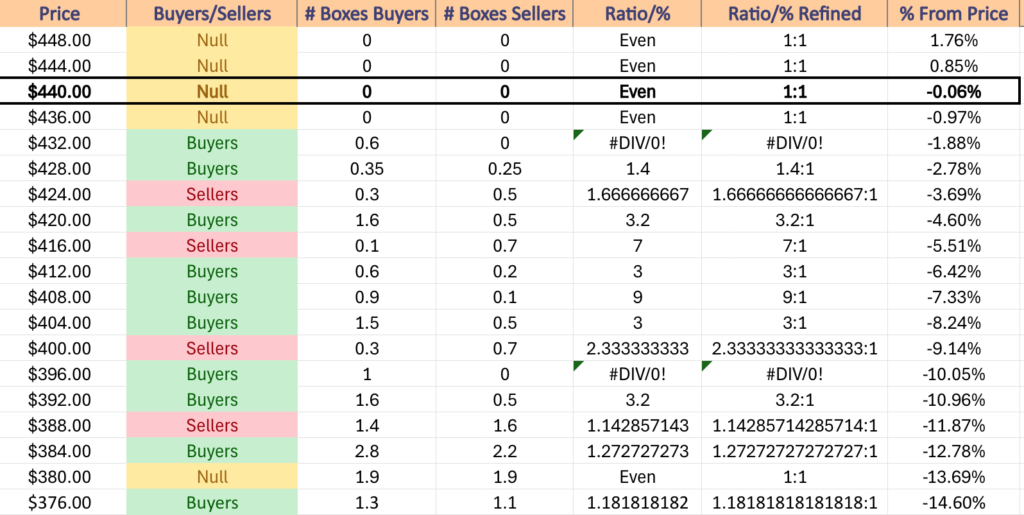
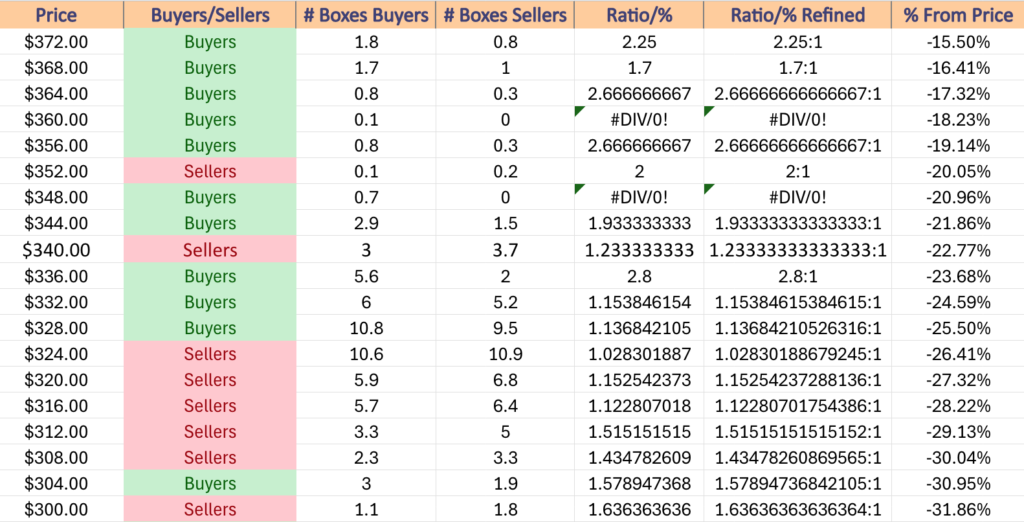
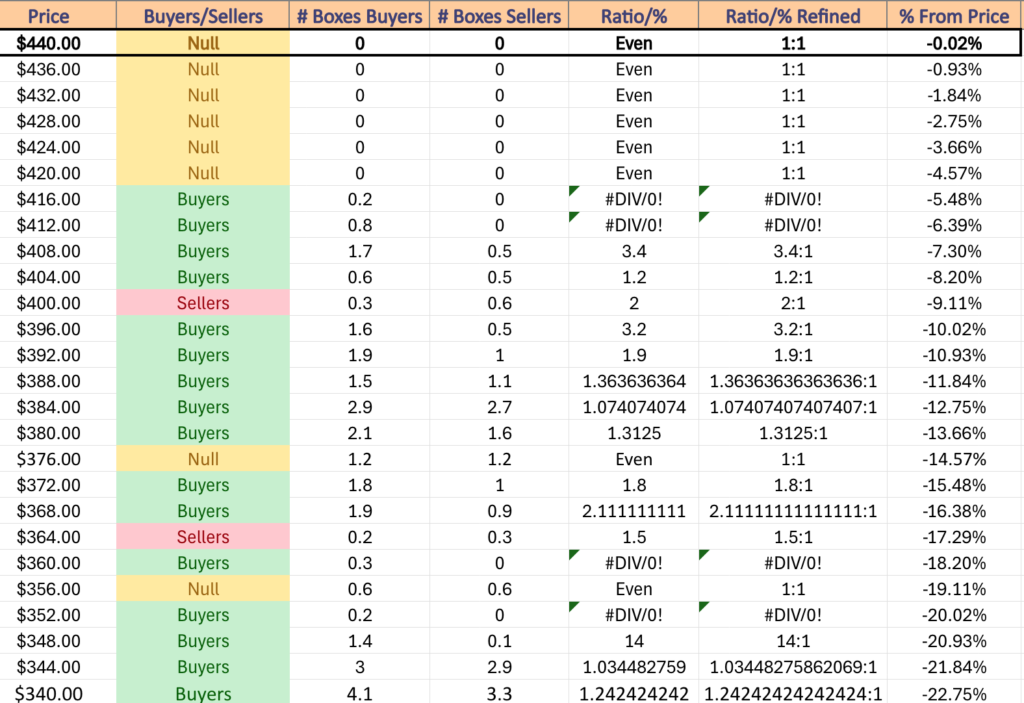
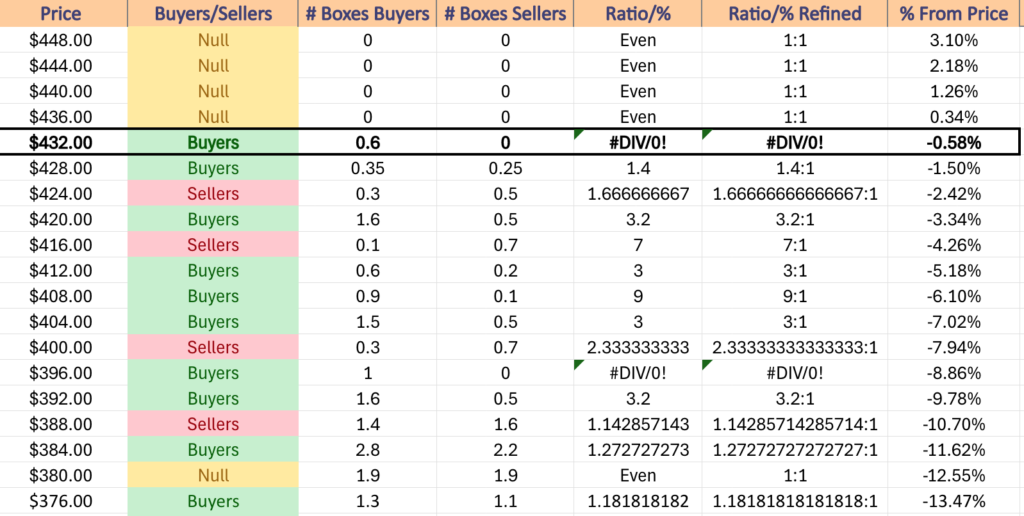
DIA has support at the $432.94 (Volume Sentiment: Buyers, 0.6:0*), $425.79 (Volume Sentiment: Sellers, 1.67:1), $423.86 (50 Day Moving Average, Volume Sentiment: Buyers, 3.2:1) & $417.86/share (Volume Sentiment: Sellers, 7:1) price levels, with resistance at the $434.71 (10 Day Moving Average, Volume Sentiment: Buyers, 0.6:0*) & $444.60/share (All-Time High, Volume Sentiment: NULL, 0:0*) price levels.
The Week Ahead
Home Builder Confidence Index data & Fed President Goolsbee speaking are Monday morning’s big market data, each coming in at 10 am.
Monday morning kicks off with reports from Brady (BRC) & Twist Bioscience, followed by AECOM, BellRing Brands & Symbiotic after the session’s close.
Tuesday morning features Housing Starts & Building Permits data at 8:30 am, followed by Fed President Goolsbee speaking again at 12:25 pm.
Walmart, Amer Sports, Energizer, Jacobs Solutions, Lowe’s, Medtronic, Oaktree Specialty Lending Corp, Viking Holdings, Vipshop & Weibo report earnings before the opening bell on Tuesday, with Alcon, AZEK, Dolby Labs, Golub Capital, Keysight, La-Z-Boy, Powell Industries, Varex Imaging & ZTO Express set to report after the closing bell.
Wednesday is another Fed speaker day, with Governor Cooks speaking at 11 am & Governor Bowman speaking at 12:15 pm.
Wednesday morning’s earnings reports include Berry Global, Dycom, Global-E Online, Nio, Spire, Target, TJX Companies & Wix.com, followed by NVDA, Copa Holdings, Jack In The Box, Maximus, Palo Alto Networks, Snowflake & Sociedad Quimica y Minera after the session’s closing bell.
Thursday begins with Initial Jobless Claims & Philadelphia Fed Manufacturing Survey Data at 8:30 am, Fed President Hammack speaking at 8:45 am, Existing Home Sales & Leading Economic Index data reported at 10 am, Fed President Schmid speaking at 1:10 pm & Fed Vice Chair For Supervision Barr speaking at 4:40 pm.
Deere & Company, Atkore International, BJ’s Wholesale, KE Holdings, Shoe Carnival, Vestis & Warner Music Group report earnings on Thursday morning before the session’s open, with Copart, Elastic, Gap, Intuit, Ross Stores & UGI Group reporting after the close.
S&P Flash U.S. Services PMI & S&P Flash U.S. Manufacturing PMI data come out Friday morning at 9:45 am, followed by Consumer Sentiment (final) data at 10 am & Fed Governor Bowman speaking at 6:15 pm.
Friday’s primary earnings report is Buckle before the session’s open.
See you back here next week!
*** I DO NOT OWN SHARES OR OPTIONS CONTRACT POSITIONS IN SPY, QQQ, IWM OR DIA AT THE TIME OF PUBLISHING THIS ARTICLE ***