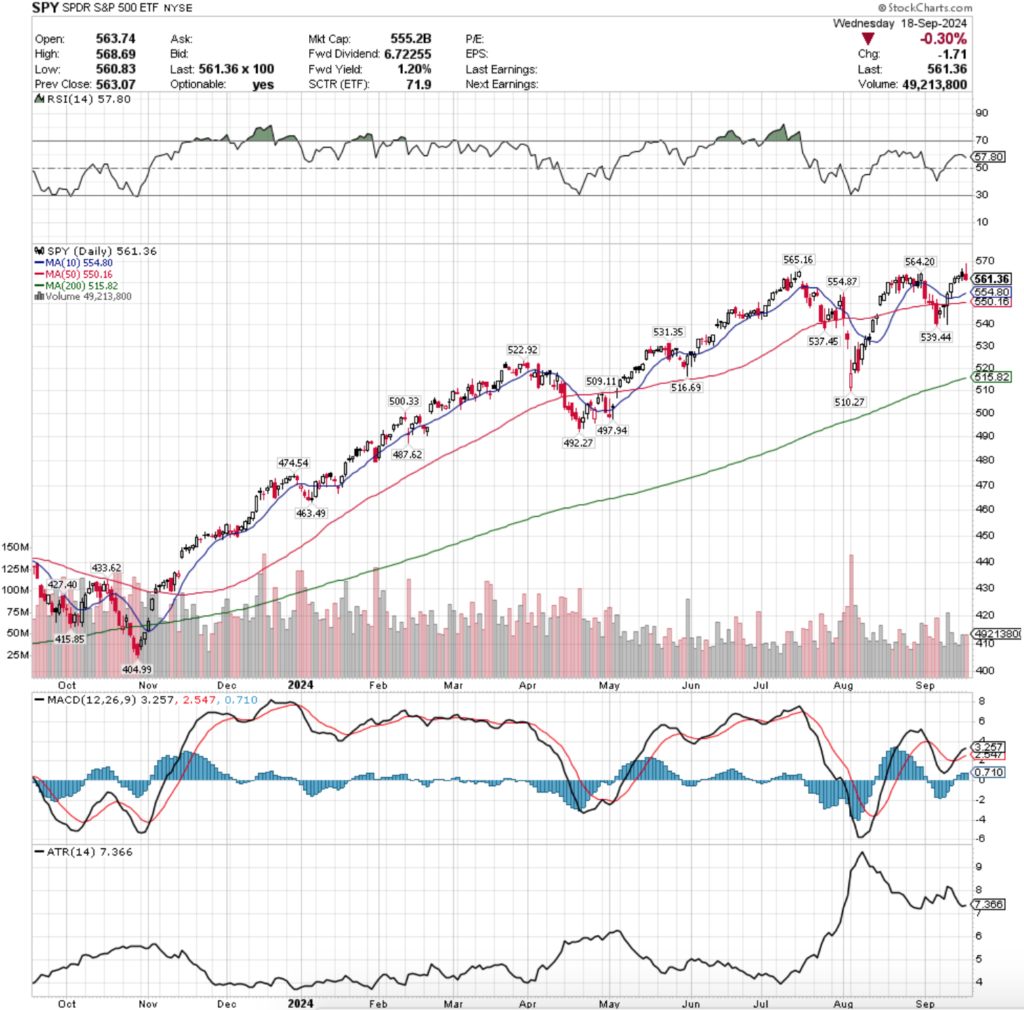
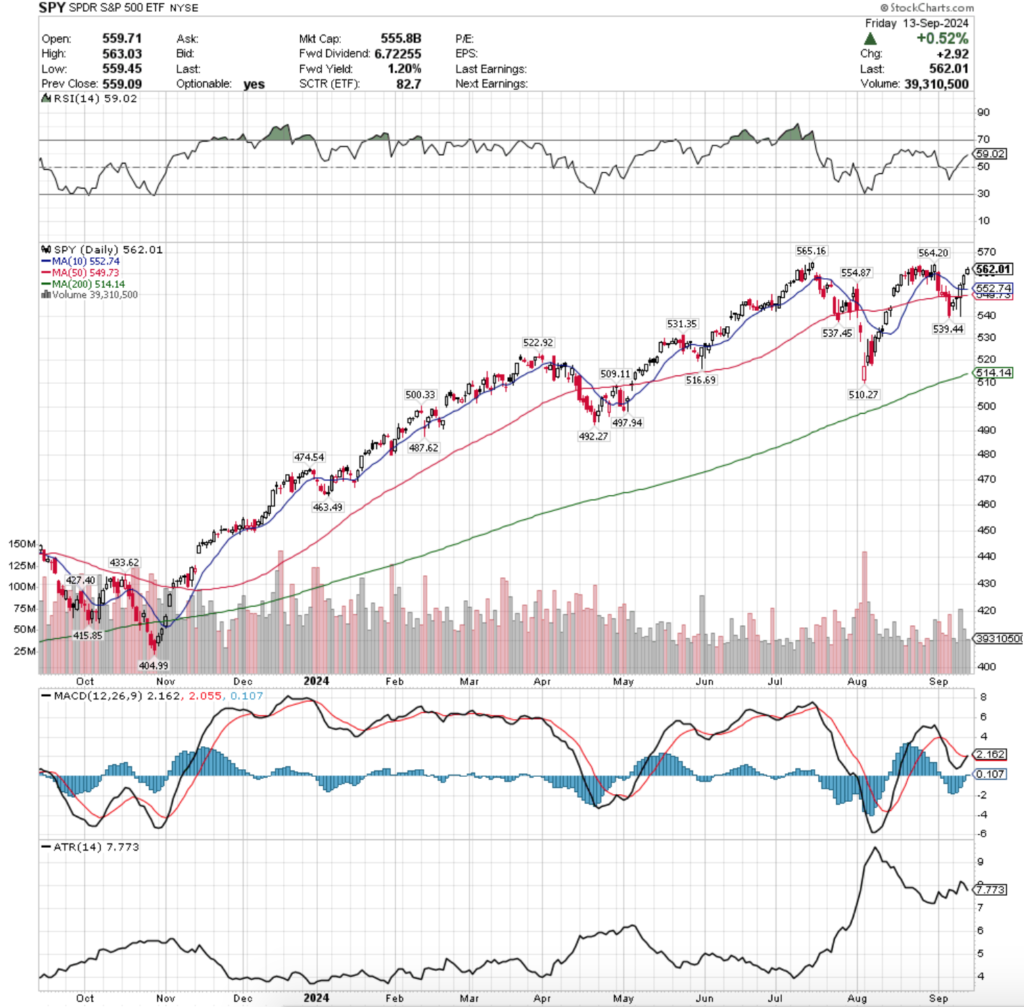
SPY, the SPDR S&P 500 ETF had the weakest week of the major four indexes, gaining only +1.11%, while the VIX finished the week at 16.15, indicating a one day implied move of +/-1.02% & an implied one month move of +/-4.67% for the S&P 500.
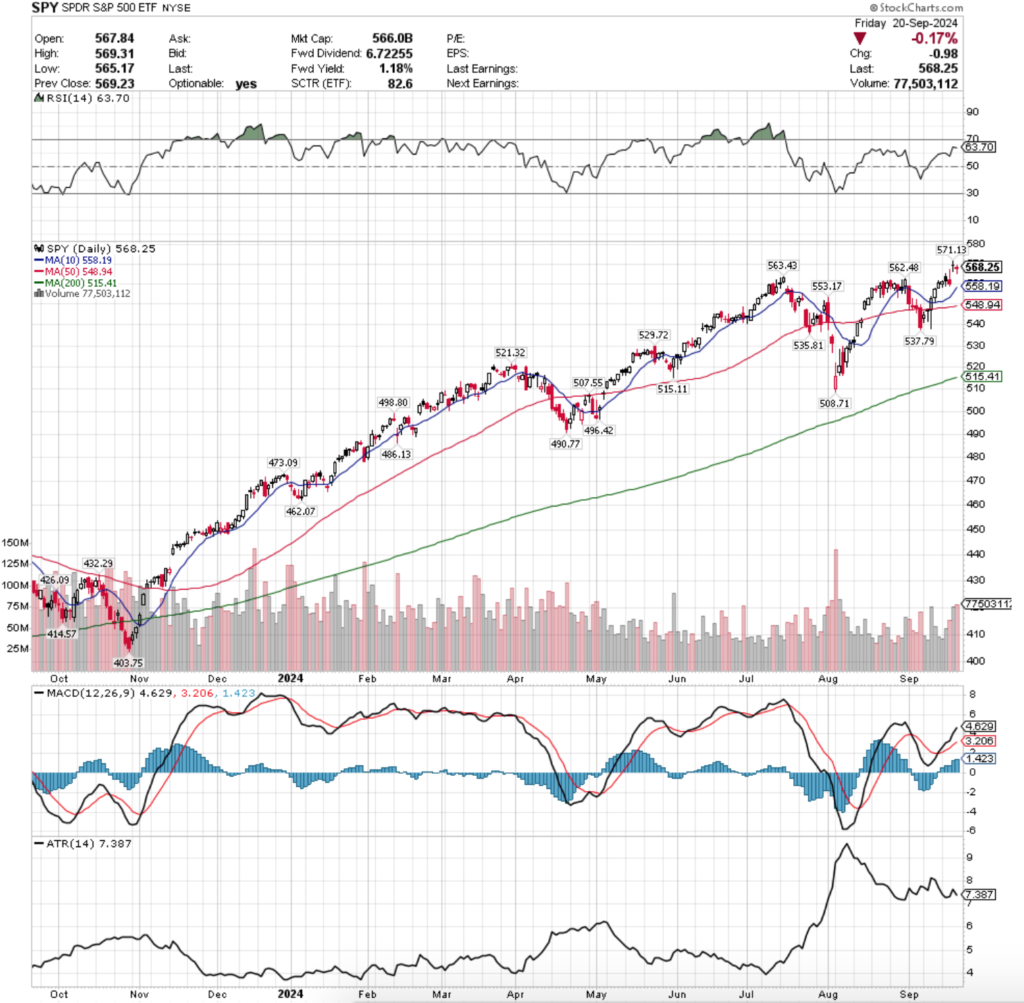
Their RSI is currently at 63.7 & has curled over bearishly after Friday’s session which will be something to keep an eye on moving into this week.
SPY’s MACD is still bullish following Thursday’s gap up session, however it should be noted that Thursday’s gains were only due to the gap up & their closing price was lower than their opening price.
Volumes were still weak, finishing the week -12.16% below the past year’s average (59,568,000 vs. 67,816,126), which is problematic given that two of the week’s three highest volume sessions were declining sessions.
The week began on a note of uncertainty, as Monday’s session was a tight range advance on the week’s lowest volume that barely closed above the previous Friday’s close.
Tuesday continued this theme, as despite a gap up on the open, the day closed lower, although still higher than Monday’s close & the candle’s lower shadow shows that there was a bit of appetite to the downside compared to the upside.
Wednesday is when weakness began to show itself as the session tested higher than Tuesday’s high before ultimately giving everything back & resulting in a decline on higher volume than the previous two days as market participants were eager to take some chips off of the table.
Thursday gapped higher on the second highest volume of the week, but resulted in a long-legged doji indicating uncertainty among market participants.
It should be noted that the session closed lower than it opened on Thursday, which indicates that the day’s open was deemed to be too high by investors.
Friday solidified this sentiment, as the day opened on a gap lower on the highest volume of the week as folks were eager to remove risk before heading into the weekend.
Friday tested more to the downside than upside based on the length of the day’s candle’s lower & upper shadows but the session only closed down -0.17%.
Heading into this week there are still a handful of earnings calls including Costco, as well as a plethora of economic data & Fed speakers which should make for an interesting week.
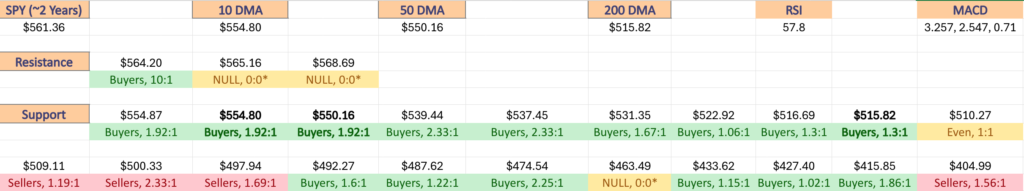
All eyes will be on the $562.48-563.43 support zone this week, as a ~1% downside move will test these support levels that have developed over the past two months when prices reached new peaks & began declining.
As noted in last week’s market review note, this will occur in the event of a throwback following a false breakout.
Prices have broken out but not progressed much higher & have declined since setting the new all-time high.
This looks possible given the lack of strength behind the mid-to-end of week performance of SPY last week.
Watch the MACD histogram for clues into this, as if the bars begin to get lower day-over-day it will signal that there is not much steam left & that there is an impending decline.
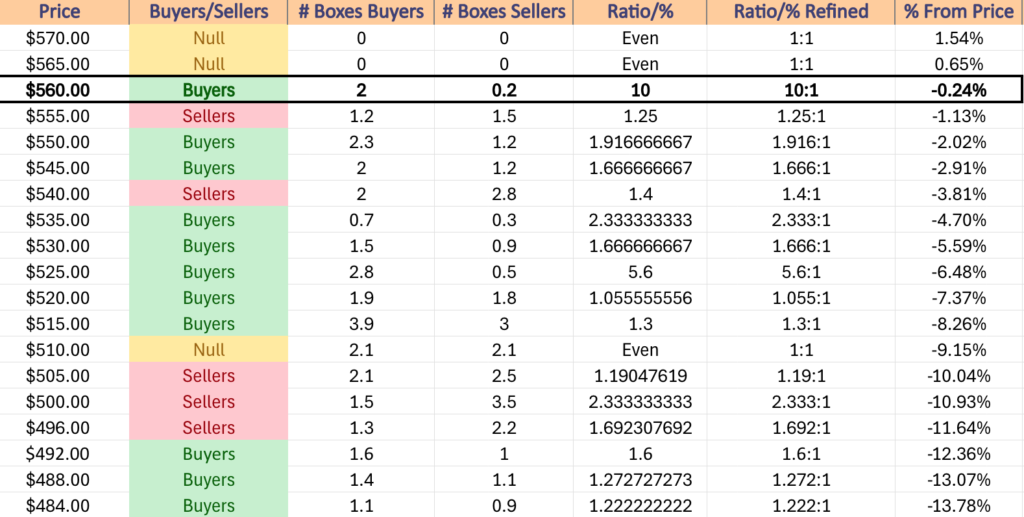
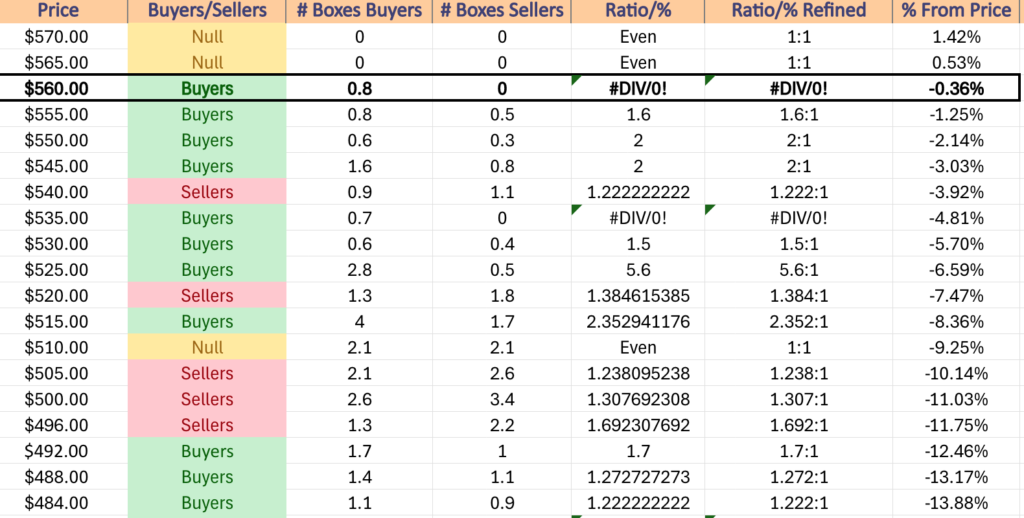
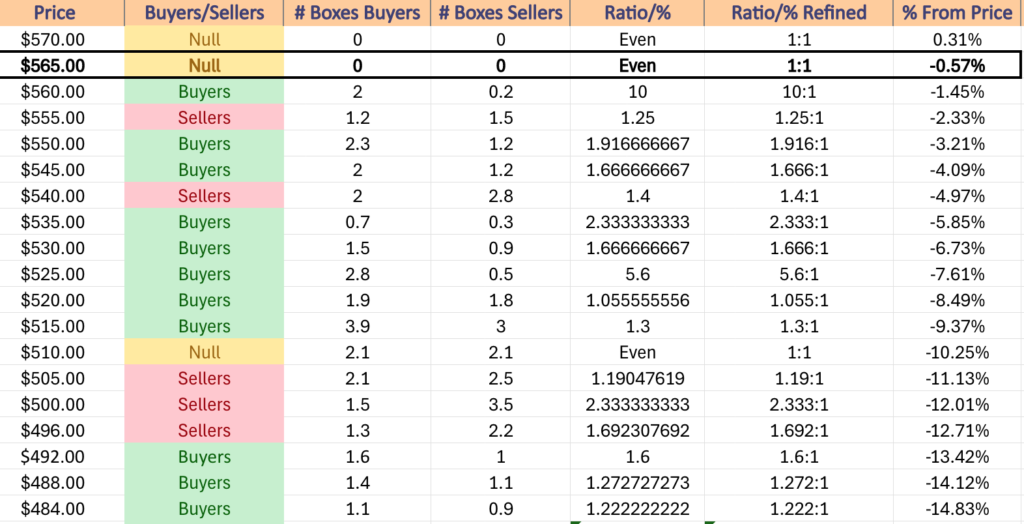
In the event that this happens, it will be interesting to see where support is found, as while the $560-565 price zone is 10:1 Buyers:Sellers historically, it is still relatively untested, given that it is home to the recent resistance level that was not broken through until Thursday of last week.
There is -1.77% difference between the current price of SPY & their 10 day moving average, with an additional -1.66% difference between the 10 & 50 DMAs for support, which if the support zone mentioned above breaks down will likely see a test given that the $555-559.99 price window is seller dominated 1.25:1.
Based on the weakness/uncertainty of the past two sessions it is uncertain as to how much higher SPY can climb in the event of positive news, as market participants look to be on edge at these current price levels & after the past few months.
SPY has support at the $563.43 (Volume Sentiment: Buyers, 10:1), $562.48 (Volume Sentiment: Buyers, 10:1), $558.19 (10 Day Moving Average, Volume Sentiment: Sellers, 1.25:1) & $553.17/share (Volume Sentiment: Buyers, 1.92:1) price levels, with resistance at the $571.13/share (All-Time High, Volume Sentiment: NULL, 0:0*) price levels.
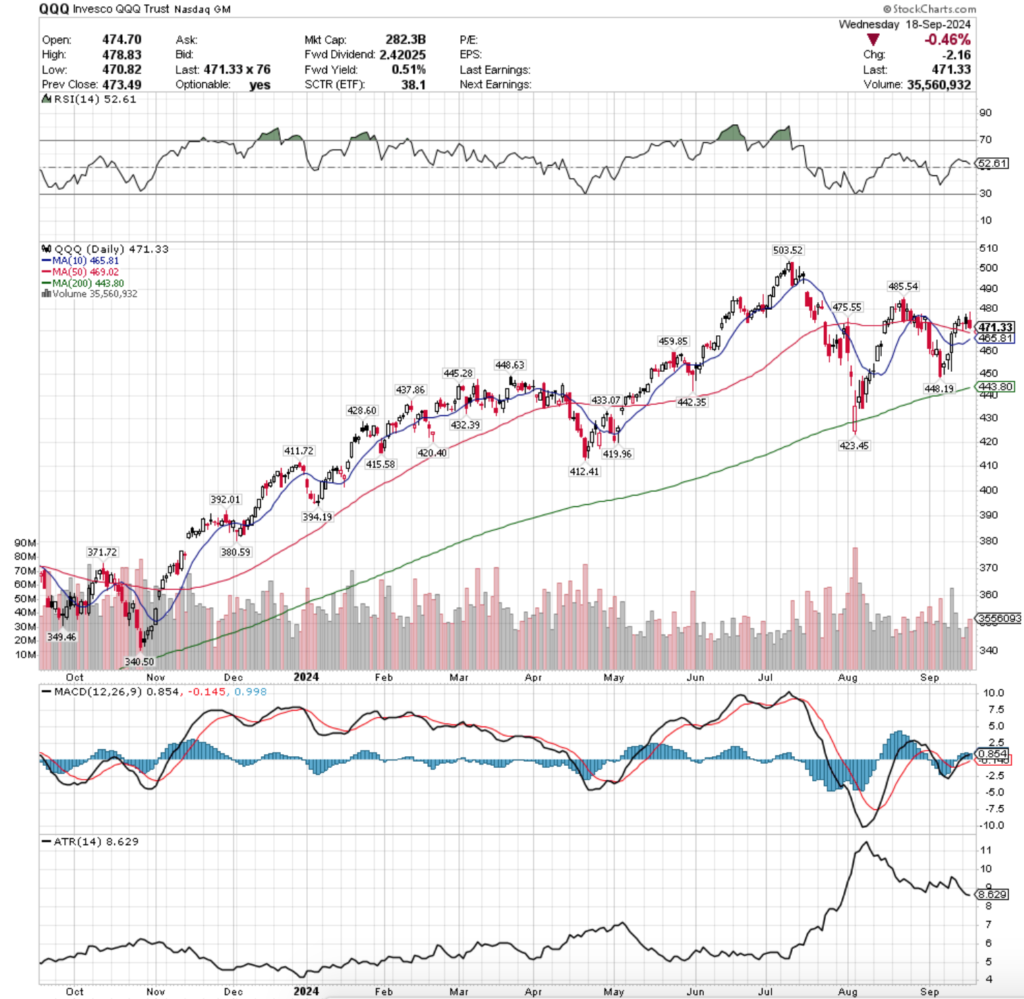
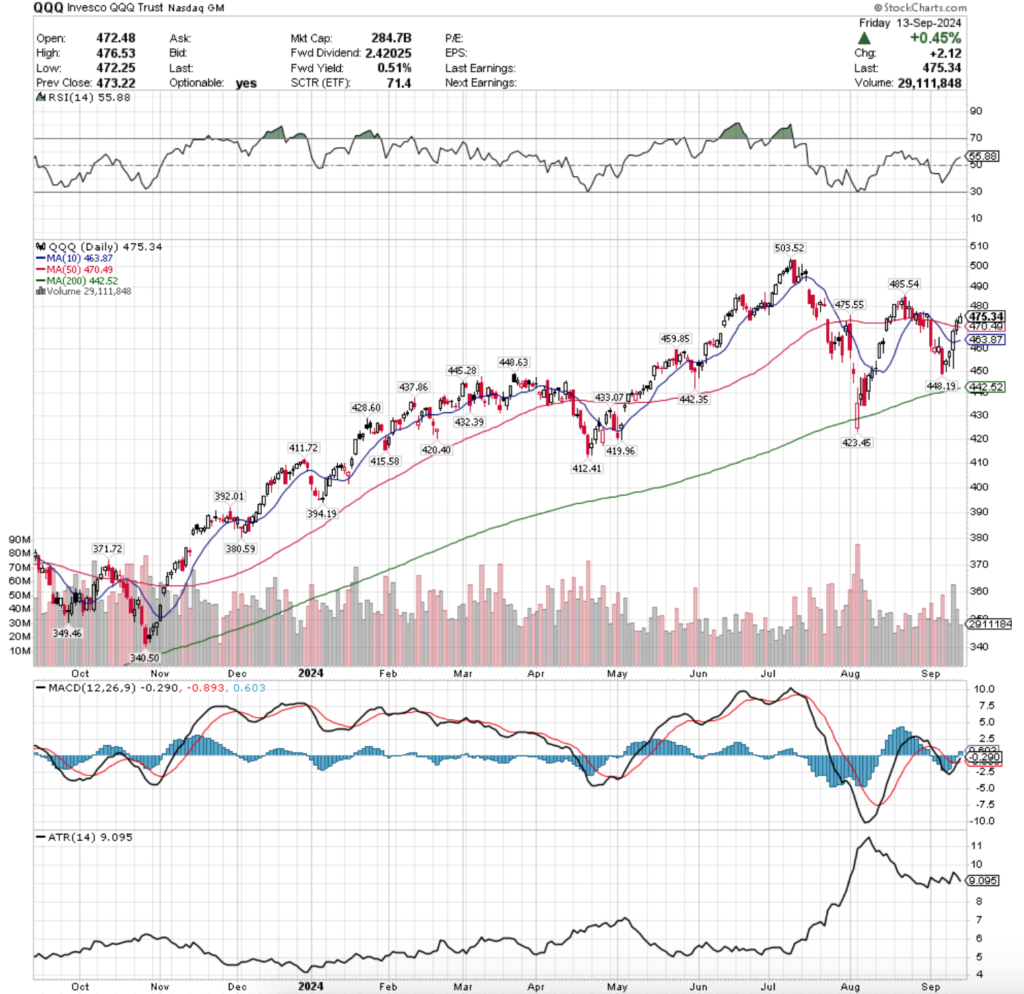
QQQ, the Invesco QQQ Trust ETF that tracks the NASDAQ 100 added +1.49% last week in a week that looked similar to SPY’s.
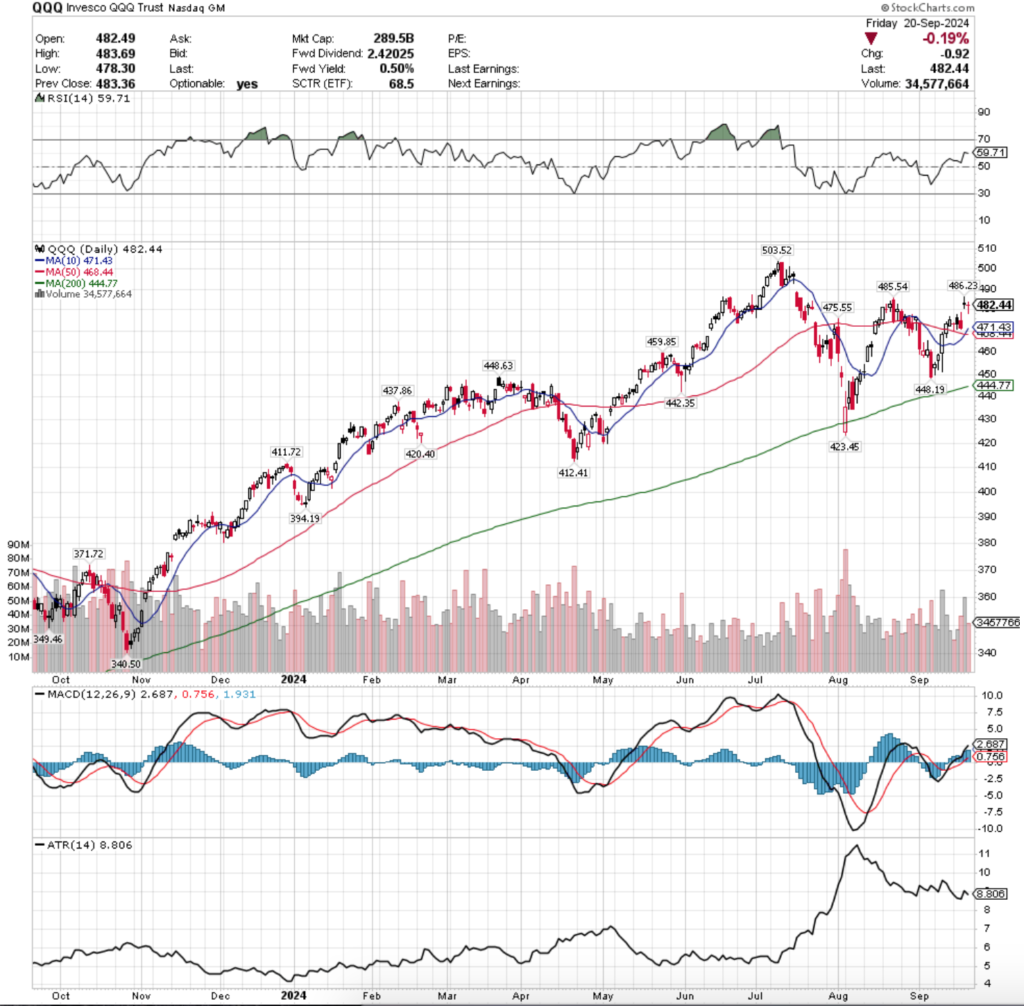
Their RSI is currently at 59.71 & is also curling over bearishly after Friday’s session, while their MACD is still bullish.
Volumes were very weak for QQQ, coming in -16.08% below the previous year’s average (35,988,000 vs. 42,884,111), which as has been noted in previous weeks’ posts is particularly low given that volumes as a whole have been lower than average compared to years prior since April 2024.
The support of the 50 day moving average held up for QQQ on Monday, as the session tested down towards it but was able to close as a dragonfly doji, indicating uncertainty among market participants, but the open & close were concentrated near the top of the day’s range on the lowest volume of the week.
Tuesday this theme continued, as the day opened on a gap up but ultimately closed lower than it opened on the second lowest volume of the week.
Tuesday’s lower shadow indicated that there was some downside appetite, but the bulls were able to push through & it did not go as low as Monday’s lower shadow.
Wednesday opened about midway through Tuesday’s candle’s real body & tested higher before ultimately nosediving to close near the bottom of Tuesday’s lower shadow, but still well above the support of the 50 DMA.
Much like SPY, QQQ enjoyed a gap up open on Thursday, except QQQ’s was on the week’s highest volume.
While the day’s high was able to break above the resistance level of $485.54, there is a lot of uncertainty & doubt in the air as the session ended as a spinning top candle that closed lower than it opened, indicating that there was some bearish sentiment brewing.
Friday this theme continued, as the day opened lower & wound up resulting in a doji candle, indicating uncertainty & risk-off sentiment heading into the weekend.
Something to keep an eye on this week is the 10 & 50 day moving averages which recently just had a bullish crossover, as last month when this happened it only lasted briefly & preceded a decline.
While that is not necessarily going to happen again, the uneasiness of market participants that QQQ’s candles are showing makes it a possibility that shouldn’t be ignored, particularly when you look at their RSI now vs. back in August at the time.
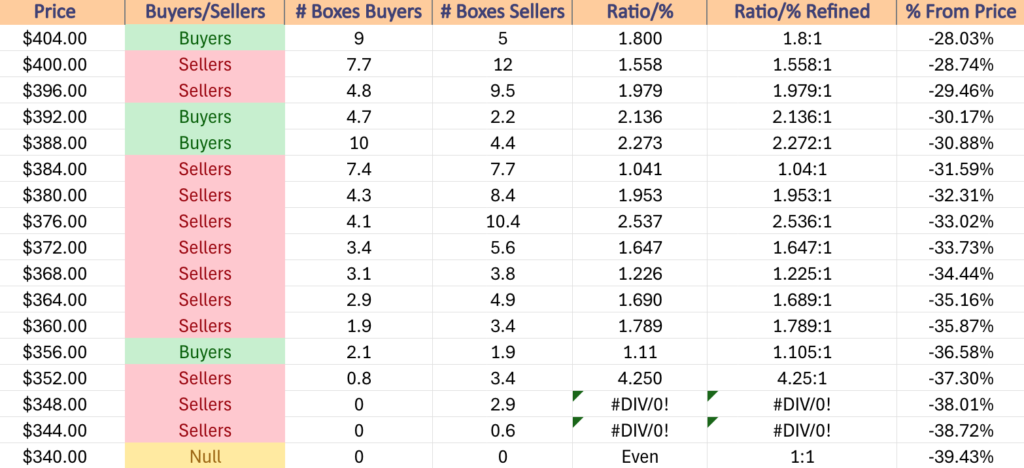
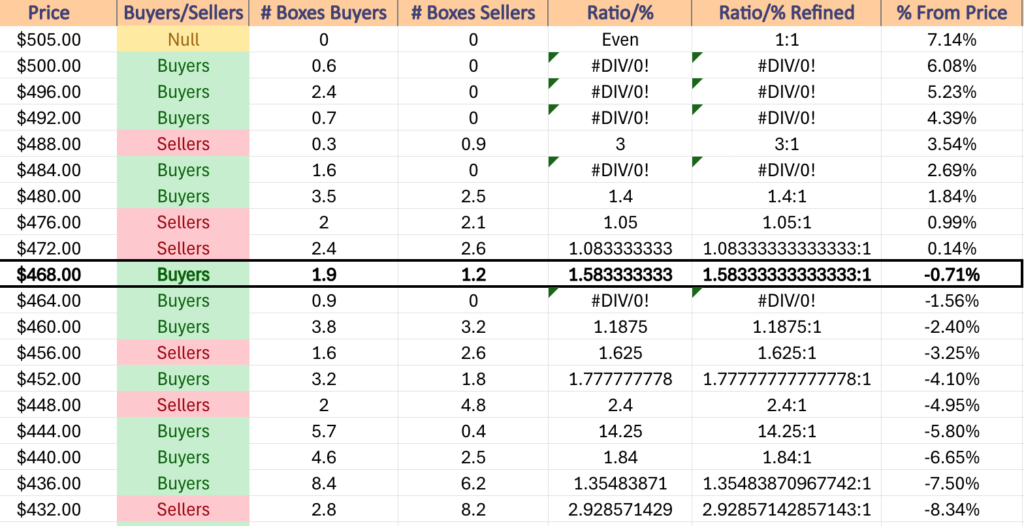
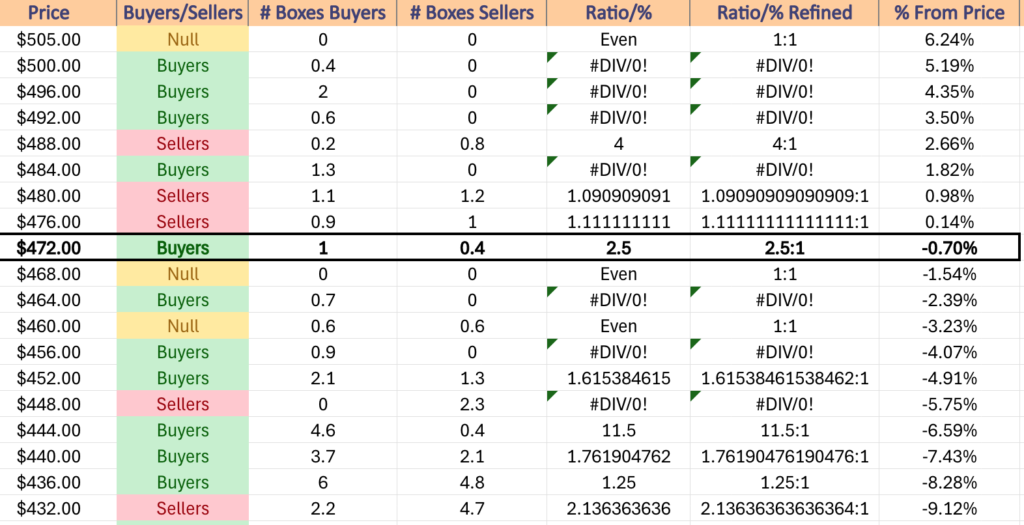
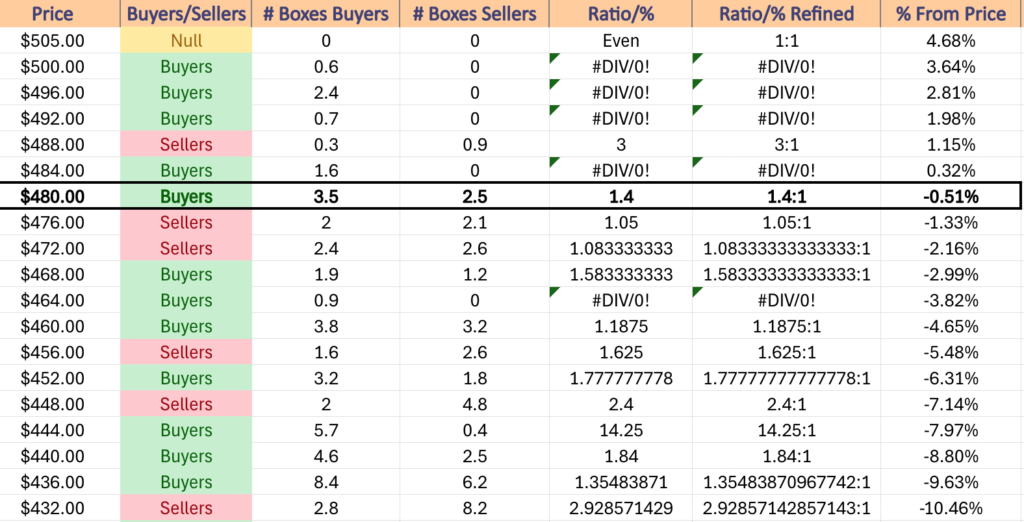
In the event that QQQ declines to begin filling in the window created by Thursday’s gap up session the next two price levels have been dominated by Sellers (1.05:1 & 1.08:1) which makes it likely that the next two support levels will not be able to hold up QQQ’s price, leading to a test of the support of the 50 day moving average.
Should that support level not hold up there isn’t another for another -1.83% at the $459.85, which also happens to be in a seller dominated price zone (1.63:1).
The upside price levels of $485.54 & $486.23 should be watched for in the event of an advance as they will be the nearest resistance levels for QQQ.
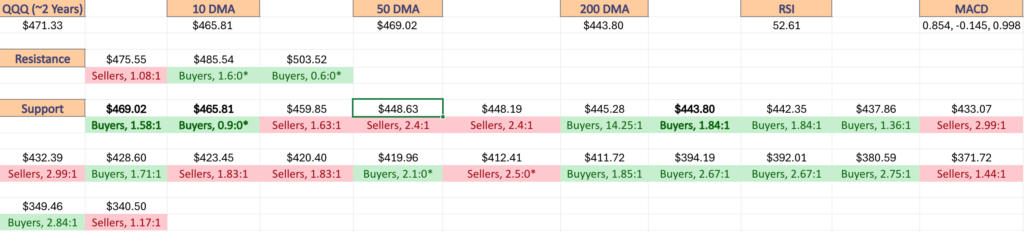
QQQ has support at the $475.55 (Volume Sentiment: Sellers, 1.08:1), $471.43 (10 Day Moving Average, Volume Sentiment: Buyers, 1.58:1), $468.44 (50 Day Moving Average, Volume Sentiment: Buyers, 1.58:1) & $459.85/share (Volume Sentiment: Sellers, 1.63:1) price levels, with resistance at the $485.54 (Volume Sentiment: Buyers, 1.6:0*), $486.23 (Volume Sentiment: Buyers, 1.6:0*) & $503.52/share (All-Time High, Volume Sentiment: Buyers, 0.6:0*) price levels.
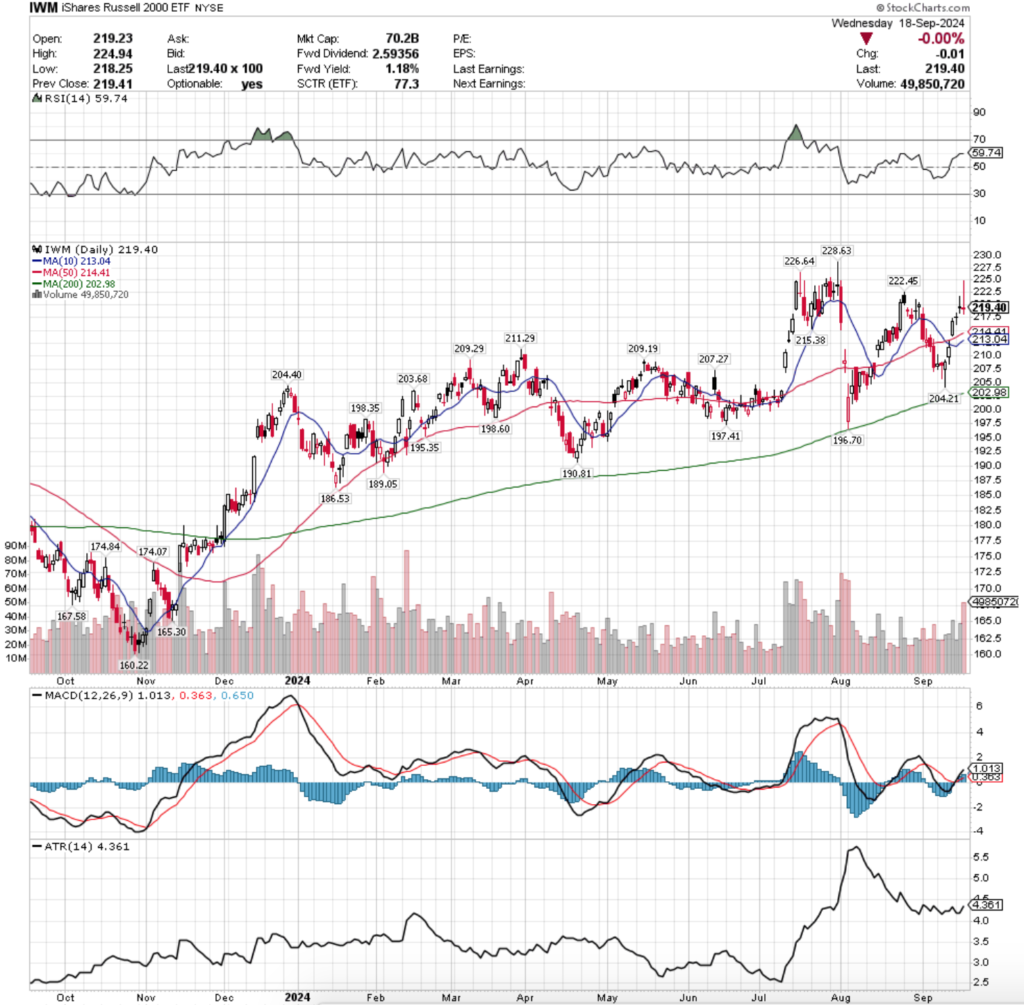
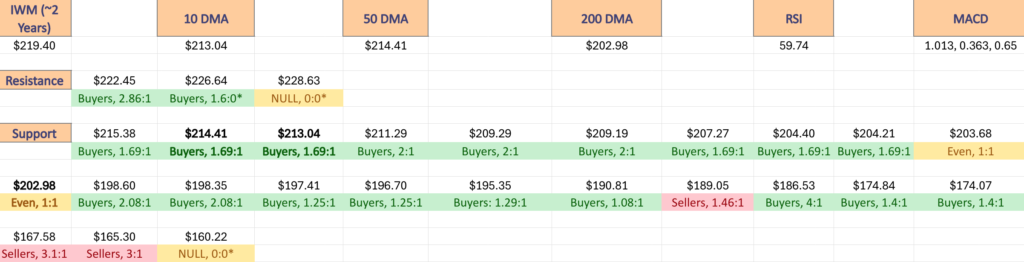
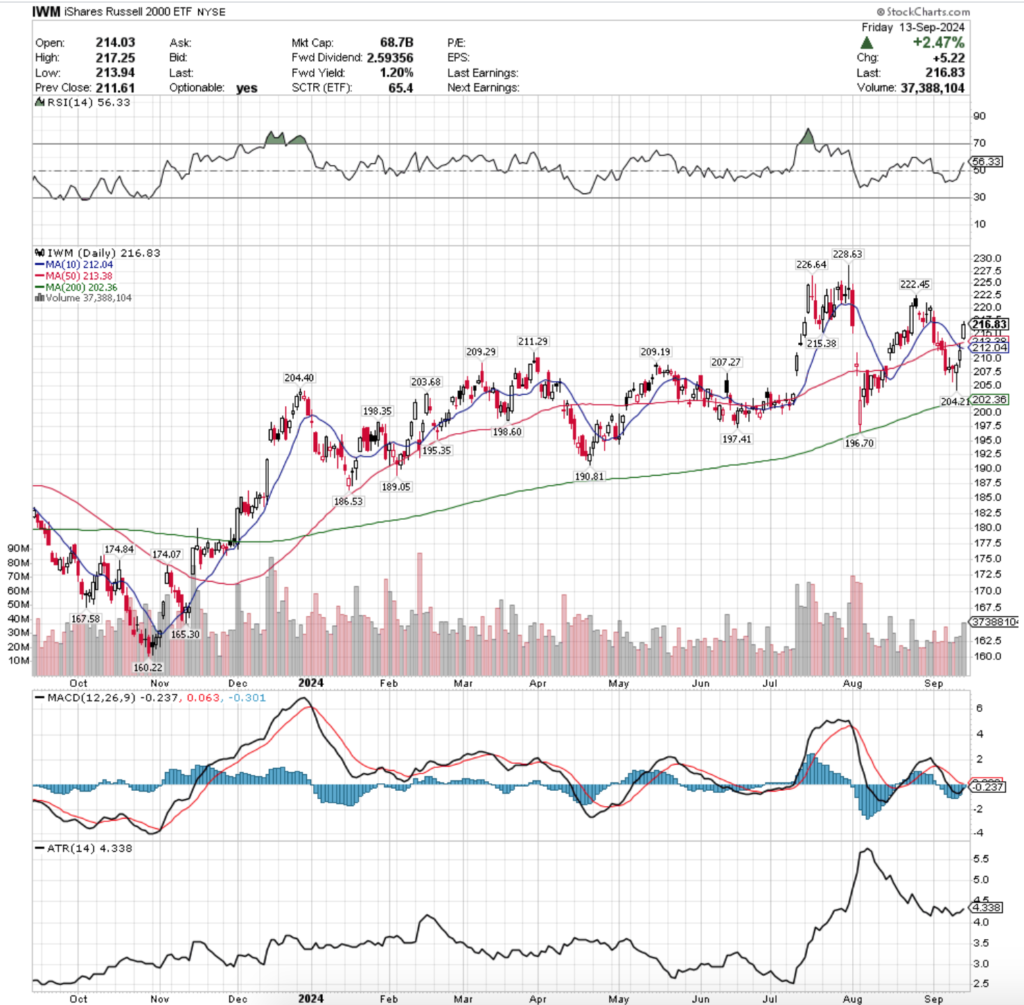
IWM, the iShares Russell 2000 ETF had the strongest week of the major four index ETFs, advancing +2.19% for the week.
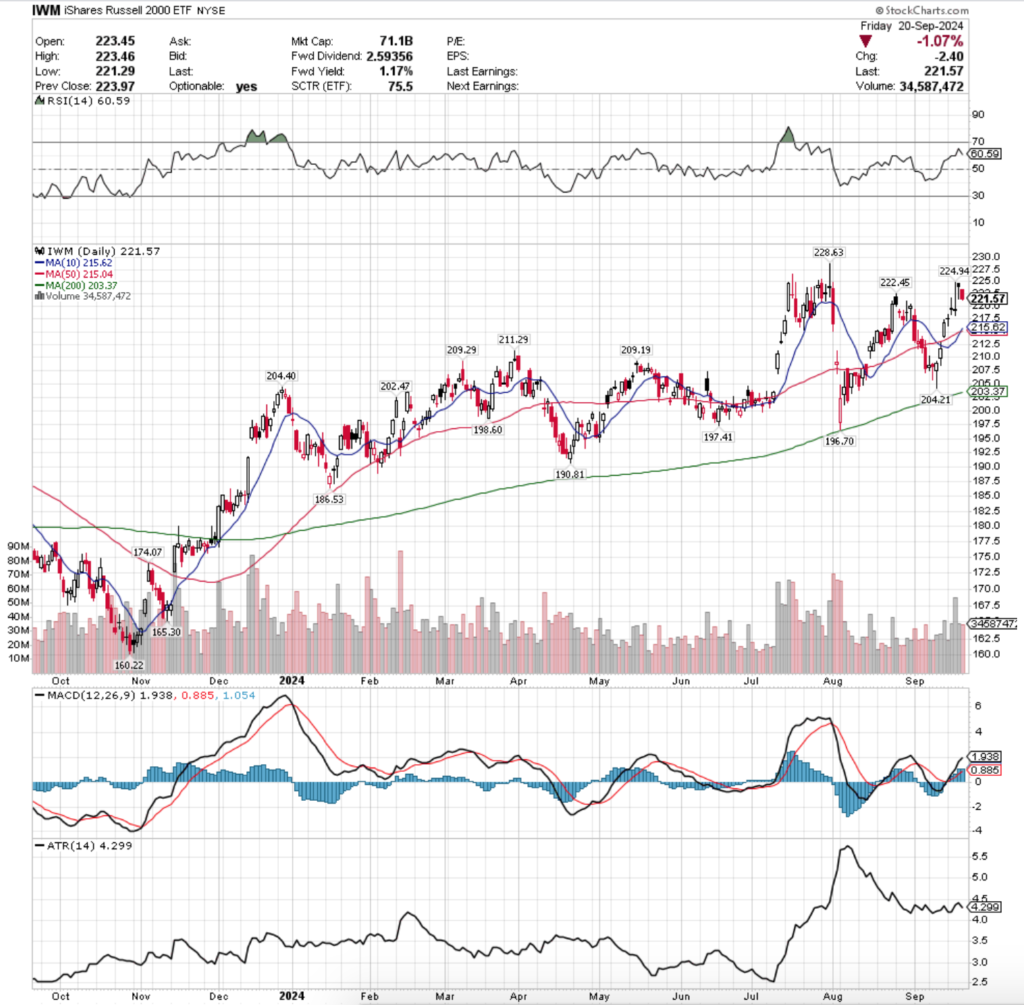
Their RSI is at 63.7 & has flattened out after Friday’s session, while their MACD is still bullish.
However, much like SPY, IWM’s Thursday session’s gap up contributed greatly to their MACD’s continued bullishness, but the session closed lower than it opened on that day, indicating bearishness & uncertainty/a lack of confidence given it resulted in a doji candle.
Volumes were +3.17% above the previous year’s average (36,580,000 vs. 35,454,783), bucking the continued below average volume trend of SPY, QQQ & DIA.
IWM’s week looks a lot different than that of SPY & QQQ, but still is riddled with uncertainty.
Monday kicked the week off with a gap up session that resulted in a doji candle on the week’s lowest volume, indicating that there was a great deal of uncertainty in the market.
Tuesday this theme continued, as IWM gapped up again, only to close as a doji, but this time closer to the lower end of the day’s range (but not as a gravestone doji).
Wednesday saw the highest volumes of the week, as well as the highest price level of the week, but the session closed as a doji near in line with Tuesday’s candle’s real body.
While IWM was able to test much higher based on the day’s upper shadow, the bulls were unable to hang on & or all bailed to take profits during the day forcing the close to be on the low end of the day’s candle.
Thursday managed to open higher near the high end of Wednesday’s upper shadow, but ultimately saw a lot of selling action that forced the day’s low end of the range to test almost halfway down the upper shadow of Wednesday’s candle before settling as a hanging man candle that closed lower than it opened.
Friday confirmed this bearish sentiment as the session opened on a gap down & continued lower throughout the day on volume that was average for the week, echoing the risk-off sentiment of SPY & QQQ & closing below the support level of $222.45.
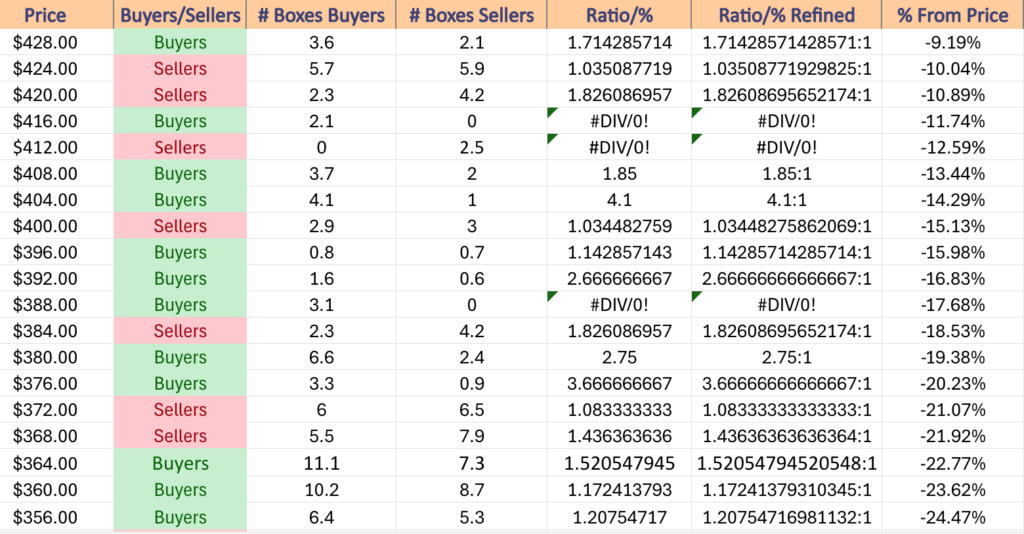
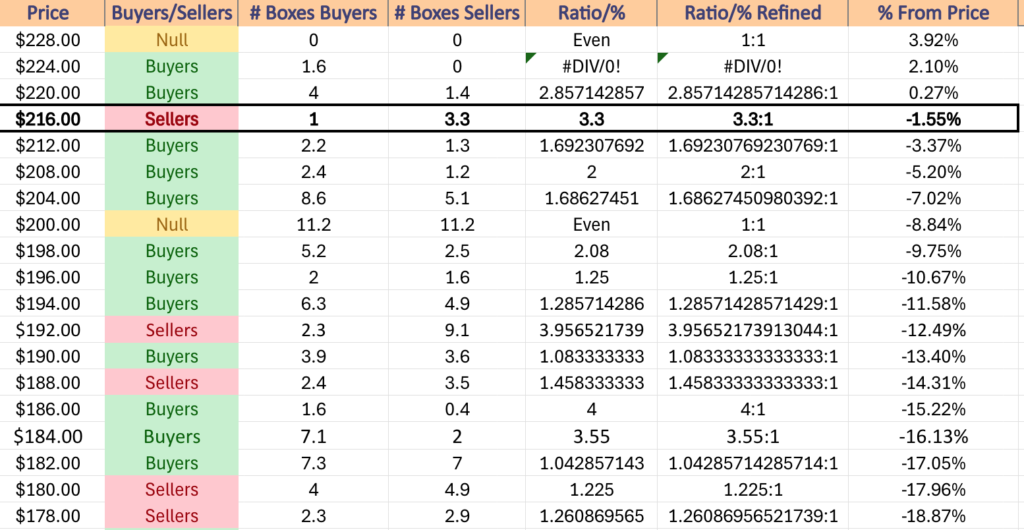
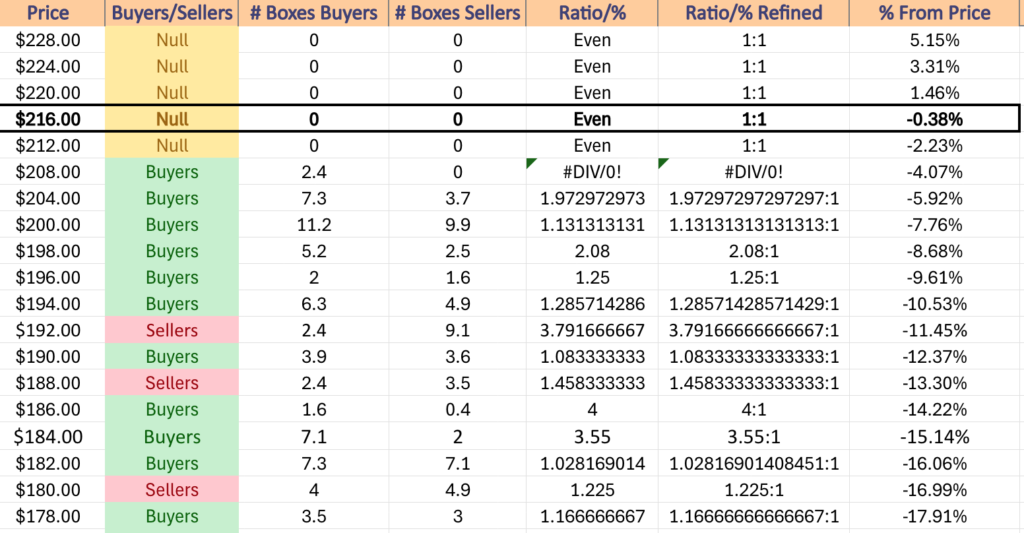
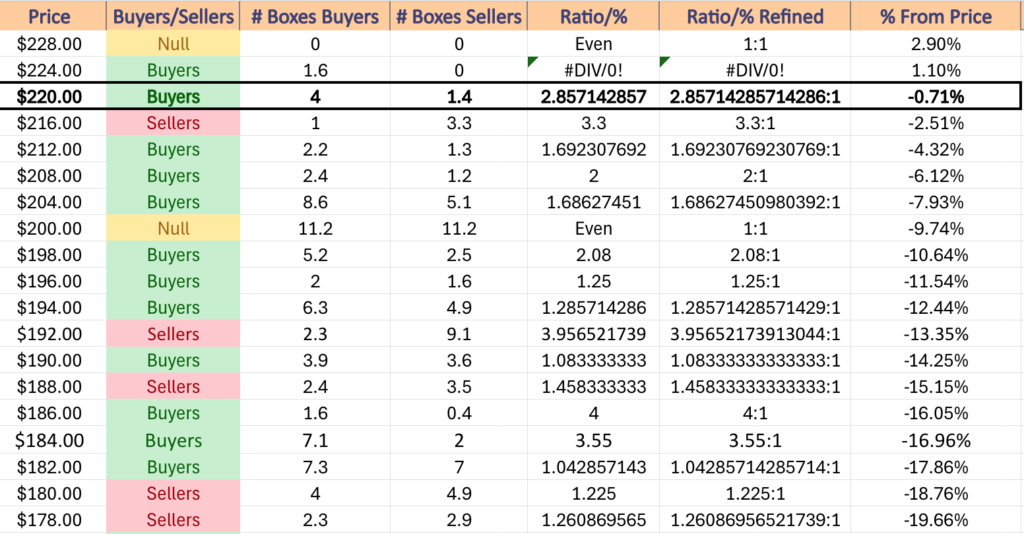
Friday’s close sets IWM up to enter a Seller dominated price zone if they decline down to the $219.99 price level, where until $216 the Sellers have been the dominant force at a rate of 3.3:1.
This is important to note as the next support level is currently the 10 day moving average, which happens to be below $216 & sits just atop the 50 DMA’s support after recently crossing it bullishly.
Like noted above, watching the angle that those moving averages move at in the coming week(s) will lend clues to where price direction is headed, but the current sentiment remains cautious.
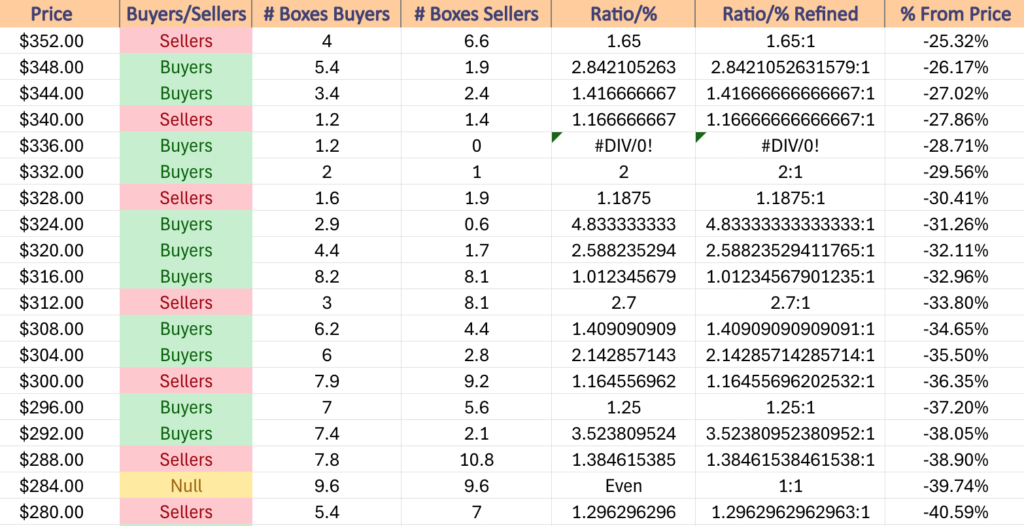
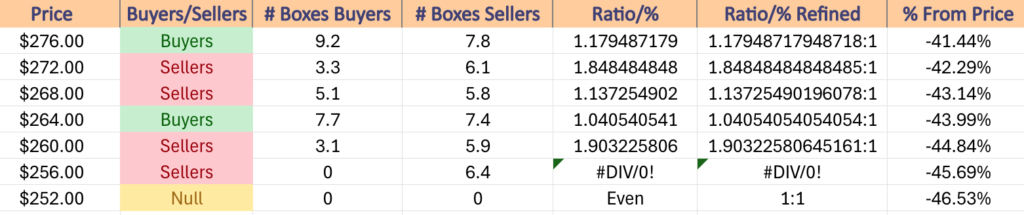
As has been noted in previous months’ posts, the consolidation ranges that IWM has spent much of December 2023 until July of 2024 in contain multiple support zones, but given that their 200 day moving average has advanced as high as it has to the midway point of this range it will be interesting to see what happens in the event of a decline.
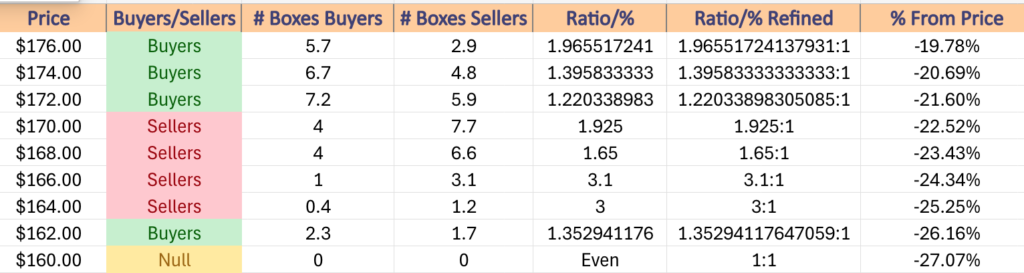
Should we see a significant decline that breaks down through the 200 DMA it will undermine the strength of sentiment at the other local support levels, which could see the $190.81/share support level
IWM has support at the $215.62 (10 Day Moving Average, Volume Sentiment: Buyers, 1.69:1), $215.04 (50 Day Moving Average, Volume Sentiment: Buyers, 1.69:1), $211.29 (Volume Sentiment: Buyers, 2:1) & $209.29/share (Volume Sentiment: Buyers 2:1) price levels, with resistance at the $222.45 (Volume Sentiment: Buyers, 2.86:1), $224.94 (Volume Sentiment: Buyers, 1.6:0*) & $228.63/share (52-Week High, Volume Sentiment: NULL, 0:0*) price levels.
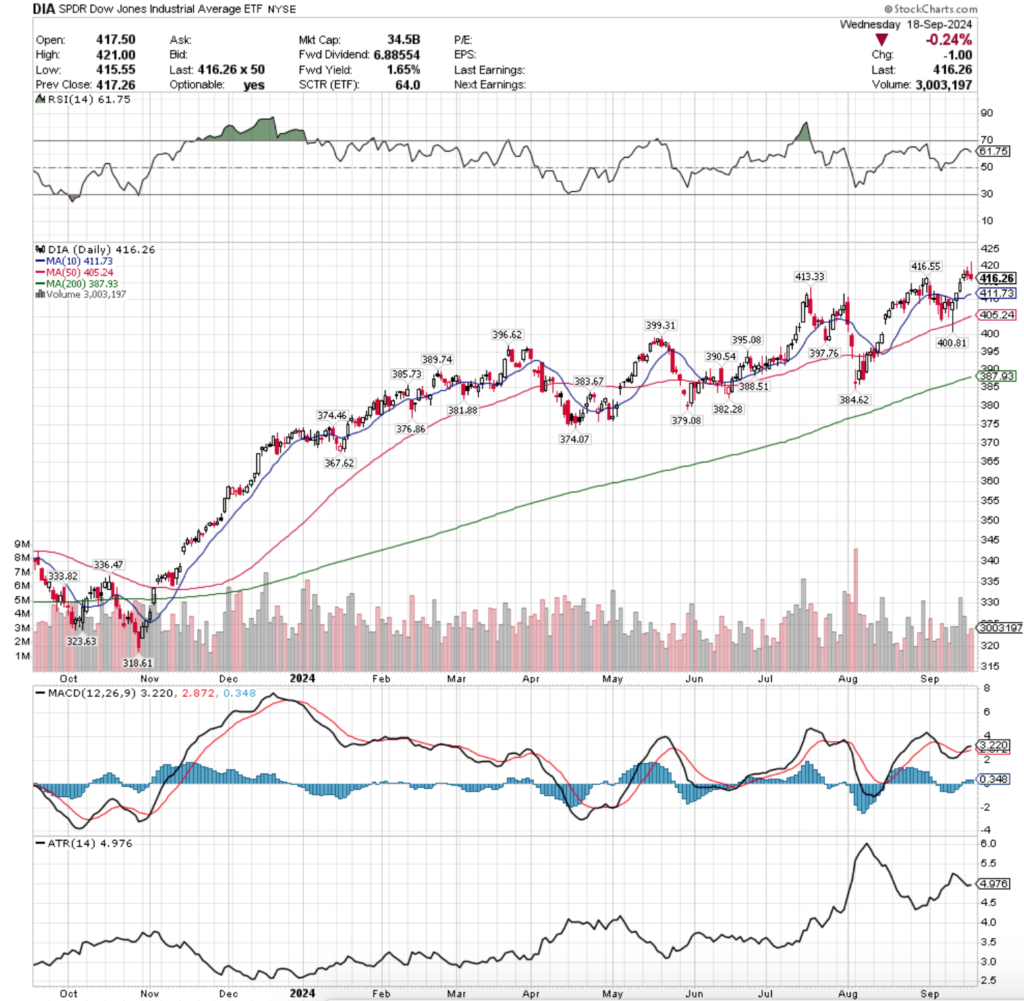
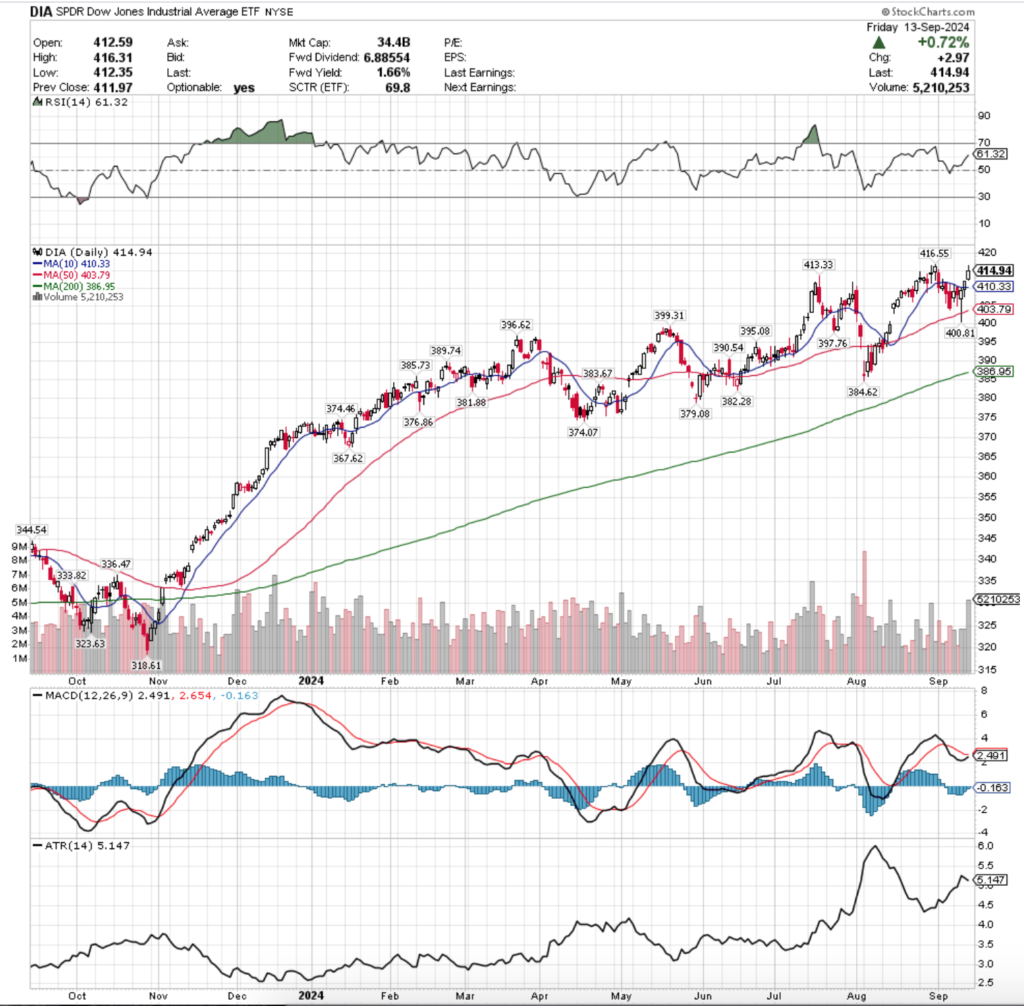
DIA, the SPDR Dow Jones Industrial Average ETF climbed +1.36% for the week, mostly on account of Thursday’s gap up session.
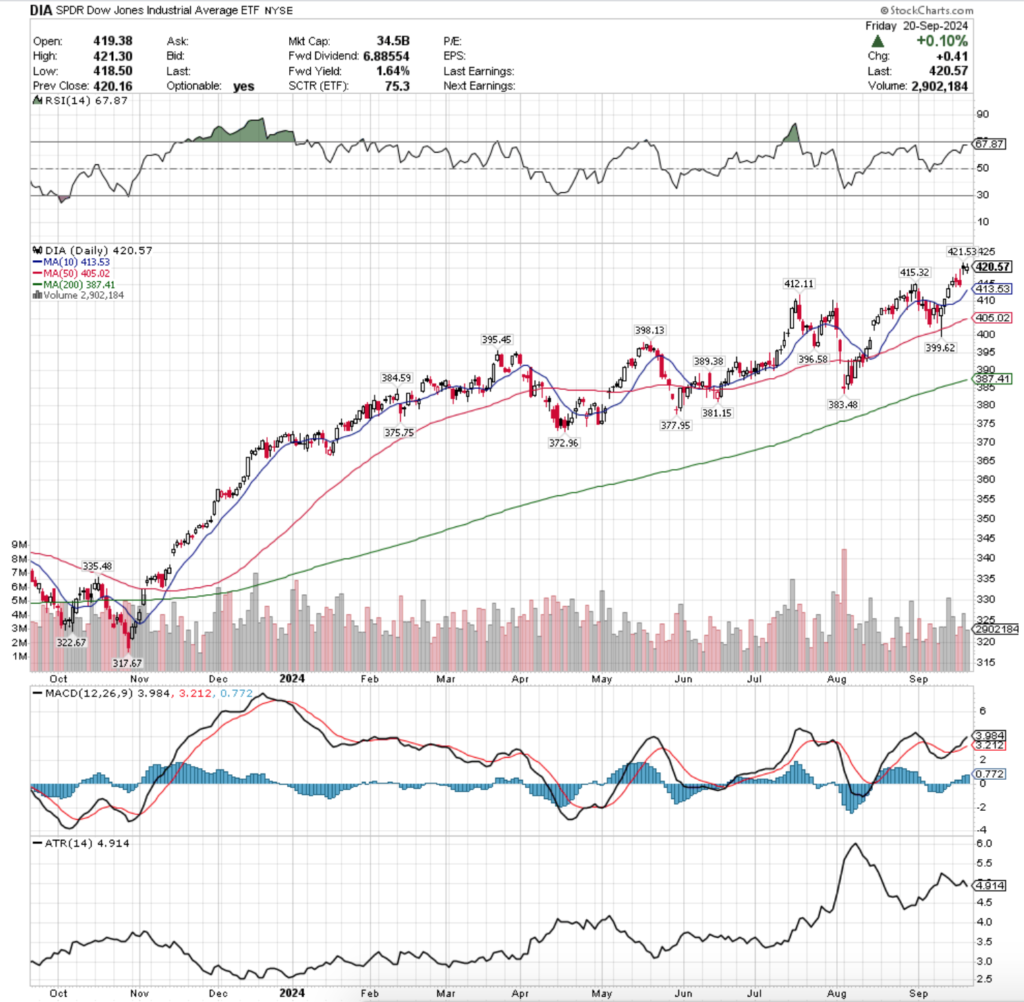
Their RSI is approaching overbought levels & has flattened out at 67.87, while their MACD continues on bullishly.
DIA’s MACD continuing higher can be attributed to Thursday’s gap up session, but like SPY & IWM they closed Thursday’s session lower than where it opened on a spinning top candle, indicating uncertainty with a touch of bearishness.
Volumes were -7.22% below the previous year’s average (3,316,000 vs. 3,574,071), which is not s sign of strength given that three of their five sessions last week resulted in advances.
Monday kicked DIA’s week off on an uncertain note, as the day resulted in a spinning top & set up the next two day’s consolidation range.
Tuesday the uncertainty continued, as a low volume declining session also resulted in a spinning top as investors awaited the FOMC announcement on Wednesday afternoon.
Wednesday set up the end of the week’s new all-time high as prices rallied during the day, but ultimately closed lower for the day as investors were eager to take profits off of the table.
Thursday opened to a gap up, but the uncertainty & uneasiness theme remained in play as the session closed lower than it opened & closed as a hanging man candle, which is a sign of bearishness.
Thursday saw the highest volumes of the week as well, which was likely due to profit taking by folks who benefitted from the gap up to the all-time high.
Friday the uncertainty continued, when an average volume session resulted in an advance of +0.1% & closed in a spinning top candle heading into the weekend.
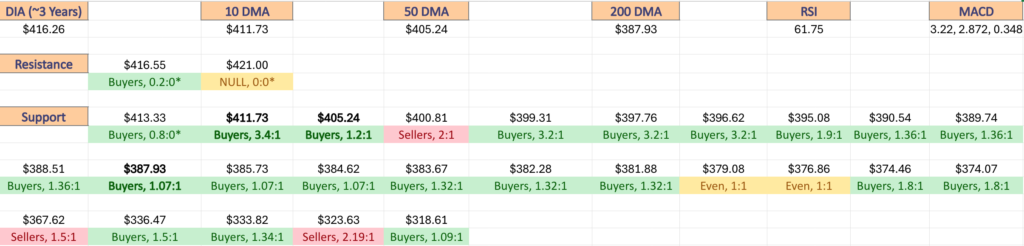
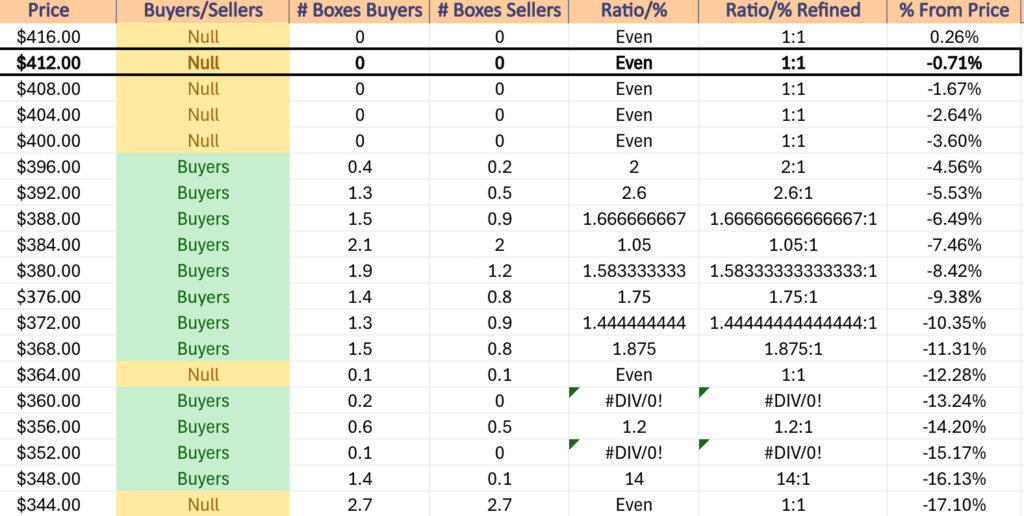
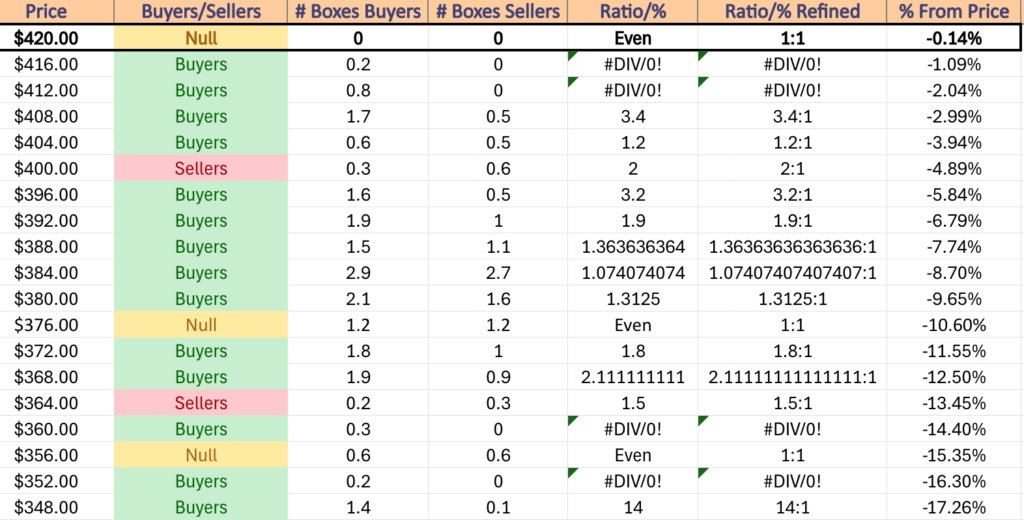
DIA has the most Buyer dominated support levels of the four major index ETFs primarily due to the slow ascent it has taken in the wake of the rapid climb it took in Q4 2023.
This has also benefitted it by creating more support levels along the way than the other index ETFs enjoy, which makes sense as investors have run to blue chip names in recent history.
With that said, there has not been much downside testing against the more recent price levels, as can be seen in the table below where the denominator (Sellers) is 0 for the first few price levels.
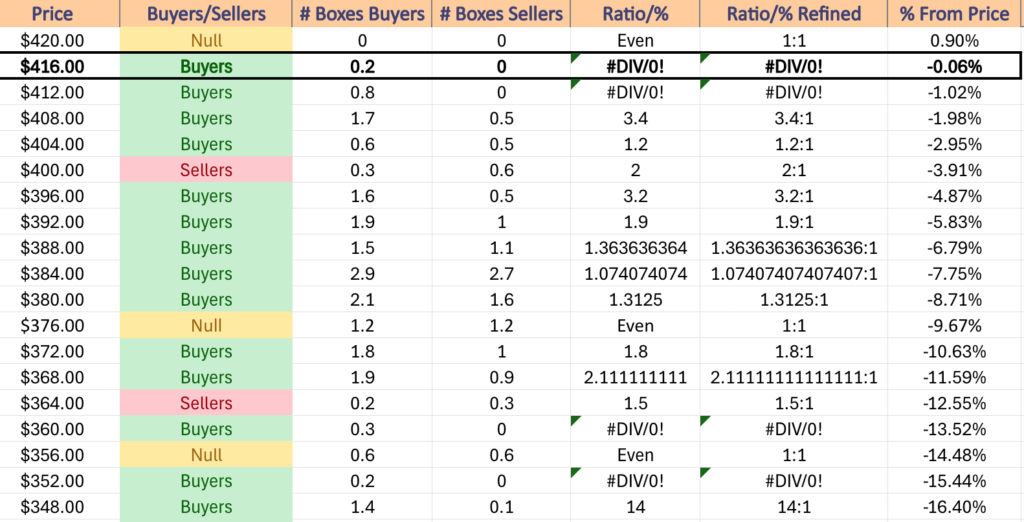
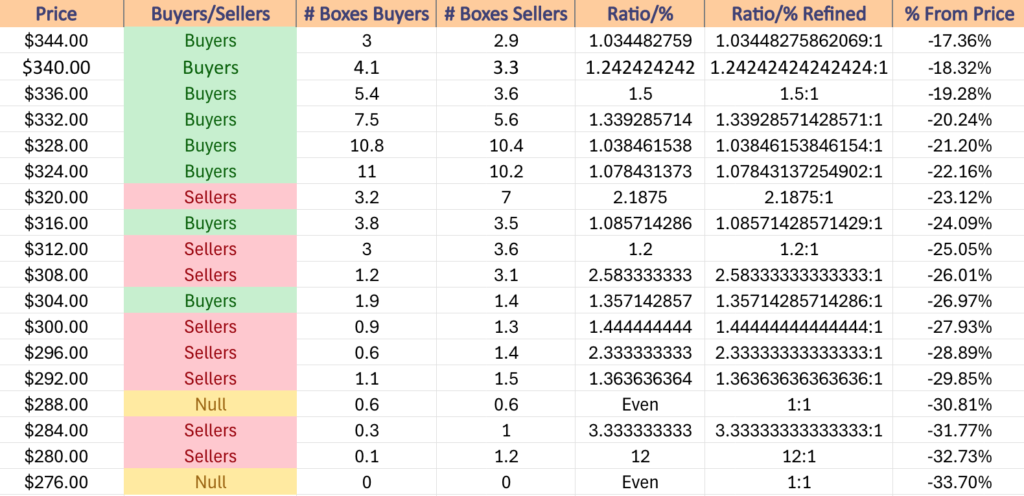
With this in mind, it would be wise to be cautious in the event of a decline for DIA, as there has been limited downside testing above $403.99/share.
While this does not mean that shares will necessarily tank between the current price & $400/share, it is entirely possible that market participants who got in above this level will leave in droves to protect their profits (~5% from $400).
It would also be wise to be cautious if in the coming days a new all-time high is hit but volumes are weak, as that would set up a prime time for a price reversal, especially with DIA’s RSI nearing the overbought level.
DIA has support at the $415.32 (Volume Sentiment: Buyers, 0.8:0*), $413.53 (10 Day Moving Average, Volume Sentiment: Buyers, 0.8:0*), $412.11 (Volume Sentiment: Buyers, 0.8:0*) & $412.11/share (Volume Sentiment: Buyers, 0.8:0*) price levels, with resistance at the $421.53/share (All-Time High, Volume Sentiment: NULL, 0:0*) price levels.
The Week Ahead
Monday the week kicks off with Atlanta Fed President Bostic speaking at 8 am, S&P Flash U.S. Services PMI & S&P Flash U.S. Manufacturing PMI data at 9:45 am, Chicago Fed President Gooslbee speaking at 10:15 am& Minneapolis Fed President Kashkari speaking at 1pm.
AAR Corp reports earnings after Monday’s closing bell.
Fed Reserve Governor Bowman speaks at 9 am Tuesday, with the S&P Case-Schiller Home Price Index data coming out at 9 as well, followed by Consumer Confidence data at 10 am.
Tuesday morning’s earnings reports include AutoZone & Thor Industries, with KB Home, Progress Software, Stitch Fix & Worthington Enterprises scheduled to report after the session’s close.
Wednesday brings us New Home Sales data at 10 am & at 4pm Fed Governor Kugler speaks.
Cintas reports earnings Wednesday morning before the opening bell, followed by Micron Technology, Concentrix, H.B. Fuller, Jefferies & Worthington Steel after the session’s close.
Initial Jobless Claims, Durable-Goods Orders, Durable-Goods minus Transportation & GDP (second revision) data come out Thursday morning at 8:30 am, followed by Fed Governor Kugler & Boston Fed President Collins speaking together at 9:10 am, Fed Governor Bowman speaking at 9:15 am, Fed Chair Powell delivering opening remarks at 9:20 am & Fed President Williams speaking at 9:25 am.
In a busy morning Pending Home Sales data is released Thursday at 10 am, Fed Vice Chair for Supervision Barr speaks at 10:30 am, as does Fed Governor Cook & at 1pm Fed President Kashkari & Chair for Supervision Barr speak together at 1 pm.
Accenture, CarMax, Jabil & TD Synnex are all schedule to report earnings on Thursday morning before the session opens, with Costco Wholesale, BlackBerry & Vail Resorts due to report earnings after the closing bell.
Friday brings another busy day on the data front, with Personal Income, Personal Spending, PCE Index, PCE Year-over-year, Core PCE Index, Core PCE Year-over-Year, Advanced U.S. Trade Balance in Goods, Advanced Wholesale Inventories & Advanced Retail Inventories data due out at 8:30 am, followed by Consumer Sentiment (final) at 10 am & Fed Governor Bowman speaking at 1:15 pm.
There are no major earnings reports due out on Friday.
See you back here next week!
*** I DO NOT OWN SHARES OR OPTIONS CONTRACT POSITIONS IN SPY, QQQ, IWM OR DIA AT THE TIME OF PUBLISHING THIS ARTICLE ***