NRG Energy Inc. NRG Stock Analysis

NRG Energy Inc. stock trades under the ticker NRG & has shown recent bullishness that traders & investors may be interested in a taking a closer look at.

NRG stock is currently $37.69 as I write this on 3/9/2022.

NRG Energy Inc. NRG Stock’s Technicals Broken Down

NRG Energy Inc. NRG Stock's Technical Performance Over The Last Year

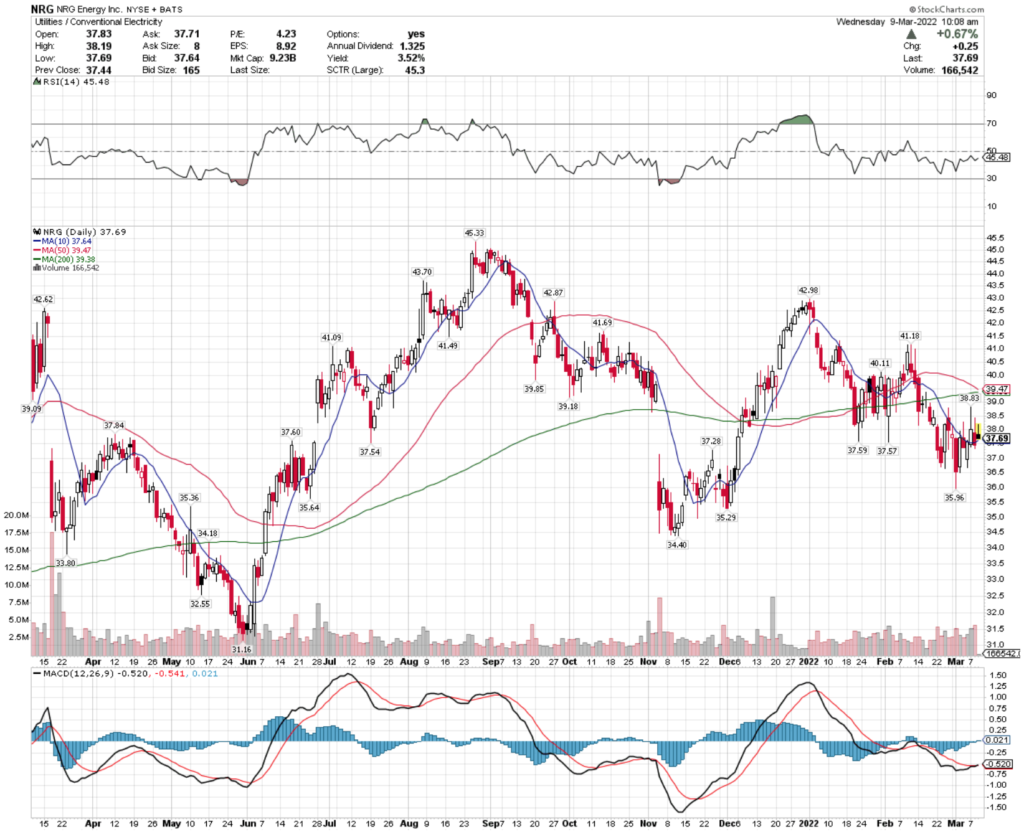
NRG Stock Price: $37.69

10 Day Moving Average: $37.64

50 Day Moving Average: $39.47

200 Day Moving Average: $39.38

RSI: 45.48

MACD: -0.524

Yesterday, NRG stock completed a bullish MACD crossover, while breaking out above its 10 Day Moving Average bullishly today.

They have traded on slightly above average volume in 2022 compared to the year prior, but will have to pass a test of their 50 Day Moving Average bearishly approaching their 200 Day MA (should happen in the next day or two).

How that impacts their near term prices will dictate their near-term price movement, but with an RSI that is already below neutral, there looks to be opportunity for their price to continue higher.

I will be watching their price as it approaches $38.50, as it has only traded above that level twice in the last month or so.

NRG Energy Inc. NRG Stock As A Long-Term Investment

Investors focused on the long-term will like NRG stock’s P/E (ttm) at 4.23, but may find their P/B (mrq) of 2.54 to be a bit rich.

Their recent Quarterly Revenue Growth Y-o-Y was 247.6%.

NRG stock’s balance sheet will need a closer review, with Total Cash (mrq) of $250M, with Total Debt (mrq) of $8.29B.

Moody’s rates NRG Energy Inc.’s debt Ba1, which is the top rating given to speculative, or “junk” debt.

NRG stock’s dividend is 3.54%, which looks fairly safe as their payout ratio is 14.6%.

Despite their speculative debt rating, NRG stock is primarily held by institutional investors.

NRG Energy Inc. NRG Stock As A Short-Term Trade Using Options

Traders interested in the short-term horizon can trade options to take advantage of NRG stock’s price movements.

I am looking at the contracts with the 3/18 expiration date.

The $36 & $37 call options look appealing, but have low open interest.

The $39 & $40 puts also look appealing, and are more liquid than the calls I mentioned above, showing that in the near-term traders see this stock staying below $39.

Tying It All Together

NRG stock has many appealing characteristics to investors, such as their dividend, their valuation metrics & their institutional ownership.

However, their debt will require a closer examination.

Traders will like their current momentum, although they may not like how liquid their options are.

While their open interest levels suggest that most traders see the stock staying below $39 for the next 9 days, NRG stock still has bullish momentum in the near-term.

Overall, it is worth taking a closer look into NRG stock.

*** I DO NOT OWN SHARES OF NRG STOCK ***

Capital Product Partners LP CPLP Stock

Capital Product Partners L.P. stock trades under the ticker CPLP & has shown recent bullishness that traders & investors may want to take a closer look into during this volatile time.

CPLP is trading at $15.57/share at the time of writing this on 3/9/2022.

Capital Product Partners L.P. CPLP Stock’s Technicals Broken Down

Capital Product Partners L.P. CPLP Stock's Technical Performance Over The Last Year

CPLP Stock Price: $15.57

10 Day Moving Average: $15.13

50 Day Moving Average: $15.56

200 Day Moving Average: $13.66

RSI: 53.6

MACD: -0.137

Yesterday, CPLP stock completed a bullish MACD crossover, and today has broken out bullishly above its 50 Day Moving Average.

With 3% between their 10 & 50 Day Moving Averages, there looks to be more bullish momentum behind their price movement in the coming days.

CPLP’s RSI is also neutral, which signals that there is more room to climb in the near-term, and their recent trading volumes have been relatively average when compared to the year prior.

They will have to test the $15.72 level before the $15.97/share resistance level in the coming days.

Capital Product Partners L.P. CPLP Stock As A Long-Term Investment

Long-term oriented investors will find CPLP’s valuation metrics appealing, with a P/E (ttm) of 2.99 & a P/B (mrq) of 0.57.

CPLP stock has 81% Quarterly Revenue Growth Y-o-Y, with 450.9% Quarterly Earnings Growth Y-o-Y based on their last earnings report.

Their balance sheet is concerning though, with Total Cash (mrq) of $20.37M & Total Debt (mrq) of $1.31B, and their most recently withdrawn credit ratings from Moody’s were Highly Speculative, although improving.

CPLP stock pays a 2.94% dividend, which looks very safe given their 7.8% payout ratio.

Despite their yield, only 21.9% of their outstanding share float is held by institutional investors, likely because of their debt situation noted above.

Capital Product Partners L.P. CPLP Stock As A Short-Term Trade Using Options

Short-term oriented traders can trade options to take advantage of CPLP stock’s current momentum, while fending off broader market volatility.

I am looking at the contracts with the 3/18 expiration date.

The $12.50 & $15 calls look appealing, although both have open interest <1,000 contracts, which some traders may consider too illiquid.

The $17.50 & $20 puts also look interesting, but are even less liquid than the calls, signaling market sentiment is bullish on CPLP in the near-term.

Tying It All Together

Overall, CPLP stock has many interesting characteristics that traders & investors will like.

Investors will like their dividend yield & valuation metrics, but must be cautious about their debt situation.

Traders will like their momentum in the near-term, but may dislike how illiquid their options are.

CPLP stock is worth taking a closer look into, regardless of your trading style.

*** I DO NOT OWN SHARES OF CPLP ***

Church & Dwight Co. Inc. CHD Stock

Church & Dwight Co., Inc. stock trades under the ticker CHD & has shown recent bullish behavior that traders & investors should take a closer look into.

CHD closed at $99.20/share on 3/3/2022.

Church & Dwight Co. Inc. CHD Stock’s Technicals Broken Down

Church & Dwight Co. Inc. CHD Stock's Technical Performance Over The Last Year

CHD Stock Price: $99.20

10 Day Moving Average: $97.34

50 Day Moving Average: $100.21

200 Day Moving Average: $89.58

RSI: 52.2

MACD: -0.727

Earlier today CHD stock completed a bullish MACD crossover, on slightly above average trading volume compared to the year prior.

It also broke out above its 10 day moving average, which leaves it 1% away from its 50 day moving average.

CHD will need to break through the $100.27 price level, before testing the $101.43/share resistance level.

Church & Dwight Co. Inc. CHD Stock As A Long-Term Investment

Long-term oriented investors will find CHD stock’s P/E (ttm) acceptable at 29.73, but will likely balk at their 7.41 P/B (mrq).

They recently had 5.7% Quarterly Revenue Growth Y-o-Y, with 5.3% Quarterly Earnings Growth Y-o-Y.

CHD stock’s balance sheet will require a closer examination, with Total Cash (mrq) of $240.6M, being eclipsed by their Total Debt (mrq) of $2.78B.

However, Moody’s has CHD stock’s credit rating at A3, which is considered upper medium grade.

CHD offers a modest 1.04% dividend yield, which appears to be safe as their payout ratio is 30.4%.

88% of CHD stock’s outstanding share float is owned by institutional investors.

Church & Dwight Co. Inc. CHD Stock As A Short-Term Trade Using Options

CHD stock has options that traders can use in the near-term to profit from their price movements in either direction.

I am looking at the contracts with the 3/18 expiration date.

The $100 & the $95 call options look appealing, although their combined open interest is only ~600 total contracts between both strike prices.

The $105 & $110 puts also look interesting, but they are even less liquid than the calls, signifying that the market still sees CHD stock being bullish in the coming weeks.

Tying It All Together

All-in-all, CHD stock has many characteristics that traders & investors alike will appreciate.

Investors will like their debt rating & dividend safety, but may find their valuation metrics to be a bit high.

Traders will like the current momentum, but balk at their lack of liquidity in the expiration date that I was looking at.

CHD stock is worth taking a closer look at, regardless of your trading style.

*** I DO NOT OWN SHARES OF CHD STOCK ***

Crane Co. CR Stock Analysis

Crane Co. stock trades under the ticker CR & has shown recent bullish momentum that traders & investors of all styles may want to take a closer look at.

CR stock closed at $104.22/share on 3/3/2022.

Crane Co. CR Stock’s Technicals Broken Down

Crane Co. CR Stock's Technical Performance Over The Last Year

CR Stock: $104.22

10 Day Moving Average: $100.92

50 Day Moving Average: $101.80

200 Day Moving Average: $97.22

RSI: 55.95

MACD: -0.024

Earlier today, CR stock completed a bullish MACD crossover, while staying above its 10 & 50 day moving averages that it broke out above the day prior.

They have traded on above average volume in 2022 compared to the year period prior.

With a neutral RSI at ~56, there looks to be a lot more momentum behind CR stock to continue pushing its price higher.

They will need to break out above $105.77, before testing the $106.57 resistance level.

Crane Co. CR Stock As A Long-Term Investment

Long-term focused investors will find CR stock’s P/E (ttm) to be appealing at 15.25, but their P/B (mrq) is a bit rich at 3.25.

They had 12.7% Quarterly Revenue Growth Y-o-Y, with 54% Quarterly Earnings Growth Y-o-Y.

CR stock’s balance sheet will warrant a deeper review, with Total Cash (mrq) of $508.6M & Total Debt (mrq) of $944.2M.

Despite this, their debt rating from Moody’s is Baa2, which is lower medium grade & above junk status.

CR stock pays a 1.65% dividend yield, which looks to be very sturdy, with a 25.8% payout ratio.

73.3% of CR stock’s outstanding share float is held by institutional investors.

Crane Co. CR Stock As A Short-Term Trade Using Options

Crane Co. stock has options that traders can use to profit on their price movement up or down in the near-term.

I am looking at the contracts with the 3/18 expiration date.

The $95, $100 & $105 call options all look interesting, although they do lack a bit in open interest.

There is no liquidity currently in any of the puts that are above $105 strike price, making that the highest reasonable strike price as of my writing this.

Tying It All Together

Overall, Crane Co. stock has many interesting attributes that traders & investors will want to look into.

Their valuation looks sturdy, and their dividend yield looks safe.

In the near-term, they have bullish momentum, although their 3/18 options contracts could be a bit more liquid.

CR stock is worth taking a deeper dive into, regardless of your trading strategy.

*** I DO NOT OWN SHARES OF CR STOCK ***

Kadant Inc. KAI Stock Analysis

Kadant Inc. stock trades under the ticker KAI & has shown recent bullishness that traders & investors should take a closer look into.

KAI stock closed at $202.22/share on 3/3/2022.

Kadant Inc. KAI Stock’s Technicals Broken Down

Kadant Inc. KAI Stock's Technical Performance Over The Last Year

KAI Stock Price: $202.22

10 Day Moving Average: $195.31

50 Day Moving Average: $210.62

200 Day Moving Average: $203.34

RSI: 49.44

MACD: -4.52

Today, KAI stock completed a bullish MACD crossover, while breaking out above its 10 day moving average, closing just below their 200 day moving average.

With ~0.5% between their price & the 200 Day MA & a neutral RSI, KAI stock looks set to continue climbing higher on solid momentum.

They have traded at above average volume levels since the beginning of 2022 compared to the year prior.

They will need to break out above $204.50’s resistance level, before testing $209.89.

Kadant Inc. KAI Stock As A Long-Term Investment

Long-term oriented investors will find KAI stock’s P/E (ttm) to be appropriate at 26.4, but they may find their P/B (mrq) to be a bit rich at 3.91.

Their Quarterly Revenue Growth Y-o-Y is 29.7% with 49.7% Quarterly Earnings Growth Y-o-Y.

KAI’s balance sheet will require a more detailed examination, as they have $94.2M in Total Cash (mrq), and Total Debt (mrq) of $269.5M.

They offer a modest 0.51% dividend yield, which appears to be very safe as their payout ratio is only 13%.

97.9% of KAI stock’s total outstanding share float is owned by institutional investors.

Kadant Inc. KAI Stock As A Short-Term Trade Using Options

Traders can use options to take advantage of KAI stock’s current momentum, while also hedging against volatility in the broader markets.

I am looking at the contracts with the 3/18 expiration date.

The $180 & $200 calls are the only ones with open interest, and both are extremely illiquid with under 10 contracts at each strike price.

For puts, only the $200 & $195 strike priced contracts have open interest, with 1 contract per strike price.

Tying It All Together

Overall, KAI stock has many interesting attributes that traders & investors are sure to be interested in learning more about.

They offer a modest, but very secure dividend yield, and have fair valuation metrics, which likely explains the extremely high levels of institutional ownership.

Traders with a short-term focus will like their current momentum pace, but may be disappointed at how illiquid their options are for the 3/18 expiration date.

KAI stock is worth taking a closer look into, regardless of your trading style.

*** I DO NOT OWN SHARES OF KAI STOCK ***

Hormel Foods Corp. HRL Stock Analysis

Hormel Foods Corp. stock trades under the ticker HRL & has shown recent bullishness that traders & investors should take note of.

HRL stock closed at $47.70/share on 2/23/2022.

Hormel Foods Corp. HRL Stock’s Technicals Broken Down

Hormel Foods Corp. HRL Stock's Technical Performance Over The Last Year

HRL Stock Price: $47.70

10 Day Moving Average: $47.50

50 Day Moving Average: $48.09

200 Day Moving Average: $45.40

RSI: 51.11

MACD: -0.081

Yesterday, HRL stock completed a bullish MACD crossover, on about average volume compared to the last year, while also breaking out above their 10 Day Moving Average.

Their next level of resistance is $48.09, followed by $48.13.

With a neutral RSI, HRL stock looks poised to continue climbing higher in the near-term.

Hormel Foods Corp. HRL Stock As A Long-Term Investment

Long-term oriented investors will like HRL stock’s valuation metrics, with a P/E (ttm) of 28.6 & a P/B (mrq) of 3.69.

HRL stock’s Quarterly Revenue Growth Y-o-Y is 42.8%, with 20.2% Quarterly Earnings Growth Y-o-Y.

Their balance sheet will require a further inspection though, with Total Cash (mrq) of $634.7M & Total Debt (mrq) of $3.4B.

They offer a 2.06% dividend yield, which looks relatively safe with a 59% payout ratio.

Only 42% of HRL stock’s outstanding share float is held by institutional investors.

Hormel Foods Corp. HRL Stock As A Short-Term Trade Using Options

Short-term oriented traders can use options to take advantage of HRL stock’s momentum, while hedging against broader market volatility.

I am looking at the contracts with the 3/18 expiration date.

The $47 & $48 call options look interesting, although their open interest levels are mediocre.

The $49 & $50 puts also look appealing, but are much less liquid than the calls, which signals that there is more bullish than bearish sentiment for HRL.

Tying It All Together

Overall, HRL stock has many attributes that traders & investors will find interesting.

Investors will like their dividend yield, as well as their valuation metrics.

Traders will like their momentum, but may be disappointed by the liquidity of their options contracts.

HRL stock is worth taking a closer look into, regardless of your trading style.

*** I DO NOT OWN SHARES OF HRL STOCK ***

Weekly Stock & ETF Market Update 2/20/2022

Another week of earnings calls, inflation data & international relations news awaits us, after a Monday holiday in the United States.

One of the best indicators on market sentiment is going to lie in the volume levels of the index-based ETFs, as inflows & outflows there will reflect the broader market’s feelings on the headlines.

SPXL, the Direxion Daily S&P 500 Bull 3x Shares ETF has been trading at higher than average volumes so far in 2022, mostly on weakness.

SPXL ETF - Direxion Daily S&P 500 Bull 3x Shares ETF's Technical Performance Over The Last Year
SPXL ETF – Direxion Daily S&P 500 Bull 3x Shares ETF

Their MACD implies that there will be more volatility coming in the week ahead.

TQQQ, the ProShares UltraPro QQQ ETF has also had similar fate, although a bit more extreme as we kicked off 2022.

TQQQ ETF -  ProShares UltraPro QQQ ETF's Technical Performance Over The Last Year
TQQQ ETF – ProShares UltraPro QQQ ETF

Their MACD is about to bearishly cross, although their futures are looking up in Wednesday’s pre-market trading.

Gold Miners (NUGT), Copper Miners (CPOX), South Africa (EZA) & Greece (GREK) Bullishly Leading The Pack

NUGT, the Direxion Daily Gold Miners Index Bull 2X ETF has rebounded coming into February 2022, after starting the year off on a sluggish foot.

NUGT ETF - Direxion Daily Gold Miners Index Bull 2X ETF's Technical Performance Over The Last Year
NUGT ETF – Direxion Daily Gold Miners Index Bull 2X ETF

Their RSI is showing that they’ve become a bit overbought, but with a still bullish MACD & the 10 Day MA moving in on the 200 day on high trading volume, there may be momentum to reach $61.94.

COPX, the Global X Copper Miners ETF has also made a strong recovery in February, after starting the year off down.

COPX ETF - Global X Copper Miners ETF's Technical Performance Over The Last Year
COPX ETF – Global X Copper Miners ETF

Their MACD looks to be about to bearishly cross, which should be an interesting one to watch play out given the nature of the Russian sanctions that we are seeing.

I’ll be keeping an eye on their RSI as it approaches neutral territory again in the coming days to see if it can regather momentum.

EZA, the iShares MSCI South Africa ETF has been on a bullish run since the middle of December 2021, gaining 18.7%.

EZA ETF - iShares MSCI South Africa ETF's Technical Performance Over The Last Year
EZA ETF – iShares MSCI South Africa ETF

EZA’s MACD is beginning to curl over bearishly after 2 days of declines, which may signal buying opportunities as it establishes a new range in the $52-54 price levels, with a 1.82% cushion provided by their dividend yield.

GREK, the Global X MSCI Greece ETF has also experienced strength since November 2021, gaining ~17%.

GREK ETF - Global X MSCI Greece ETF's Technical Performance Over The Last Year
GREK ETF – Global X MSCI Greece ETF

Last week they had a bearish MACD crossover, and their RSI has come back to neutral.

If their price can stay above the 10 Day Moving Average they look to have more momentum to come in the near-term.

Russia (RUSL), Social Media (SOCL), Sports Betting & iGaming (BETZ) & Solar (TAN) Sub-Industries All Bearishly Lagging The Pack

RUSL, the Direxion Daily Russia Bull 2X Shares ETF has been falling since November 2021, with what looks like more pain to come as their MACD crosses bearishly.

RUSL ETF - Direxion Daily Russia Bull 2X Shares ETF's Technical Performance Over The Last Year
RUSL ETF – Direxion Daily Russia Bull 2X Shares ETF

This one looks to be a bit too uncertain at this time, given the nature of the international sanctions being discussed, and they only offer a 1.43% cushion via the dividend.

SOCL, the Global X Social media Index ETF has also been experiencing weakness since November 2021.

SOCL ETF - Global X Social media Index ETF's Technical Performance Over The Last Year
SOCL ETF – Global X Social media Index ETF

SOCL is also faced with more bearish momentum, with their MACD crossing bearishly, and their RSI showing more room to fall in the near-term.

BETZ, the Roundhill Sports Betting & iGaming ETF has been weak since October of 2021, and does not look ready to begin rallying again just yet.

BETZ ETF - Roundhill Sports Betting & iGaming ETF's Technical Performance Over The Last Year
BETZ ETF – Roundhill Sports Betting & iGaming ETF

Last Friday’s gap down day indicates that there will be more losses for BETZ in the near-term, as their indicators are all currently bearish.

TAN, the Invesco Solar ETF has underperformed since November of 2021.

TAN ETF - Invesco Solar ETF's Technical Performance Over The Last Year
TAN ETF – Invesco Solar ETF

While they have been improving slightly in February 2022, their MACD signals that they’re going to be experiencing more losses in the near-term.

Tying It All Together

The rest of this week will prove to be interesting, as futures are currently up (Wednesday at 9:02am), as it’s being reported that the sanctions that have been announced were softer than what was anticipated.

Between earnings calls, the Ukrainian situation, PMI numbers & inflation related reports on Friday we look to have a rocky short trading week ahead of us.

I’ll be paying attention to the volume levels of the index-tracking ETFs for clues about market sentiment throughout the rest of the week.

The J.M. Smucker Co. SJM Stock Analysis

J.M. Smucker Co. stock trades under the ticker SJM & has shown recent bullishness that traders & investors should take a closer look into.

SJM stock closed at $138.99/share on 2/18/2022.

J.M. Smucker Co. SJM Stock’s Technicals Broken Down

J.M. Smucker Co. SJM Stock's Technical Performance Over The Last Year

SJM Stock Price: $138.99

10 Day Moving Average: $136.40

50 Day Moving Average: $137.17

200 Day Moving Average: $128.84

RSI: 54.66

MACD: -0.119

On Friday, SJM completed a bullish MACD crossover, while trading on just below average volume for the year prior.

With a neutral RSI & <0.5% between their 10 & 50 Day Moving Averages looks set to continue to the bullish charge & push SJM stock higher.

SJM stock’s next text of resistance will be at $139.70, followed by $140.73.

J.M. Smucker Co. SJM Stock As A Long-Term Investment

Investors will find SJM stock’s P/E (ttm) to be fair at 27.74, although their P/B (mrq) is a bit rich at 37.96.

SJM had Quarterly Revenue Growth Y-o-Y of 11.2%, with 20.4% Quarterly Earnings Growth Y-o-Y.

Their balance sheet will require a closer examination, with Total Cash (mrq) of $63.91B & Total Debt (mrq) of $122.8B.

SJM offers a 2.85% dividend yield, which looks safe, despite their payout ratio being 52%.

60% of SJM stock’s outstanding share float is held by institutional investors.

J.M. Smucker SJM Stock As A Short-Term Trade Using Options

SJM stock has options that traders can use to profit from short-term price fluctuations in either direction.

I am looking at the contracts with the 3/18 expiration date.

The $130, $135 & $140 call options all look appealing, although they have low open interest levels.

The $150 & $145 puts also look appealing, but very illiquid.

Tying It All Together

All-in-all, SJM stock has many characteristics that traders & investors alike will like.

Investors will like their dividend yield & valuation metrics, although they will want to look into their debt structure more closely.

Traders focused on the short-term will like their current momentum, but dislike the illiquidity of their options contracts.

SJM stock is worth taking a closer look at, regardless of your trading style.

*** I DO NOT OWN SHARES OF SJM STOCK ***

Kraft Heinz Co. KHC Stock Analysis

Kraft Heinz Co. stock trades under the ticker KHC & has shown recent bullishness that traders & investors should take a closer look into.

KHC stock closed at $37.79/share on 2/16/2022, after a 3.19% gain on Thursday.

Kraft Heinz Co. KHC Stock’s Technicals Broken Down

Kraft Heinz Co. KHC Stock's Technical Performance Over The Last Year

KHC Stock Price: $37.79

10 Day Moving Average: $35.21

50 Day Moving Average: $35.87

200 Day Moving Average: $37.37

RSI: 66.2

MACD: -0.093

Yesterday, KHC stock completed a bullish MACD crossover, after breaking out above its 10, 50 & 200 day moving averages in the last 2 days.

They have been trading on higher than average volume this week, with three straight days of gains, after having a rocky start to 2022.

Their RSI is almost overbought, which will simmer down in the coming days as they begin to establish a new trading range.

KHC’s next test of resistance is at $38.12.

Kraft Heinz Co. KHC Stock As A Long-Term Investment

Investors may find KHC stock’s P/E (ttm) to be a bit rich at 46.1, but their P/B (mrq) is modest at 0.91.

Their Quarterly Revenue Growth Y-o-Y is -3.3%

KHC stock’s balance sheet will require a closer examination, with Total Cash (mrq) of $3.44B & Total Debt (mrq) of $21.81B.

They offer a 4.37% dividend yield, which may be unsustainable in the longer run, as their payout ratio is 85.6%

Still, 79.6% of their outstanding share float is held by institutional investors.

Kraft Heinz Co. KHC Stock As A Short-Term Trade Using Options

KHC stock has options that traders can use to take advantage of their price movements in either direction.

I am looking at the contracts with the 3/18 expiration date.

The $37.50 & $40 calls both look interesting, and have open interest over 1,000+ contracts each, making them very liquid.

For puts, the $42.50 & $45 contracts look appealing, but they are very illiquid, with under 100 contracts of open interest per strike price.

Tying It All Together

Overall, there look to be a lot of appealing attributes to KHC stock.

Investors will like their valuation & dividend yield, but will want to take a deeper dive into their balance sheet to see how sustainable those yields are in the long-term.

Short-term investors will like their current momentum, as well as the liquidity levels of their options contracts.

KHC stock is worth taking a closer look into, regardless of your trading style.

*** I DO NOT OWN SHARES OF KHC STOCK ***

Regal Rexnord Corp. RRX Stock Analysis

Regal Rexnord Corp. stock trades under the ticker RRX & has shown recent bullishness that traders & investors should take a closer look into.

RRX stock closed at $161.90/share on 2/16/2022.

Regal Rexnord Corp. RRX Stock’s Technicals Broken Down

Regal Rexnord Corp. RRX Stock's Technical Performance Over The Last Year

RRX Stock Price: $161.90

10 Day Moving Average: $159.68

50 Day Moving Average: $164.23

200 Day Moving Average: $146.73

RSI: 50.3

MACD: -1.372

Yesterday, RRX stock completed a bullish MACD crossover, while trading at slightly above average volume levels for the last year.

With <3% between their 10 & 50 Day Moving Averages, there looks to be additional momentum to push their price higher in the near-term, particularly with a neutral RSI of 50.

RRX will need to break above $162.80, before testing $164.85/share.

Regal Rexnord Corp. RRX Stock As A Long-Term Investment

Long-term investors will like RRX stock’s valuation metrics, with a P/E (ttm) of 35.52 & a P/B (mrq) of 1.68.

RRX stock had 55.9% Quarterly Revenue Growth Y-o-Y, which investors will find appealing.

Their balance sheet may require a deeper review, with $672.8M it Total Cash (mrq) & $1.92B in Total Debt (mrq).

RRX stock offers a modest 0.8% dividend yield, which looks safe as their payout ratio is 29%.

82% of RRX’s outstanding share float is held by institutional investors.

Regal Rexnord Corp. RRX Stock As A Short-Term Trade Using Options

Regal Rexnord Corp. stock has options that traders can use to profit on their short-term movements in either direction.

I am looking at the contracts with the 3/18 expiration date.

The $160 & $165 call options look interesting, although highly illiquid.

The $170 puts also look appealing, but illiquid as well.

Since there is an expiration date for February tomorrow, I expect to see more contracts written in the coming week for March, but this does not look like a name that has a lot of open interest on average.

Tying It All Together

Overall, RRX stock has many unique characteristics that traders & investors will like.

Investors will like their valuation & safe dividend yield, but will want to look into their balance sheet a bit more in detail.

Traders will like their current momentum trajectory, but will be disappointed by the lack of open interest in their options contracts.

RRX stock is worth taking a closer look at to see if it matches your trading style.

*** I DO NOT OWN SHARES OF RRX STOCK ***