Lee Enterprises, Inc. LEE Stock

Lee Enterprises, Inc. stock trades under the ticker LEE & has shown recent bullishness that traders & investors should take a closer look into.

LEE stock closed at $37.17/share on 2/16/2022.

Lee Enterprises, Inc. LEE Stock’s Technicals Broken Down

Lee Enterprises, Inc. LEE Stock's Technical Performance Over The Last Year

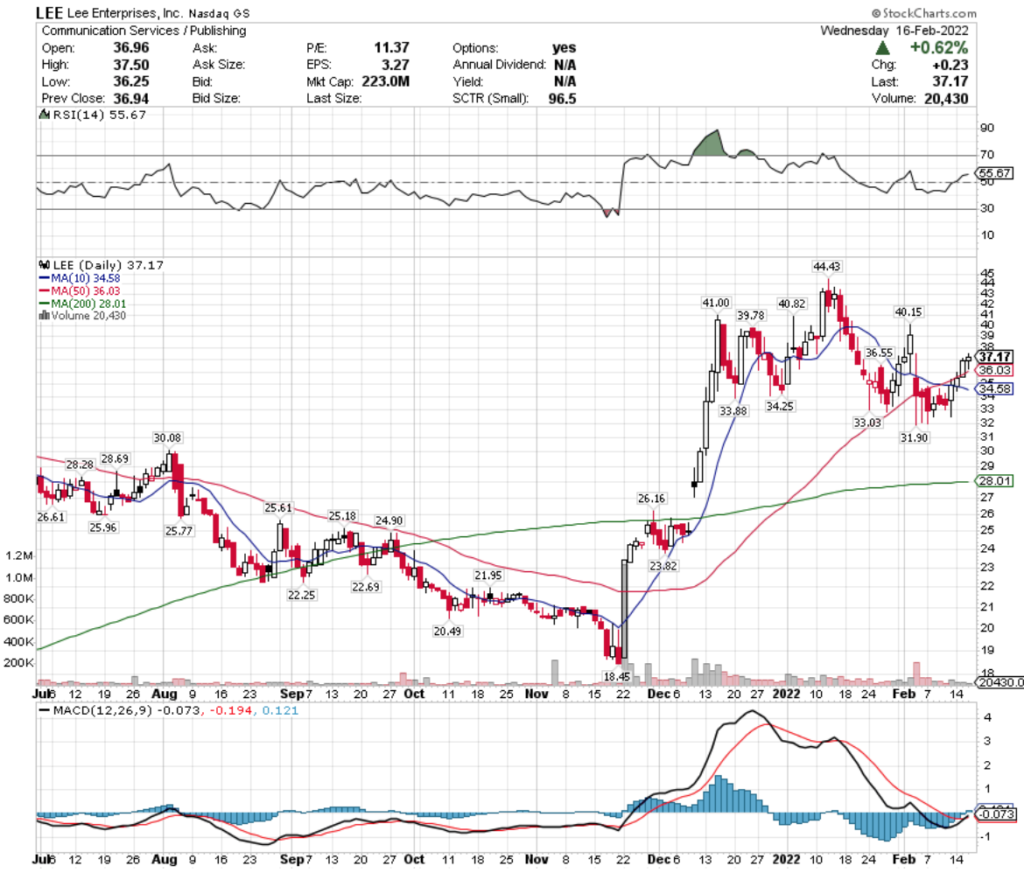
LEE Stock Price: $37.17

10 Day Moving Average: $34.58

50 Day Moving Average: $36.03

200 Day Moving Average: $28.01

RSI: 55.67

MACD: -0.073

Yesterday, LEE stock completed a bullish MACD crossover, a day after breaking out above its 50 Day Moving Average.

With a neutral RSI, they look to be in prime position to continue climbing higher in the near-term, as there is only ~4% between their 10 & 50 Day Moving Averages.

LEE stock will need to retest the $37.50 level, before the $40.15 level of resistance.

Lee Enterprises, Inc. LEE Stock As A Long-Term Investment

Long-term oriented investors will like LEE stock’s valuation metrics, with a P/E (ttm) of 10.73 & a P/B (mrq) of 3.47.

LEE stock had -4.5% Quarterly Revenue Growth Y-o-Y, with -20.4% Quarterly Earnings Growth Y-o-Y, which investors may want to look into why these drops occurred before investing.

Their balance sheet will require a closer examination as well, with $18.59M in Total Cash (mrq) & Total Debt (mrq) of $525.79M.

LEE stock does not offer a dividend yield, which may play a part as to why only 42% of their total share float is held by institutional investors.

Tying It All Together

Investors in the long-term may be interested in LEE stock for its valuation metrics, but may want to look closer into the structure of their debt on their balance sheet.

While LEE stock does not have options, there is still opportunities in the near-to-mid term to profit from their momentum, as their share price is poised to continue climbing.

Overall, LEE stock is worth taking a closer look into, regardless of your trading strategy.

*** I DO NOT OWN SHARES OF LEE STOCK ***

Kellogg Co. K Stock Analysis

Kellogg Co. stock trades under the ticker K & has shown recent bullishness that traders & investors should take a closer look into.

K stock closed at $64.59/share on 2/15/2022.

Kellogg Co. K Stock’s Technicals Broken Down

Kellogg Co. K Stock's Technical Performance Over The Last Year

K Stock Price: $64.59

10 Day Moving Average: $63.03

50 Day Moving Average: $64.38

200 Day Moving Average: $63.30

RSI: 53.4

MACD: -0.363

Yesterday, K stock completed a bullish MACD crossover, while breaking out above its 50 Day Moving Average.

With a neutral RSI & its 10 day MA set to bullishly cross the 200 day MA, there looks to be more momentum on the horizon for K stock.

Their next test level is $65.98/share.

Kellogg Co. K Stock As A Long-Term Investment

Investors focused on long-term returns will find Kellogg stock to have many interesting characteristics.

Their P/E (ttm) looks fair at 14.95, although their P/B (mrq) is a bit rich at 5.95.

K stock’s Quarterly Revenue Growth Y-o-Y is -1.2%, with 111.2% Quarterly Earnings Growth Y-o-Y.

K stock’s balance sheet warrants a closer examination, with $286M in Total Cash (mrq) & $7.73B in Total Debt (mrq).

Their dividend yield is 3.57%, which appears safe for now with a payout ratio of 53%.

85.2% of K stock’s total share float is held by institutional investors.

Kellogg Co. K Stock As A Short-Term Trade Using Options

Kellogg stock has options that traders can use to take advantage of price movements in both directions in the near-term.

I am looking at the contracts with the 3/18 expiration date.

The $62.50 & $65 call options look appealing, as both have decent liquidity.

The $70 & $72.50 puts also look appealing, although they are less liquid, with lower open interest.

Tying It All Together

Overall, K stock has many appealing attributes that traders & investors will like.

Their valuation metrics are fair, and they also offer a nice dividend that investors will be fond of.

Traders will like their options’ open interest levels, as well as their current momentum path.

K stock is worth taking a closer look at, regardless of your portfolio structure.

*** I DO NOT OWN SHARES OF K STOCK ***

J.B. Hunt Transport Services, Inc. JBHT Stock

J.B. Hunt Transport Services Inc. stock trades under the ticker JBHT & has shown recent bullishness that traders & investors should take a closer look into.

JBHT stock closed at $193.01/share on 2/15/2022.

J.B. Hunt Transport Services, Inc. JBHT Stock’s Technicals Broken Down

J.B. Hunt Transport Services, Inc. Stock's Technical Performance Over The Last Year

JBHT Stock Price: $193.01

10 Day Moving Average: $191.51

50 Day Moving Average: $196.96

200 Day Moving Average: $180.45

RSI: 48.26

MACD: -1.791

Yesterday, JBHT stock completed a bullish MACD crossover, while also breaking out above its 10 day moving average.

2022’s trading volume so far has been above average, and their RSI is just below neutral, showing room for more momentum in the near-term.

Their next test of resistance is $197.35, followed by $201.03.

J.B. Hunt Transport Services Inc. JBHT Stock As A Long-Term Investment

Investors will find JBHT to have fair valuation metrics, with a P/E (ttm) of 26.96, although their P/B (mrq) is a bit rich at 6.49.

JBHT stock had 27.7% Quarterly Revenue Growth Y-o-Y, as well as 57.3% Quarterly Earnings Growth Y-o-Y.

Their balance sheet will require a closer examination though, with $355.55M in Total Cash (mrq) & $1.3B in Total Debt (mrq).

They offer a modest dividend of 0.61%, which looks very safe as JBHT stock’s payout ratio is 16.5%.

74.3% of JBHT stock’s outstanding share float is held by institutional investors.

J.B. Hunt Transport Services Inc. JBHT Stock As A Short-Term Trade Using Options

Short-term traders can profit from JBHT stock’s current momentum by trading options.

I am looking at the contracts with the 3/18 expiration date.

The $190 & $195 calls look interesting, although very illiquid, with low levels of open interest.

The $195 & $200 puts also look appealing, but very illiquid too.

I expect to see more contracts written after this week’s expiration date passes on Friday.

Tying It All Together

JBHT stock has many interesting characteristics that traders & investors should find appealing.

Traders will like their current trajectory of momentum, but will be looking for more liquidity in their March dated options.

Investors will like their valuation metrics, but would certainly appreciate a dividend hike.

Overall, JBHT stock is worth taking a closer look into, regardless of your trading style.

*** I DO NOT OWN SHARES OF JBHT STOCK ***

Union Pacific Corp. UNP Stock Analysis

Union Pacific Corp. stock trades under the ticker UNP & has shown recent bullishness that traders & investors should take a closer look into.

UNP stock closed at $249.32/share on 2/15/2022.

Union Pacific Corp. UNP Stock’s Technicals Broken Down

UNP Stock Price: $249.32

10 Day Moving Average: $244.14

50 Day Moving Average: $245.95

200 Day Moving Average: $227.28

RSI: 55.91

MACD: -0.423

Yesterday, UNP stock completed a bullish MACD crossover, while gapping up & breaking out above its 10 & 50 day moving averages.

They have traded slightly above average volume in 2022 compared to the rest of the previous year & their RSI is neutral, signaling that there is more short-term momentum to come.

Their next levels to be watching for in terms of resistance are $250.53 & $251.80.

Union Pacific Corp. UNP Stock As A Long-Term Investment

Investors will find UNP stock’s P/E (ttm) to be modest at 24.38, but may balk at their P/B (mrq) of 10.91.

UNP stock saw 11.5% Quarterly Revenue Growth Y-o-Y, as well as 24% Quarterly Earnings GRowth Y-o-Y.

Their balance sheet will require a closer look before making an investment, as they have $1.01B in Total Cash (mrq) & $31.49B in Total Debt (mrq).

UNP stock’s dividend yield is 1.77%, which looks to be stable in the long run as their payout ratio is 43.12%.

81.14% of UNP stock’s outstanding share float is held by institutional investors.

Union Pacific Corp. UNP Stock As A Short-Term Trade Using Options

Traders can use options to take advantage of UNP stock’s current momentum trajectory, as well as hedge against broader market volatility.

I am looking at the contracts with the 3/18 expiration date.

The $250 & $255 calls look appealing, and liquid, as they have healthy levels of open interest.

The $265 & $270 puts also look appealing, but are far less liquid, showing that the market has bullish sentiment for UNP stock in the near-term.

Tying It All Together

Overall, both traders & investors will find UNP stock to have appealing attributes.

Investors will like their dividend, as well as their healthy valuation metrics.

Traders will like their current momentum, as well as their liquid call options.

UNP stock is worth taking a closer look at, regardless of your trading strategy.

*** I DO NOT OWN SHARES OF UNP STOCK ***

Vector Group Ltd. VGR Stock Analysis

Vector Group Ltd. stock trades under the ticker VGR & has shown recent bullishness that traders & investors should take a closer look into.

VGR closed at $11.42/share on 2/14/2022.

Vector Group Ltd. VGR Stock’s Technicals Broken Down

Vector Group Ltd. VGR Stock's Technical Performance Over The Last Year

VGR Stock Price: $11.42

10 Day Moving Average: $11.24

50 Day Moving Average: $11.39

200 Day Moving Average: $10.15

RSI: 53.3

MACD: -0.032

Yesterday, VGR stock completed a bullish MACD crossover on below average volume compared to the last year.

With ~1.3% between their 10 & 50 Day Moving Averages, they look to have additional momentum in the near-term, as their RSI is still neutral.

The next levels of resistance are $11.66, $11.72 & $11.92, as they look to head back to their 2021 price levels.

Vector Group Ltd. VGR Stock As A Long-Term Investment

Investors will find VGR stock’s P/E (ttm) appealing at 8.37, although their P/B (mrq) is not positive.

VGR stock’s Quarterly Revenue Growth Y-o-Y is 27.8%, with Quarterly Earnings Growth Y-o-Y of 28.2%.

Their balance sheet will require a closer look by prospective investors, with Total Cash (mrq) of $678.83M & Total Debt (mrq) of $1.58B.

VGR stock’s dividend is 7.07%, which while it is appealing, may not be sustainable in the long-run, as their current Payout Ratio is 72%.

64% of VGR stock’s share float is held by institutional investors.

Vector Group Ltd. VGR Stock As A Short-Term Trade Using Options

Vector Group Ltd. stock has options that traders can use to capitalize on near-term momentum, as well as to ward off volatility-risks.

I am looking at the contracts with the 3/18 expiration date

The $10 & $12.50 calls look appealing, however they are currently very illiquid.

As there is another expiration date passing this Friday I expect to see more contracts written for March in the coming weeks.

They currently have no open interest on the $17.50 & $15 puts, but those are the contracts that I would be eyeing as February’s expiration date passes & new contracts begun being written.

Tying It All Together

Overall, there looks to be many advantages to VGR stock that both investors & traders will enjoy.

Traders will like their current momentum, and will need to keep an eye out as this expiration date passes in February & new contracts are written for March.

Investors will like their low P/E (ttm), as well as their dividend yield, but may be skeptical about their balance sheet & payout ratio.

VGR stock is worth taking a closer look at, regardless of your trading style.

*** I DO NOT OWN SHARES OF VGR STOCK ***

Tesla Inc. TSLA Stock Analysis

Tesla Inc. stock trades under the ticker TSLA & has shown recent bullishness that traders & investors should take a closer look into.

TSLA closed at $922/share on 2/8/2022.

Tesla Inc. TSLA Stock’s Technicals Broken Down

Tesla Inc. TSLA Stock's Technical Performance Over The Last Year

TSLA Stock Price: $922

10 Day Moving Average: $903.03

50 Day Moving Average: $1,007.63

200 Day Moving Average: $820.91

RSI: 45.19

MACD: -34.747

Yesterday, TSLA completed a bullish MACD crossover, trading on about average volume compared to the last year.

Their 10 Day Moving Average is ~12% below their 50 Day MA still, but with their RSI still below neutral, there looks to be more room for momentum in the coming days.

TSLA stock will need to break above the $947.77/share, before testing the $987/share level.

Tesla Inc. TSLA Stock As A Long-Term Investment

Investors may find TSLA stock’s valuation metrics to be too rich, with a P/E (ttm) of 294.59 & a P/B (mrq) of 34.66.

TSLA stock’s Quarterly Revenue Growth Y-o-Y is 64.9%, with 759.6% Quarterly Earnings Growth Y-o-Y.

Investors may want to look deeper into TSLA stock’s balance sheet, but will like it at first glance, with Total Cash (mrq) of $17.71B & Total Debt (mrq) of $6.83B.

They do not offer a dividend yield, and their beta is 2.01, meaning that they tend to move more aggressively & volatilely than the average market indexes.

42.32% of TSLA stock’s total share float is held by institutional investors.

Tesla Inc. TSLA Stock As A Short-Term Trade Using Options

TSLA stock has options that can be used by traders to take advantage of their price movements in either direction, while also hedging against volatility.

I am looking at the contracts with the 2/18 expiration date.

The $940 & $945 calls look interesting, and are fairly liquid with open interest levels just under 1,000 contracts each.

The $990 & $985 puts also look appealing, although they do have slightly less open interest.

Tying It All Together

Overall, TSLA stock has many interesting characteristics that traders & investors may find appealing.

Investors may find their balance sheet interesting, but may also be put off by their valuation metrics & lack of a dividend.

Traders will like their current momentum, as well as the liquidity of their options contracts.

TSLA stock is worth taking a closer look at, regardless of your trading style.

*** I DO NOT OWN SHARES OF TSLA STOCK ***

All numbers here taken from Yahoo Finance****

Genco Shipping & Trading Ltd. GNK stock

Genco Shipping & Trading Ltd. stock trades under the ticker GNK & has shown recent bullishness that traders & investors should take a closer look at.

GNK stock closed at $17.01/share on 2/7/2022.

Genco Shipping & Trading Ltd. GNK Stock’s Technicals Broken Down

Genco Shipping & Trading Ltd. GNK Stock's Technical Performance Over The Last Year

GNK Stock Price: $17.01

10 Day Moving Average: $15.73

50 Day Moving Average: $15.49

200 Day Moving Average: $16.87

RSI: 61.3

MACD: 0.205

Yesterday, GNK stock broke out above its 200 Day Moving Average, just days after its 10 day broke out bullishly above its 50 day MA.

Their RSI is still relatively neutral, although climbing closer to overbought & their trading volume for 2022 so far has been above average compared with the year prior.

I will be keeping an eye at where they are compared to the $17-level, with the $17.99/share level being the next major test of resistance.

Genco Shipping & Trading Ltd. GNK Stock As A Long-Term Investment

Investors will like GNK stock’s valuation metrics, with 27.53 for their P/E (ttm) & 0.79 for their P/B (mrq).

GNK stock’s Quarterly Revenue Growth Y-o-Y was 77.4%.

Genco Shipping & Trading Ltd.’s balance sheet will require closer examination though, with $80.17M in Total Cash (mrq) & Total Debt (mrq) of $305.28M.

GNK stock offers a 1.96% dividend yield, that appears very safe as their payout ratio is 33.3%.

73.8% of GNK stock’s outstanding share float is held by institutional investors.

Genco Shipping & Trading Ltd. GNK Stock As A Short-Term Trade Using Options

Traders can use options to take advantage of GNK stock’s momentum, while fending off broader market volatility.

I am looking at the contracts with the 2/18 expiration date.

The $15 & $17.50 call options look appealing, and have sufficient open interest.

The $20 & $22.50 put options also look appealing, although less liquid, implying that markets see more strength than weakness for GNK stock in the near-term.

Tying It All Together

Overall, GNK stock has many appealing characteristics that traders & investors will like.

Investors will like their valuation metrics, as well as their dividend yield, but may want to take a closer look at their balance sheet structure.

Traders will like their current momentum, as well as the liquidity around their options.

GNK stock is worth taking a closer look at, regardless of your trading style.

*** I DO NOT OWN SHARES OF GNK STOCK ***

NetApp Inc. NTAP Stock Analysis

NetApp Inc. stock trades under the ticker NTAP & has shown recent bullishness that traders & investors should take note of.

NTAP stock closed at $87.33/share on 2/7/2022, with additional bullish momentum to run.

NetApp Inc. NTAP Stock’s Technicals Broken Down

NetApp Inc. NTAP Stock's Technical Performance Over The Last Year

NTAP Stock Price: $87.33

10 Day Moving Average: $86.57

50 Day Moving Average: $89.56

200 Day Moving Average: $84.89

RSI: 45.51

MACD: -0.977

Yesterday, NTAP completed a bullish MACD crossover, despite dropping 0.34%.

Their RSI is just below neutral, which should provide them additional strength in the near-term given that they have traded at above average volumes since the beginning of 2022.

NTAP stock’s next tests of resistance will be at $88.46, $88.45 & $89.68.

NetApp Inc. NTAP Stock As A Long-Term Investment

Investors will find NTAP stock’s P/E (ttm) appealing, at 21.30.

Their P/B (mrq) is a bit rich at 25.76.

NetApp Inc.’s Quarterly Revenue Growth Y-o-Y is 10.6%, with 63.5% Quarterly Earnings growth Y-o-Y.

NTAP stock’s balance sheet looks appealing, with Total Cash (mrq) of $4.56B & Total Debt (mrq) of $2.91B.

They offer a 2.24% dividend yield, with a safe 47% payout ratio.

95.56% of NTAP stock’s outstanding share float is held by institutional investors.

NetApp Inc. NTAP Stock As A Short-Term Trade Using Options

NTAP stock has options that traders can trade to hedge against broader market volatility in the near-term.

I am looking at the contracts with the 2/18 expiration date.

The $86 & $87 call options look interesting, although very illiquid.

The $89 & $90 put options also look appealing, although also low in open interest.

NTAP stock has weekly expiration dates though, so open interest may increase as the expiration date draws nearer & other contracts expire.

Tying It All Together

All-in-all, NTAP stock is appealing for both long & short term focused market participants.

Long-term investors will like their balance sheet & dividend yield.

Short-term oriented traders will like their momentum, but will want to see more open interest & liquidity in their medium-term expiration dated contracts.

NTAP stock is worth taking a closer look at, regardless of your trading style.

*** I DO NOT OWN SHARES OF NTAP STOCK ***

Northern Trust Corp. NTRS Stock

Northern Trust Corp. stock trades under the ticker NTRS & has shown recent bullishness that traders & investors should take a closer look into.

NTRS stock closed at $122.64/share on 2/7/2022.

Northern Trust Corp. NTRS Stock’s Technicals Broken Down

Northern Trust Corp. NTRS Stock's Technical Performance Over The Last Year

NTRS Stock Price: $122.64

10 Day Moving Average: $118.08

50 Day Moving Average: $120.50

200 Day Moving Average: $116.57

RSI: 53.9

MACD: -0.724

Yesterday, NTRS stock completed a bullish MACD crossover, on higher than average volume for the year.

With ~2% between the 10 & 50 Day Moving Averages, there looks to be additional momentum coming to help them break through the next levels of resistance, particularly as their RSI is neutral.

Their next tests of resistance will be at $125.73 & $130.97.

Northern Trust Corp. NTRS Stock As A Long-Term Investment

Long-term investors will like NTRS stock’s valuation metrics, with a P/E (ttm) of 16.75 & a P/B (mrq) 2.23.

They also had 10.1% Quarterly Revenue Growth Y-o-Y & 68.7% Quarterly Earnings Growth Y-o-Y.

NTRS stock’s balance sheet does require a closer look though, with Total Cash (mrq) of $1.93B & Total Debt (mrq) of $7.77B.

Their 2.3% dividend yield also appears safe, as their payout ratio is 39.22%.

82.81% of NTRS stock’s outstanding share float is held by institutional investors.

Northern Trust Corp. NTRS Stock As A Short-Term Trade Using Options

NTRS stock has options that can be traded in order to take advantage of their price movements in either direction.

I am looking at the contracts with the 2/18 expiration date.

The $120 & $125 calls look appealing, although they have low open interest.

The $130 & $125 puts also look interesting from a hedging perspective.

Tying It All Together

Overall, Northern Trust Corp. stock has many characteristics that traders of all styles will appreciate.

Long-term oriented investors will like their valuation metrics, as well as their dividend yield.

Short-term focused traders will like their current momentum pace, despite their options having mediocre open interest levels.

NTRS stock is worth taking a closer look at, regardless of your trading style.

*** I DO NOT OWN SHARES OF NTRS STOCK ***

Philip Morris Intl. Inc. PM Stock

Philip Morris Intl. Inc. stock trades under the ticker PM & has shown recent bullishness that traders & investors should take a closer look into.

PM stock closed at $103.59/share on 2/4/2022

Philip Morris Intl. Inc. PM Stock’s Technicals Broken Down

Philip Morris Intl. Inc. PM Stock's Technical Performance Over The Last Year

PM Stock Price: $103.59

10 Day Moving Average: $102.73

50 Day Moving Average: $95.59

200 Day Moving Average: $95.63

RSI: 65.5

PM stock has been trading on above average volume this last month, compared with the rest of the year prior.

Their 50 Day MA is primed to bullishly break through their 200 Day MA today, and their RSI is approaching overbought territory at 65.5.

The $103.75-.80-level is going to be a big test for them, as that was their year’s prior high level.

While their MACD is currently bearish, I would be keeping an eye on it as they continue to try to break out above the $104-level for a shift in momentum.

Philip Morris Intl. Inc. PM Stock As A Long-Term Investment

Long-term investors in PM stock may find their P/E (ttm) appealing, at 18.09.

Their P/B (mrq) is negative, which may be a problem to some investors.

PM stock’s Quarterly Revenue Growth Y-o-Y is 9.10%, with Quarterly Earnings Growth Y-o-Y of 5.2%.

Their balance sheet will require a closer examination, with $4.49B in Total Cash (mrq) & Total Debt (mrq) of $29.11B.

Their prices move in a less volatile manner than the average market, with a beta of 0.83.

PM stock pays a 4.67% dividend yield, however this may not be stable in the long run, as their payout ratio is 84.5%.

Despite this, they have 76% of their total share float held by institutional investors.

Philip Morris Intl. Inc. PM Stock As A Short-Term Trade Using Options

PM stock has options that can be traded to take advantage of their price movements in either direction, while also hedging against volatility.

I am looking at the contracts with the 2/28 expiration date.

The $102 & $103 call options look appealing, but are low in open interest.

This stands out as the $105’s have more liquidity than the $102, $103 & $104 calls, signaling that the market feels strongly about their performance heading in that direction as we carry on into February.

The $104 & $105 puts also look interesting, as the $106’s have no open interest.

Tying It All Together

All-in-all, there look to be many appealing characteristics to PM stock.

Investors will find its valuation & dividend appealing, but may have questions about their debt structuring.

Traders will like their current momentum, as they try to break above the $104/share level.

Overall, PM stock is worth taking a closer look at.

*** I DO NOT HAVE A POSITION IN PM AT THE TIME OF WRITING THIS, BUT I AM RESEARCHING THEM FURTHER ***