Educational Development Corp. stock trades under the ticker EDUC, and offers many interesting advantages that long-term investors may be interested in.
EDUC stock closed for trading at $18.19 on Friday 10/23/2020 (publishing this a day later than usual as I am on vacation), and gained an additional 1.21% today (8/26/20).
Breaking Down Educational Development Corp EDUC Stock’s Fundamentals
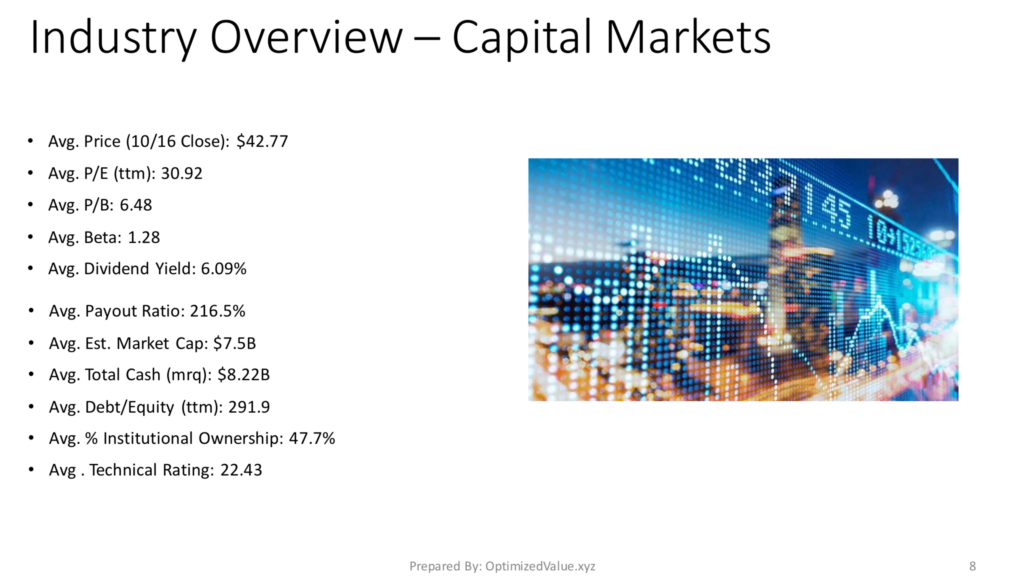
Investors may be interested in EDUC stock as it sports a P/E (ttm) of 16.1, combined with a Dividend Yield of 2.2% & A Payout Ratio of 11.8%.
In addition to that, their Debt/Equity (ttm) is 54.37, which is much lower than most of its peers & our Technical Rating for EDUC is 308.92, which is also very bullish compared to other stocks.
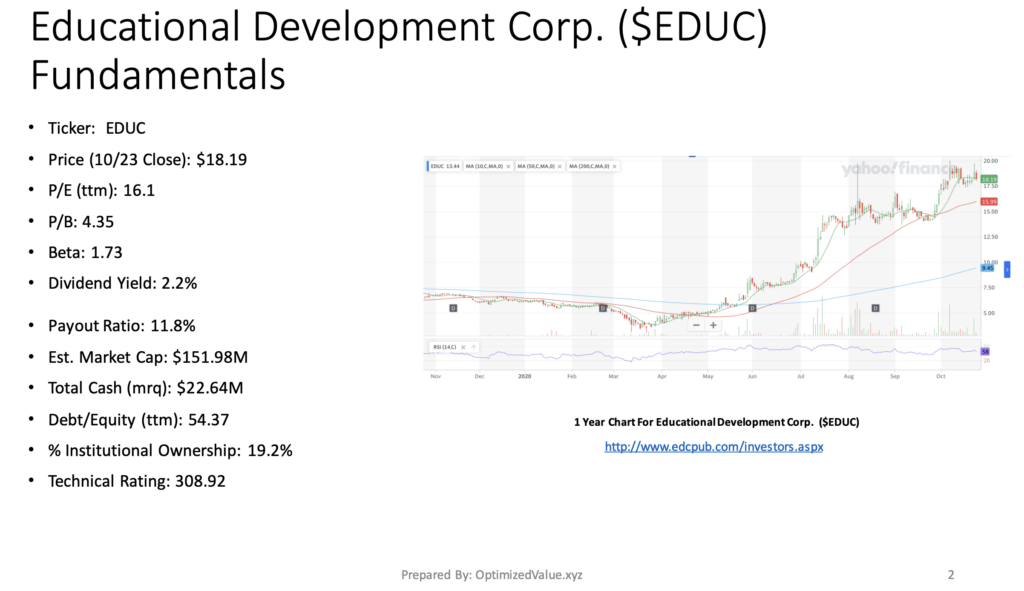
EDUC is a Micro-Cap stock, with a Market Cap of $151.98M, which contributes to its 19.2% % Institutional Ownership.
Their Total Cash (mrq) is $22.64M, which is especially impressive when you look at their Total Debt (mrq) of just $11.3M.
EDUC stock’s P/B is 4.35 & their Beta is a little hotter than most stocks at 1.73, which is to be expected from smaller stocks, especially in turbulent times such as 2020.
Educational Development Corp. EDUC Stock’s Technical Performance Has Been Strong
Educational Development Corp.’s stock has had a solid year for 2020, after 40 years of impressive growth.
While their price from Friday’s close was even with their 10 Day Moving-Average, their continued growth shows signs of being able to keep gaining, with the potential for some new attractive entry points in the event of anticipated election-time volatility.
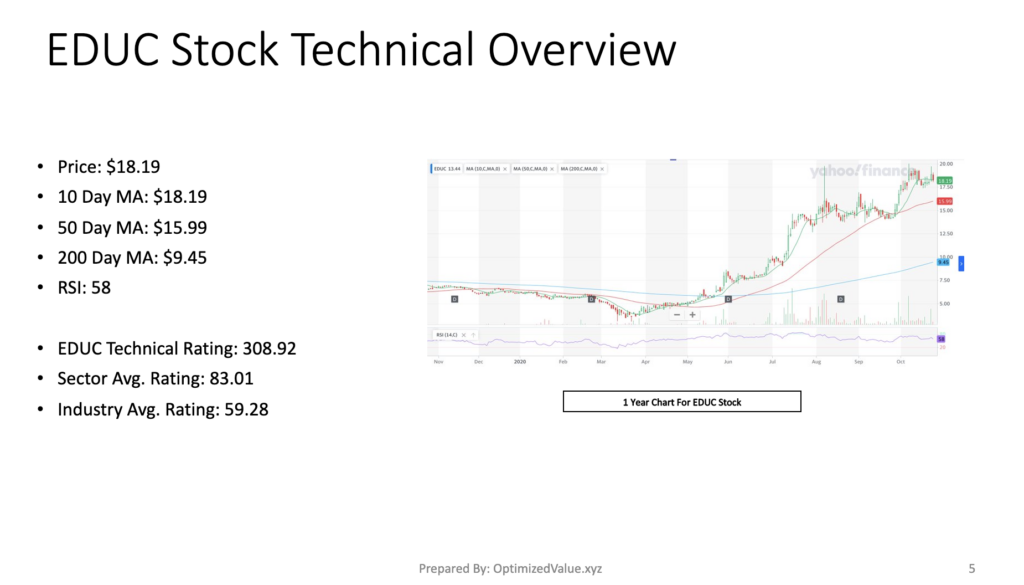
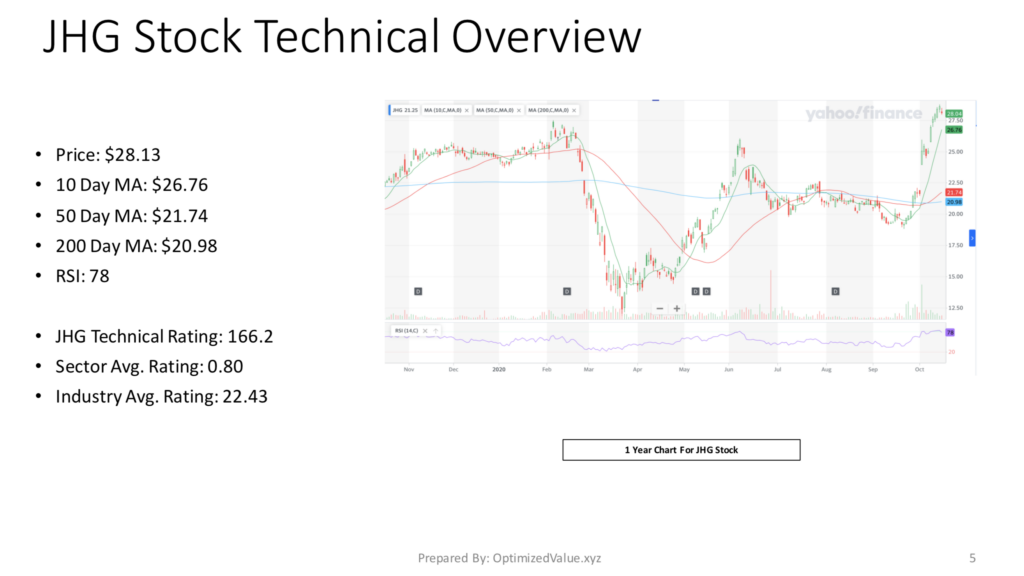
EDUC Stock Price (10/23/2020): $18.19
10 Day Moving-Average: $18.19
50 Day Moving-Average:$15.99
200 Day Moving-Average: $9.45
RSI: 58
EDUC’s stock also has a strong Technical Rating of 308.92.
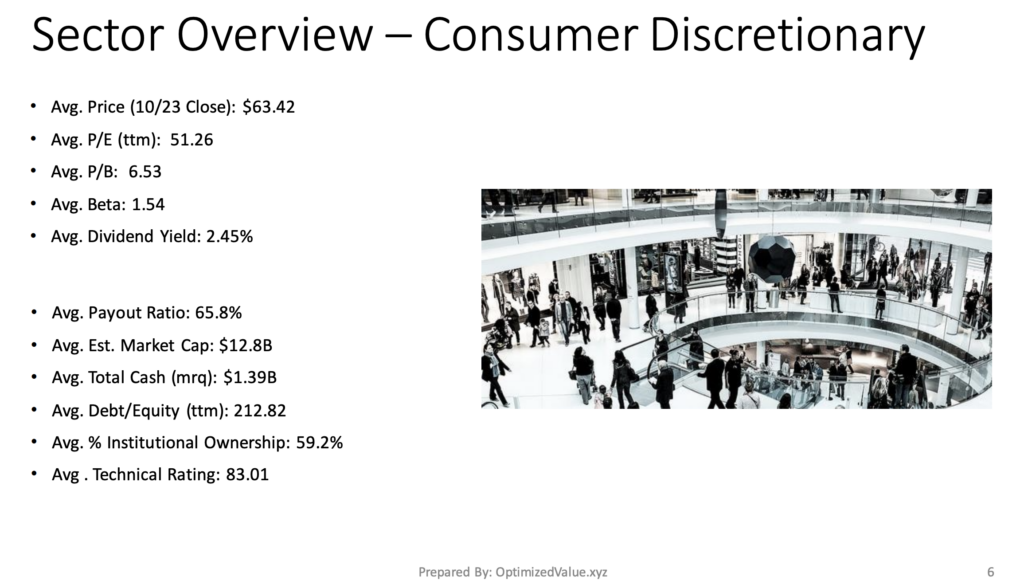
For comparison sake, the average Consumer Discretionary Sector average rating is 83.01, and the Distributor Industry’s score is even worse at 59.28, so they offer strength compared to their direct peers.
Educational Development Corp. EDUC Stock’s Fundamentals Vs. The Consumer Discretionary Sector’s Averages
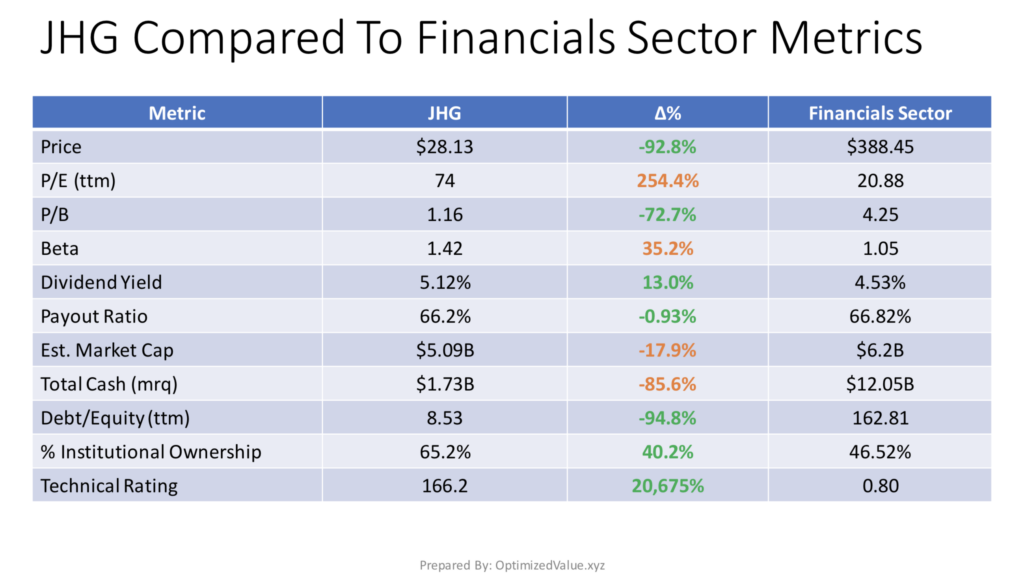
EDUC’s stock offers many fundamental advantages over its peers in the Consumer Discretionary sector.
EDUC’s P/E (ttm) is 68.6% better than average, and their P/B is 33.4% better than the average of their sector peers.
Their Debt/Equity (ttm) is most impressive, being ~75% better than average & their Payout Ratio is 82% better than average.
EDUC’s Technical Rating is also 272% higher than their average sector peer, showing their past year to be quite strong.
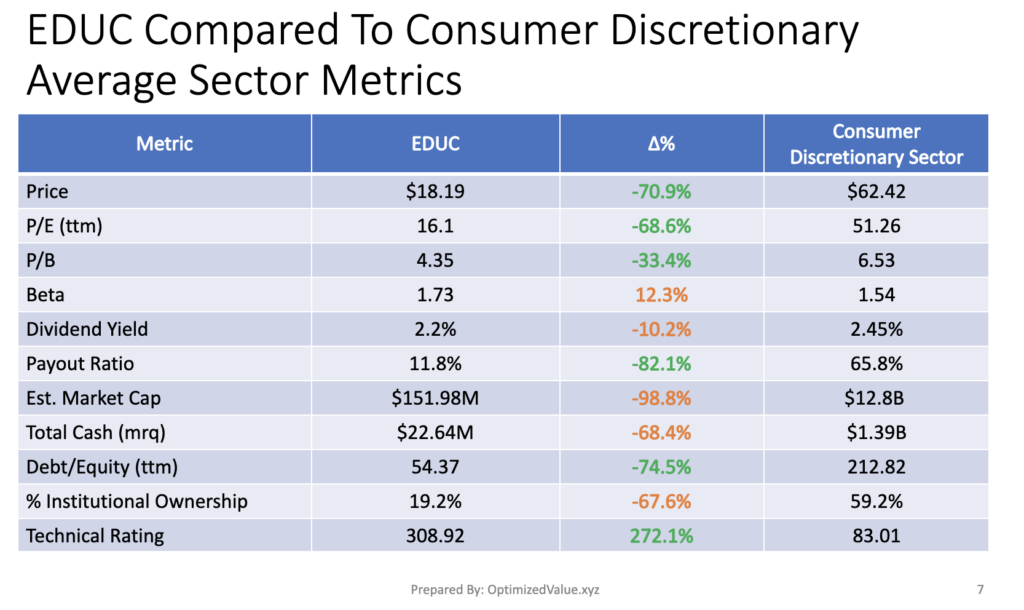
EDUC’s Dividend Yield is 10% lower than average, but more stable given their Payout Ratio.
While their Market Cap is 98% lower than average, their Total Cash (mrq) is only 68% less than average.
EDUC’s higher than average Beta (+12.3%) & Micro Cap status are likely the largest contributors to their 67.6% lower than average % Insitutional Ownership, which shouldn’t deter an average investor.
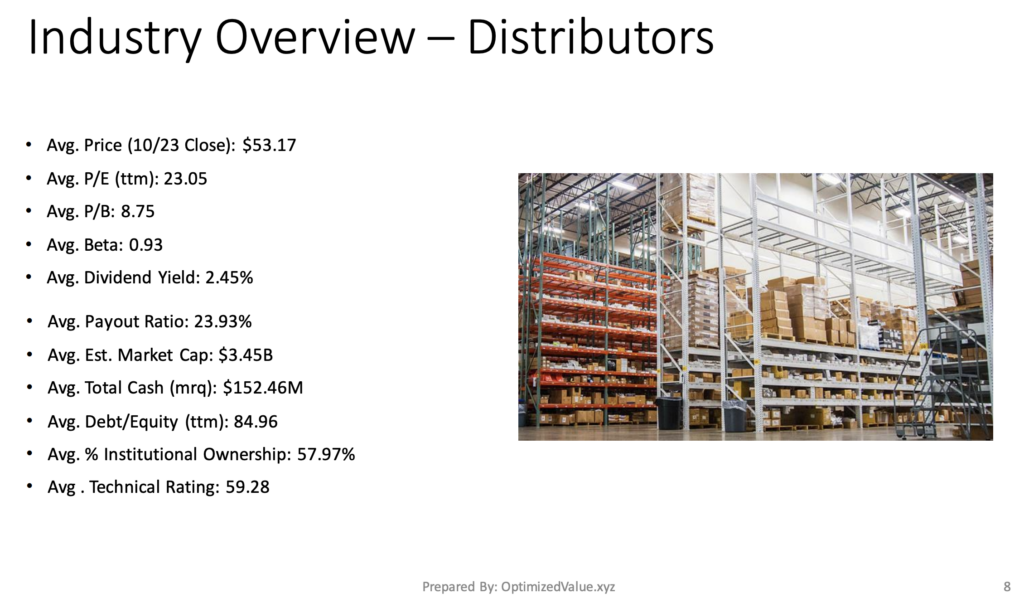
Educational Development Corp. EDUC Stock Fundamentals Vs. The Distributors Industry Averages
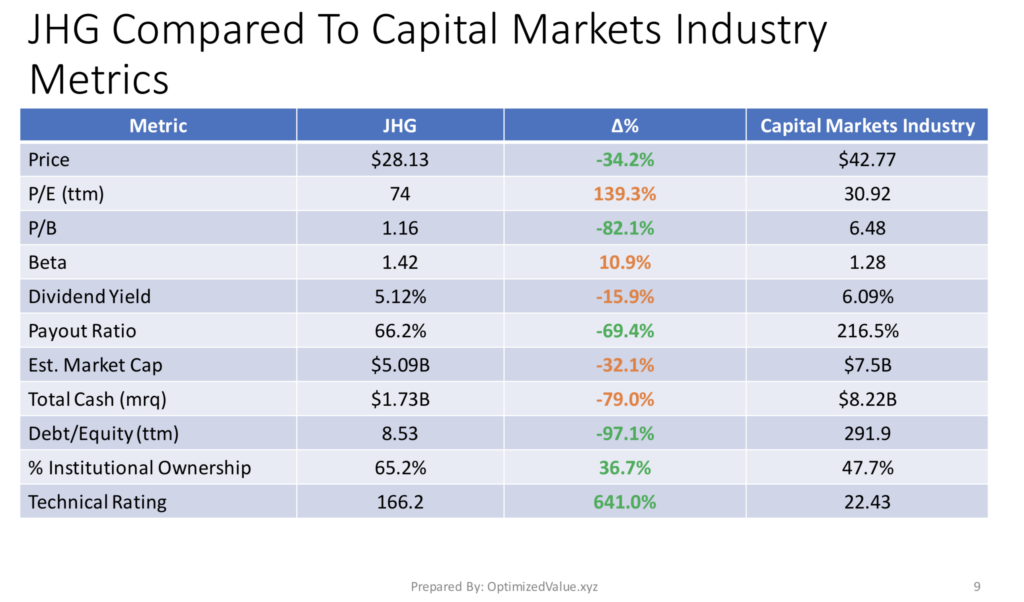
Educational Development Corp.’s stock also outperforms their average peer in the Distributors Industry as well.
EDUC stock’s P/E (ttm) is 30% better than average, and their P/B is 50% better than the industry average.
Their Payout Ratio is 51% better than average, and their Debt/Equity (ttm) is 36% better than their average peer.
On a Technical Rating basis, they outperform the industry average by 421%!
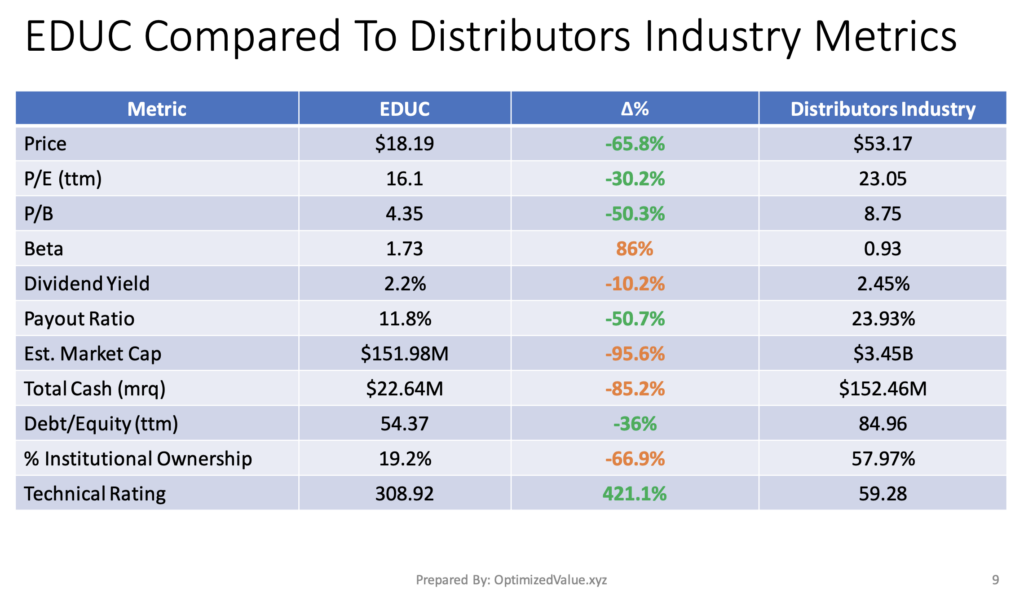
Of course, their Market Cap is 96% less than average, and their Total Cash is 85% over par; leading to their ~70% less than average % Institutional Ownership.
Educational Development Corp. EDUC Stock Performance Vs. The S&P 500 & NASDAQ Indices
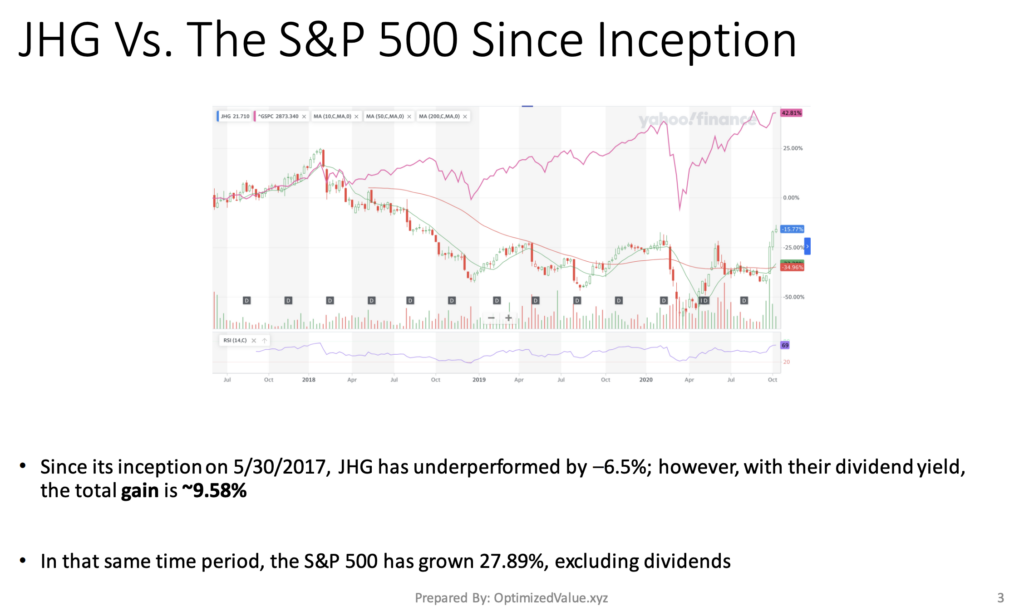
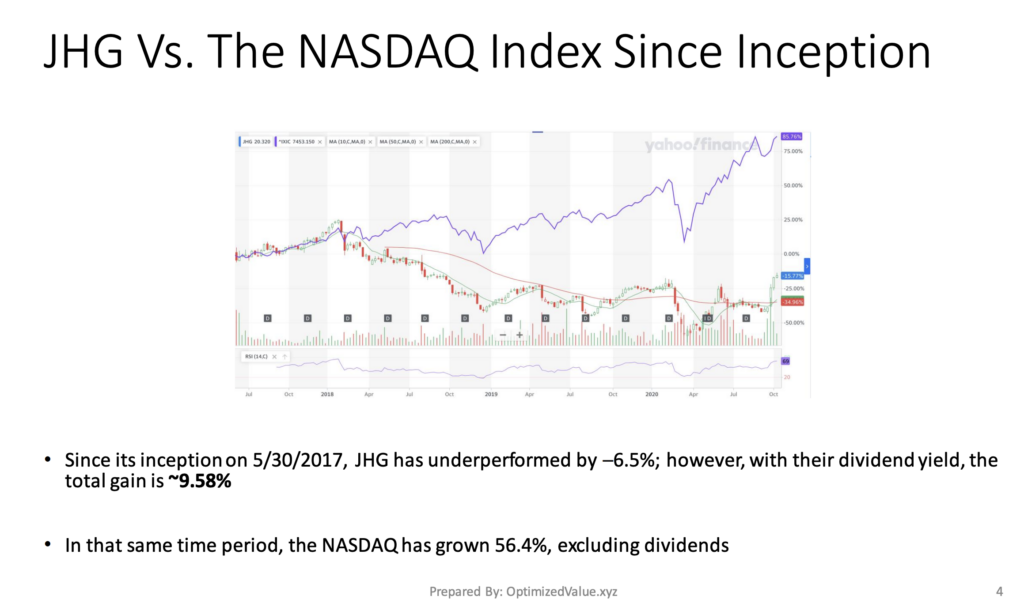
Since their first day of trading 40+ years ago on 3/18/1980, EDUC stock has grown by 7,176%.
When you factor in the Dividends that would have been collected over that time, they’ve grown ~9,292%!
For comparison, the S&P 500 has only grown 3,163.8% in that time period (excluding dividends).
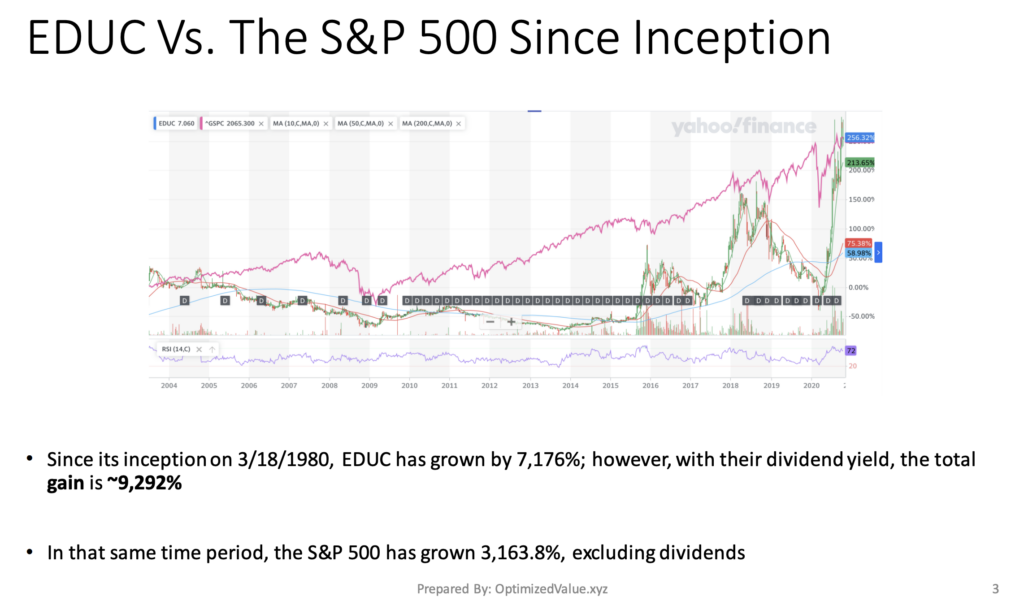
They have also outperformed the NASDAQ Index in that same time period, as the NASDAQ has grown 8,087.3% (excluding dividends).
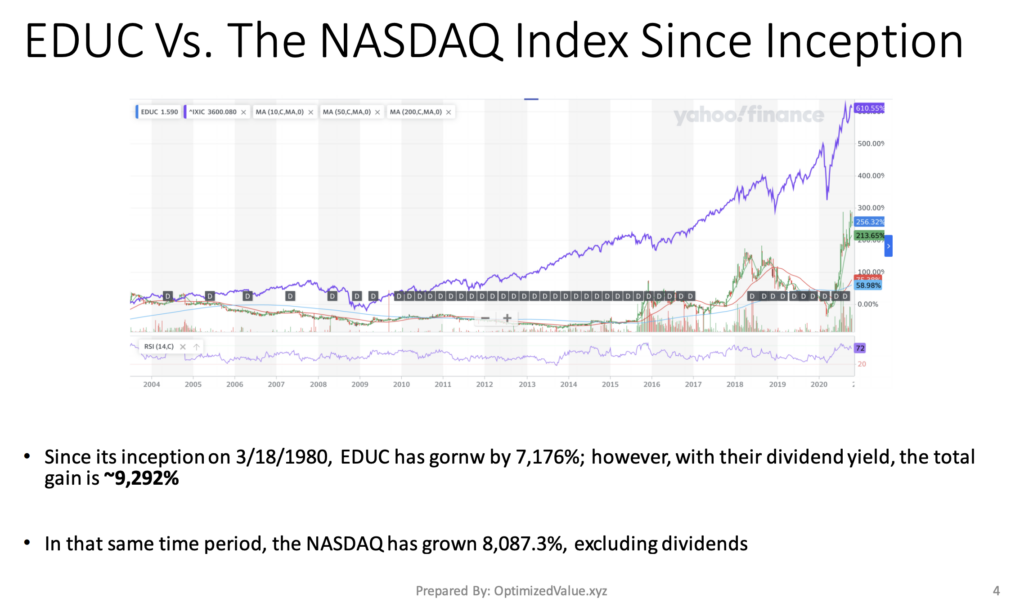
With this lifetime growth in mind, EDUC stock looks like a very attractive long-term investment opportunity.
Tying It All Together
EDUC stock offers many attractive points for long-term investors.
Their value is much better than that of many of their peers, and their debt:cash management is responsible, which is going to be important moving forward.
Their dividend yield may not be as high as most of the stock I post about, but their financial responsibility shows that they are in solid shape for the future.
It is definitely worth taking a closer look at EDUC stock for a long-term investment opportunity!
For Full PDF Report:
*** I DO NOT OWN SHARES OF EDUC STOCK ***