Extra Space Storage, Inc. EXR Stock Analysis

Extra Space Storage, Inc. stock trades under the ticker EXR & has shown recent bullishness that traders & investors may want to look closer into.

EXR stock closed at $158.14/share on 11/18/2022.

Extra Space Storage, Inc. EXR Stock’s Technical Performance Broken Down

Extra Space Storage, Inc. EXR Stock's Technical Performance Over The Last Year

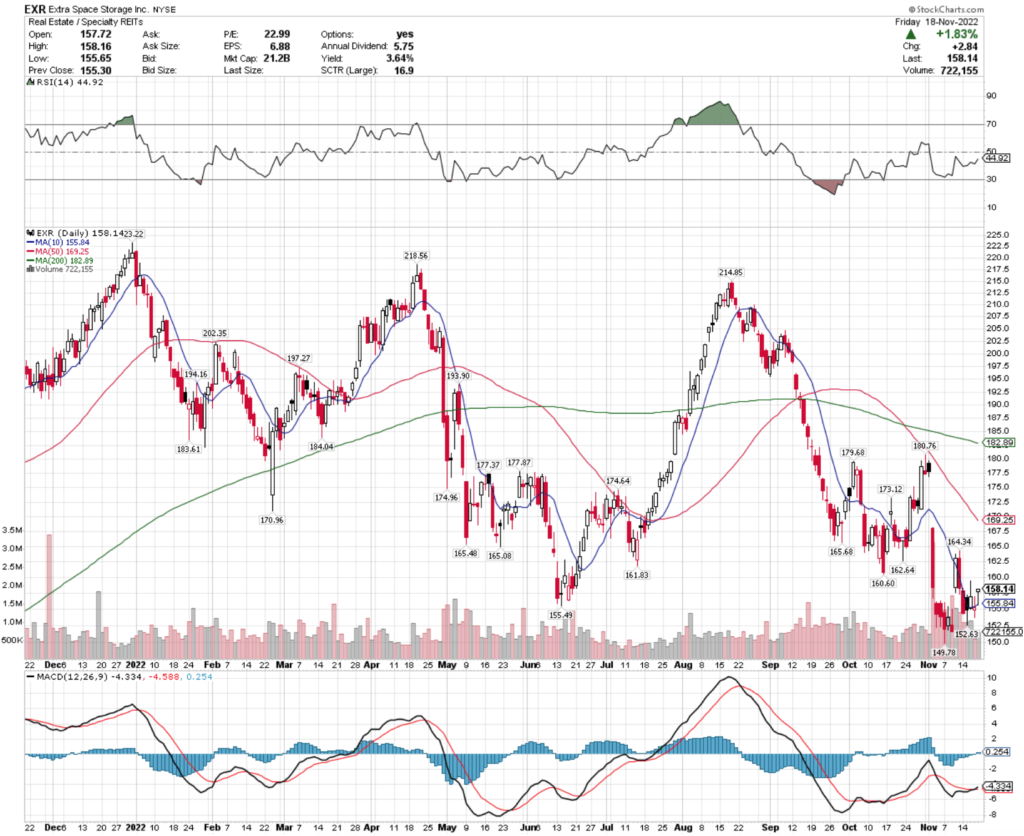
EXR Stock Price: $158.14

10 Day Moving Average: $155.84

50 Day Moving Average: $169.25

200 Day Moving Average: $182.89

RSI: 44.92

MACD: -4.334

On Friday, EXR completed a bullish MACD crossover, closing up 1.83%.

Recent trading volumes have been above average compared to the year before, and their RSI is neutral, signaling that there may be more short-term strength to come.

EXR stock has support at the $155.84 & $152.63/share price level, as they try to break out & above the $160.60 & $161.83/share resistance levels.

Extra Space Storage, Inc. EXR Stock As A Long-Term Investment

Long-term oriented investors will like EXR stock’s 22.95 P/E (ttm), but will find their 6.52 P/B (mrq) to be a bit too rich.

They recently reported 21.2% Quarterly Revenue Growth Y-0-Y, with 17.2% Quarterly Earnings Growth Y-o-Y.

Their balance sheet will require a more thorough review before investing, with a reported $141.97M of Total Cash (mrq) & $7.23B of Total Debt (mrq).

EXR stock pays a 3.7% dividend, which may not be sustainable at such a high level for the long-run, as their payout ratio is 83.45%.

99% of EXR stock’s outstanding share float is owned by institutional investors.

Extra Space Storage, Inc. EXR Stock As A Short-Term Trade Using Options

Short-term focused traders can trade options to profit from EXR stock’s price movements, while hedging against broader market volatility.

I am looking at the contracts with the 12/16 expiration date.

The $155, $150 & $145 calls are all in-the-money, listed from highest to lowest level of open interest.

The $165, $175 & $180 puts are also all in-the-money, with the former being more liquid than the latter two strikes.

Tying It All Together

EXR stock has many interesting charactertistics that traders & investors will find appealing.

Investors will like their dividend yield, but may want to review their balance sheet to see how sustainable it is in the long-run.

Traders will like their recent technical performance, as well as how liquid their options are.

All-in-all, it is worth taking a closer look into EXR stock to see how it fits into your portfolio strategy.

*** I DO NOT OWN SHARES OF EXR STOCK AT THE TIME OF PUBLISHING THIS ARTICLE ***

Gray Television, Inc. GTN Stock Analysis

Gray Television, Inc. stock trades under the ticker GTN & has shown recent bullishness that traders & investors should research further into.

GTN stock closed at $11.28/share on 11/17/2022.

Gray Television, Inc. GTN Stock’s Technical Performance Broken Down

Gray Television, Inc. GTN Stock's Technical Performance Broken Down

GTN Stock Price: $11.28

10 Day Moving Average: $10.28

50 Day Moving Average: $14.69

200 Day Moving Average: $18.56

MACD: -1.249

RSI: 41.36

Yesterday, GTN stock completed a bullish MACD crossover, closing up 1.62%.

Recent trading volumes have been above average compared to the year prior & their RSI is on the oversold end of neutral, signaling that there may be more short-term momentum to come.

GTN stock has support at the $10.28 & $8.61/share price level, while they try to break above the $11.63 & $13.67/share resistance levels.

Gray Television, Inc. GTN Stock As A Long-Term Investment

Long-term oriented investors will like GTN stock’s valuation metrics, with a 4.03 P/E (ttm) & 0.51 P/B (mrq).

They recently reported 51.2% Quarterly Revenue Growth Y-o-Y.

Their balance sheet will require a more thorough review before investing though, with $144M of Total Cash (mrq) & $6.68B of Total Debt (mrq).

GTN stock pays a 2.88% dividend, which appears to be stable in the long-run, as their payout ratio is 12.12%.

90.3% of GTN stock’s outstanding share float is owned by institutional investors.

Gray Television, Inc. GTN Stock As A Short-Term Trade Using Options

Short-term focused traders can use options to hedge their portfolio against volatility, while profiting from underlying moves in GTN stock’s price.

I am looking at the contracts with the 12/16 expiration date.

The $10 & $7.50 call options are both in the money, with the former having more open interest than the latter.

The $12.50 & $15 puts are also all in-the-money, listed from highest to lowest level of open interest.

Tying It All Together

GTN stock has many interesting attributes that traders & investors are sure to find appealing.

Investors will like their dividend yield & valuation metrics, but may want to review the makeup of their balance sheet before investing.

Traders will like their recent technical performance, but may be disappointed by how liquid their options are.

Overall, it is worth taking a closer look into how GTN stock fits into your portfolio strategy.

*** I DO NOT OWN SHARES OF GTN STOCK AT THE TIME OF PUBLISHING THIS ARTICLE ***

Bank of N.T. Butterfield & Son Ltd. NTB Stock Analysis

Bank of N.T. Butterfield & Son Ltd. stock trades under the ticker NTB & has shown recent bullishness that traders & investors should research further into.

NTB stock closed at $33.31/share on 11/16/2022.

Bank of N.T. Butterfield & Son Ltd. NTB Stock’s Technical Performance Broken Down

Bank of N.T. Butterfield & Son Ltd. NTB Stock's Technical Performance Broken Down

NTB Stock Price: $33.31

10 Day Moving Average: $31.74

50 Day Moving Average: $33.03

200 Day Moving Average: $32.81

MACD: -0.291

RSI: 54.08

Yesterday, NTB stock completed a bullish MACD crossover, closing above their 50 & 200 day moving averages.

Recent trading volumes have been about average compared to the year prior, and their RSI is neutral, signaling that there may be more room for them to climb in the near-term.

NTB stock has support at the $33.15 & $33.03/share price levels, as they try to break above their $33.41 & $34.03/share resistance levels.

Bank of N.T. Butterfield & Son Ltd. NTB Stock As A Long-Term Investment

Long-term oriented investors will like NTB stock’s valuation metrics, with a 8.47 P/E (ttm) & a 2.15 P/B (mrq).

They recently reported 12.3% Quarterly Revenue Growth Y-o-Y, with 44.4% Quarterly Earnings Growth Y-o-Y.

Their balance sheet also looks appealing, with $2.38B of Total Cash (mrq) & $206.75M of Total Debt (mrq).

NTB stock pays a 5.37% dividend, which appears to be sustainable in the long-run, as their payout ratio is 45.48%.

72.57% of NTB stock’s outstanding share float is owned by institutional investors.

Bank of N.T. Butterfield & Son Ltd. NTB Stock As A Short-Term Trade Using Options

Traders who are more focused on the short-term can trade options to hedge against market volatility, while still profiting from NTB stock’s price movements.

NTB’s options are not very liquid, but their $35 put that expires on 11/18 is in-the-money.

Their $30 call that expires on 1/20/2023 is also in-the-money.

Tying It All Together

NTB stock has many interest attributes that traders & investors will find appealing.

Investors will like their dividend yield & balance sheet, as well as their recent growth & valuation metrics.

Traders will like their recent technical performance, however they will be disappointed by how illiquid their options are.

Overall, it is worth taking a closer look into how NTB stock fits into your portfolio strategy.

*** I DO NOT OWN SHARES OF NTB STOCK AT THE TIME OF PUBLISHING THIS ARTICLE ***

Walker & Dunlop Inc. WD Stock Analysis

Walker & Dunlop Inc. stock trades under the ticker WD & has shown recent bullishness that traders & investors should research further into.

WD stock closed at $83.40/share on 11/14/2022.

Walker & Dunlop Inc. WD Stock’s Technical Performance Broken Down

Walker & Dunlop Inc. WD Stock's Technical Performance Over The Last Year

WD Stock Price: $83.40

10 Day Moving Average: $83.86

50 Day Moving Average: $88.71

200 Day Moving Average: $108.61

MACD: -1.676

RSI: 45.8

Yesterday, WD stock completed a bullish MACD crossover, after two days of gains late in last week.

Their recent trading volumes has been about average compared to the year prior & their RSI is neutral, signaling that there may be more short-term momentum to come.

WD stock has support at the $82.43 & $81.79/share price levels, as they try to break out & above the $87.48 & $90.83/share resistance levels.

Walker & Dunlop Inc. WD Stock As A Long-Term Investment

Long-term oriented investors will like WD stock’s valuation metrics, with an 11.26 P/E (ttm) & a 1.69 P/B (mrq).

Their recent growth may require a closer examination, with -11.1% Quarterly Revenue Growth Y-o-Y & -34.7% Quarterly Earnings Growth Y-o-Y.

Their balance sheet will also require a more thorough review, with $407.84M of Total Cash (mrq) & $3.28B of Total Debt (mrq).

WD stock pays a 2.71% dividend yield, which appears to be sustainable in the long-run, as their payout ratio is 30.46%.

76.91% of WD stock’s outstanding share float is owned by institutional investors.

Walker & Dunlop Inc. WD Stock As A Short-Term Trade Using Options

Short-term focused traders can trade options to hedge against market volatility, while also profiting from WD stock’s price movements.

I am looking at the contracts with the 11/18 expiration date, as the 12/16 contracts are still less liquid.

The $70, $75 & $80 call options are all in-the-money, listed from highest to lowest level of open interest.

The $95, $100 & $90 puts are also all in-the-money, listed in order of most-to-least liquid strike.

Tying It All Together

WD stock has many interesting characteristics that traders & investors should find appealing.

Investors will like their valuation metrics & dividend, but may want to review their balance sheet in more thorough detail before investing.

Traders will like their recent technical performance, but will be disappointed by how liquid their options are.

All-in-all, it is worth taking a closer look into WD stock to see how it fits into your portfolio strategy.

*** I DO NOT OWN SHARES OF WD STOCK AT THE TIME OF PUBLISHING THIS ARTICLE ***

Newell Brands, Inc. NWL Stock Analysis

Newell Brands, Inc. stock trades under the ticker NWL & has shown recent bullishness that traders & investors may want to research further into.

NWL stock closed at $14.12/share on 11/11/2022.

Newell Brands, Inc. NWL Stock’s Technical Performance Broken Down

Newell Brands, Inc. NWL Stock's Technical Performance Over The Last Year

NWL Stock Price: $14.12

10 Day Moving Average: $13.20

50 Day Moving Average: $14.96

200 Day Moving Average: $19.46

RSI: 49.1

MACD: -0.551

On Friday, NWL stock completed a bullish MACD crossover, completing its second day of gains, up 4.98%.

Recent trading volumes have been above average compared to the year prior, and their RSI is neutral, signaling that they may have more room to run in the near-term.

NWL stock has support at the $13.84 & $13.73/share price levels, as they try to break out above the $14.74 & $16.01/share resistance levels.

Newell Brands, Inc. NWL Stock As A Long-Term Investment

Long-term oriented investors will like NWL stock’s valuation metrics, with a 10.46 P/E (ttm) & a 1.55 P/B (mrq).

They recently reported -19.2% Quarterly Revenue Growth Y-o-Y, with -83.7% Quarterly Earnings Growth Y-o-Y, which prospective investors will want to examine more thoroughly.

Their balance sheet also will warrant some additional review, with $636M of Total Cash (mrq) & $6.51B of Total Debt (mrq).

NWL stock pays a 6.84% dividend, which may not be sustainable at such a high level in the long-run, as their payout ratio is 68.15%.

94.5% of NWL stock’s outstanding share float is owned by institutional investors.

Newell Brands, Inc. NWL Stock As A Short-Term Trade Using Options

Short-term focused traders can use options to profit from NWL stock’s price changes, while hedging against broader market volatility.

I am looking at the contracts with the 12/16 expiration date.

The $14, $13 & $12 call options are all in-the-money, with the former having more open interest than the latter two strikes.

The $17, $18 & $19 puts are also all in-the-money, listed in order of most to least liquid.

Tying It All Together

NWL stock has many interesting attributes that traders & investors will find appealing.

Investors will like their valuation metrics & dividend yield, but may want to review their recent growth & balance sheet metrics in more detail.

Traders will like their current technical performance & how liquid their options are.

Overall, it is worth taking a closer look into NWL stock to see how it fits into your portfolio strategy.

*** I DO NOT OWN SHARES OF NWL STOCK AT THE TIME OF PUBLISHING THIS ARTICLE ***

Avalon Bay Communities, Inc. AVB Stock Analysis

Avalon Bay Communities, Inc. stock trades under the ticker AVB & has shown recent bullish behavior that traders & investors should research further into.

AVB stock closed at $167.11/share on 11/11/2022.

Avalon Bay Communities, Inc. AVB Stock’s Technical Performance Broken Down

Avalon Bay Communities, Inc. AVB Stock's Technical Performance Over The Last Year

AVB Stock Price: $167.11

10 Day Moving Average: $168.00

50 Day Moving Average: $182.42

200 Day Moving Average: $208.37

MACD: -4.532

RSI: 43.57

On Friday, AVB stock completed a bullish MACD crossover, despite closing down 2.74%.

Recent trading volumes have been above average compared to the year prior, and their RSI is on the oversold side of neutral, signaling that there may be more momentum to come in the near-term.

AVB stock has support at the $158.35/share price level, as they try to break above the $168.05 & $170.15/share resistance levels.

Avalon Bay Communities, Inc. AVB Stock As A Long-Term Investment

Investors interested in AVB for the long-term will like their valuation metrics, with an 18.3 P/E (ttm) & a 2.01 P/B (mrq).

They recently reported 20.7% Quarterly Revenue Growth Y-o-Y, with 526.9% Quarterly Earnings Growth Y-0-Y.

Their balance sheet will require some additional research though, with $230.32M of Total Cash (mrq) & $8.18B of Total Debt (mrq).

AVB stock pays a 3.7% dividend, however it may not be sustainable in the long-run, as their payout ratio is 72.3%.

94.41% of AVB stock’s outstanding share float is owned by institutional investors.

Avalon Bay Communities, Inc. AVB Stock As A Short-Term Trade Using Options

Short-term oriented traders can trade options to profit from movements in AVB stock’s price, while hedging against broader market volatility.

I am looking at the contracts with the 12/16 expiration date.

The $165, $160 & $150 call options are all in-the-money, with the former being more liquid than the latter strikes.

The $170, $175 & $190 puts are also all in-the-money, listed from highest to lowest level of open interest per strike.

Tying It All Together

AVB stock has many interesting characteristics that traders & investors will find appealing.

Investors will like their valuation metrics & recent reported growth metrics, but may want to look deeper into their balance sheet.

Traders will like their recent technical performance.

Overall, it is worth taking a closer look into AVB stock to see how it fits into your portfolio strategy.

*** I DO NOT OWN SHARES OF AVB STOCK AT THE TIME OF PUBLISHING THIS ARTICLE ***

Apple, Inc. AAPL Stock Analysis

Apple, Inc. stock trades under the ticker AAPL & has shown recent bullish behavior that investors & traders alike should look further into.

AAPL stock closed at $149.70/share on 11/11/2022.

Apple, Inc. AAPL Stock’s Technical Performance Broken Down

Apple, Inc. AAPL Stock's Technical Performance Over The Last Year

AAPL Stock Price: $149.70

10 Day Moving Average: $143.52

50 Day Moving Average: $147.45

200 Day Moving Average: $155.20

RSI: 54.75

MACD: -1.141

On Friday, AAPL stock completed a bullish MACD crossover, gaining 1.93% in their second consecutive day of gains.

Recent trading volumes have been about average compared to the year prior, and their RSI is neutral, signaling that there may be more momentum to come in the near-term.

AAPL stock has support at the $149.42 $149.31 & $147.30/share price levels, while it attempts to break out & above the $151.28, $151.32 & $152.43/share resistance levels.

Apple, Inc. AAPL Stock As A Long-Term Investment

Long-term oriented investors will like AAPL stock’s P/E (ttm) of 22.74, but will find their P/B (mrq) of 43.61 to be rather steep.

They recently reported 8.1% Quarterly Revenue Growth Y-o-Y, with 0.8% Quarterly Earnings Growth Y-o-Y.

Their balance sheet will require a more thorough examination, with $48.3B of Total Cash (mrq) & $132.48B of Total Debt (mrq).

AAPL stock pays a modest 0.61% dividend, which appears to be stable in the long-run, as their payout ratio is 14.73%.

60.25% of AAPL stock’s outstanding share float is owned by institutional investors.

Apple, Inc. AAPL Stock As A Short-Term Trade Using Options

Short-term focused traders can trade options to profit from price movements in AAPL stock, while protecting their portfolio from volatility.

I am looking at the contracts with the 12/16 expiration date.

The $145, $140 & $135 call options are all in-the-money, listed from highest to lowest level of open interest.

The $150, $160 & $155 puts are also all in-the-money with the former being more liquid than the latter.

Tying It All Together

AAPL stock has many interesting characteristics that traders & investors should research further into.

Investors will like their dividend & P/E (ttm), but may want to look deeper into the makeup of their balance sheet.

Traders will like their recent technical performance, as well as the liquidity of their options.

All-in-all, it is worth taking a closer look into AAPL stock to see how it fits into your portfolio strategy.

*** I DO NOT OWN SHARES OF AAPL STOCK AT THE TIME OF PUBLISHING THIS ARTICLE ***

Equity Residential Property Trust EQR Stock Analysis

Equity Residential Property Trust stock trades under the ticker EQR & has shown recent bullishness that traders & investors should research further into.

EQR stock closed at $63.97/share on 11/10/2022.

Equity Residential Property Trust EQR Stock’s Technical Performance Broken Down

Equity Residential Property Trust EQR Stock's Technical Performance Broken Down

EQR Stock Price: $63.97

10 Day Moving Average: $61.78

50 Day Moving Average: $66.69

200 Day Moving Average: $76.10

RSI: 51.27

MACD: -1.439

Yesterday, EQR stock completed a bullish MACD crossover, gaining 7.19% on the day.

Their recent trading volumes are about average compared to the year prior, and their RSI is still neutral, signaling that there may be additional momentum to come in the near-term.

They have support at the $62.82 & $61.67/share price levels, as they try to break above the $64.09 & $65.58/share resistance levels.

Equity Residential Property Trust EQR Stock As A Long-Term Investment

Long-term oriented investors will like EQR stock’s valuation metrics, with a 21.93 P/E (ttm) & a 2.2 P/B (mrq).

They recently reported 11.5% Quarterly Revenue Growth Y-o-Y, despite -25.2% Quarterly Earnings Growth Y-o-Y, which investors may want to research more into.

Their balance sheet will also require an additional examination, iwth $68.2M of Total Cash (mrq) & $7.81B of Total Debt (mrq).

EQR stock pays a 4.15% dividend, however this may not be sustainable in the long-run, as their payout ratio is 84.95%.

Still, 93.34% of EQR stock’s outstanding share float is owned by institutional investors.

Equity Residential Property Trust EQR Stock As A Short-Term Trade Using Options

Traders who are focused on shorter time frames can use options to profit from price movements in EQR stock, while also hedging against broader market volatility.

I am looking at the contracts with the 12/16 expiration date.

The $62.50 & $60 call options are both in the money, with the former being more liquid than the latter.

The $65, $70 & $72.50 puts are also all in-the-money, listed by highest level of open interest.

Tying It All Together

EQR stock has many interesting attributes that traders & investors will find appealing.

Investors will like their valuation metrics, as well as their dividend yield, but they may want to review their balance sheet structure further before investing, as it may hold clues about the longevity of their dividend.

Traders will like their recent technical performance, but may be disappointed by how liquid their options are.

Overall, it is worth taking a closer look into EQR stock to see how it fits into your portfolio strategy.

*** I DO NOT OWN SHARES OF EQR STOCK AT THE TIME OF PUBLISHING THIS ARTICLE ***

Colliers International Group Inc. CIGI Stock Analysis

Colliers International Group Inc. stock trades under the ticker CIGI & has shown recent bullish behavior that traders & investors should take note of.

CIGI stock closed at $90.28/share on 11/9/2022.

Colliers International Group Inc. CIGI Stock’s Technical Performance Broken Down

Colliers International Group Inc. CIGI Stock's Technical Performance Over The Last Year

CIGI Stock Price: $90.28

10 Day Moving Average: $90.47

50 Day Moving Average: $99.68

200 Day Moving Average: $117.33

RSI: 42.27

MACD: -2.972

Yesterday, CIGI stock completed a bullish MACD crossover, despite settling down 0.19%.

Recent trading volumes have been about average for the past year, and their RSI is on the oversold end of neutral, signaling that there may be more short-term momentum to come in the near-term.

CIGI stock has support at the $89.50 & $87.83/share price levels, as they try to break above the $91.81 & $97.26/share resistance levels.

Colliers International Group Inc. CIGI Stock As A Long-Term Investment

Long-term oriented investors will find CIGI stock’s valuation metrics to be a bit rich, with a 53.35 P/E (ttm) & a 7.94 P/B (mrq).

Investors may also want to look into their income statement a bit deeper, with recently reported 8.4% Quarterly Revenue Growth Y-o-Y & -33.2% Quarterly Earnings Growth Y-o-Y.

Their balance sheet will also require a more thorough examination, with $190.52M of Total Cash (mrq) & $1.87B of Total Debt (mrq).

CIGI stock pays a modest 0.33% dividend, which appears to be stable in the long-run, as their payout ratio is 18.3%.

75.66% of CIGI stock’s outstanding share float is owned by institutional investors.

Colliers International Group Inc. CIGI Stock As A Short-Term Trade Using Options

Short-term focused traders can use options to profit from price movements in CIGI stock, while protecting their portfolio from volatility.

I am looking at the contracts with the 11/18 expiration date.

The $90 & $85 calls are in-the-money, with the former being more liquid than the latter.

The $105, $115 & $110 puts are also all in-the-money, listed from highest to lowest level of open interest.

Tying It All Together

CIGI stock has many interesting characteristics that traders & investors should find appealing.

Investors will like their safe dividend, but may want to look deeper into the structure of their balance sheet.

Traders will like their recent technical performance, but may be disappointed by how liquid their options are.

Overall, it is worth taking a closer look int0 CIGI stock to see how it fits into your portfolio strategy.

*** I DO NOT OWN SHARES OF CIGI STOCK AT THE TIME OF PUBLISHING THIS ARTICLE ***

HanesBrands, Inc. HBI Stock Analysis

HanesBrands, Inc. stock trades under the ticker HBI & has shown recent bullishness that traders & investors should research further into.

HBI stock closed at $7.07/share on 11/7/2022.

HanesBrands, Inc. HBI Stock’s Technical Performance Broken Down

HanesBrands, Inc. HBI Stock's Technical Performance Over The Last Year

HBI Stock Price: $7.07

10 Day Moving Average: $7.04

50 Day Moving Average: $7.83

200 Day Moving Average: $11.44

RSI: 43.21

MACD: -0.295

Yesterday, HBI stock completed a bullish MACD crossover, gaining 1.43%.

Recent trading volumes have been above average compared to the year prior, and their RSI is on the over-sold end of neutral, signaling that there may be additional short-term momentum to come.

HBI stock has support at the $6.91 & $6.63/share price levels, as they try to break out & above the $7.14 & $7.35/share resistance levels.

HanesBrands, Inc. HBI Stock As A Long-Term Investment

Long-term oriented investors will like HBI stock’s 5.45 P/E (ttm), but may find their 3.42 P/B (mrq) to be a bit too rich.

Potential investors will want to research their recent growth performance, with a reported -13.6% Quarterly Revenue Growth Y-o-Y & -28.4% Quarterly Earnings Growth Y-o-Y.

Their balance sheet will require a more thorough analysis, with $247.92M of Total Cash (mrq) & $4.13B of Total Debt (mrq).

HBI stock pays an 8.61% dividend, which appears to be stable in the long-run, as their payout ratio is 46.88%.

92.48% of HBI stock’s outstanding share float is owned by institutional investors.

HanesBrands, Inc. HBI Stock As A Short-Term Trade Using Options

Short-term focused traders can use options to profit from HBI stock’s price movement, while hedging against broader market volatility.

I am looking at the contracts with the 11/18 expiration date.

The $7, $5 & $6 call options are all in-the-money, in order of most to least open interest.

The $8, $9 & $7.50 puts are also all in-the-money, with the former being more liquid than the latter two strikes.

Tying It All Together

HBI stock has many interesting characteristics that traders & investors should find appealing.

Investors will like their dividend yield, but may want to research deeper into the structure of their balance sheet before investing.

Traders will like their recent technical performance, as well as the liquidity of their options.

All-in-all, it is worth taking a closer look into how HBI stock fits into your portfolio strategy.

*** I DO NOT OWN SHARES OF HBI STOCK AT THE TIME OF PUBLISHING THIS ARTICLE ***