Caseys General Store, Inc. CASY Stock Analysis

Caseys General Store, Inc. stock trades under the ticker CASY & has shown recent bullishness that traders & investors should research further into.

CASY stock closed at $229.95/share on 1/17/2023.

Caseys General Store, Inc. CASY Stock’s Technical Performance Broken Down

Caseys General Store, Inc. CASY Stock's Technical Performance Over The Last Year

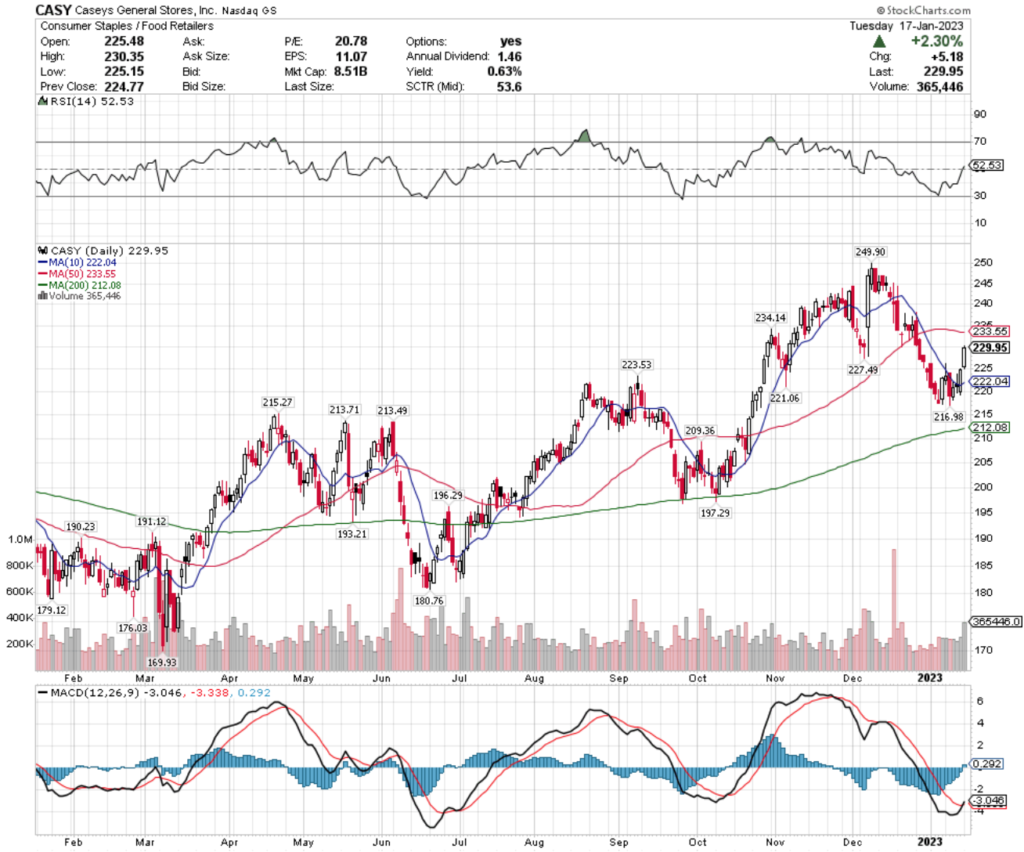
CASY Stock Price: $229.95

10 Day Moving Average: $222.04

50 Day Moving Average: $233.55

200 Day Moving Average: $212.08

RSI: 52.53

MACD: -3.046

Yesterday, CASY stock completed a bullish MACD crossover, gapping up +2.3% for the day’s session.

Recent trading volumes have been about average compared to the year prior, and their RSI is neutral, signaling that they may have more short-term momentum to come.

CASY stock has support at the $227.49 & $223.53/share price level, as they try to break out above the $233.55 & $234.14/share resistance levels.

Caseys General Store, Inc. CASY Stock As A Long-Term Investment

Long-term oriented investors will like CASY stock’s 20.3 P/E (ttm), but will find their 3.33 P/B (mrq) to be a bit higher than they’d like.

They recently reported 21.9% Quarterly Revenue Growth Y-o-Y, with 42.1% Quarterly Earnings Growth Y-o-Y.

Their balance sheet will require a more thorough examination, with $414.8M of Total Cash (mrq) & $1.67B of Total Debt (mrq).

CASY stock pays a 0.65% dividend, which appears to be sustainable in the long-run, as their payout ratio is 13.19%.

87.24% of CASY stock’s outstanding share float is owned by institutional investors.

Caseys General Store, Inc. CASY Stock As A Short-Term Trade Using Options

Traders with shorter time horizons can trade options to profit from CASY stock’s price movements, while protecting their portfolios from volatility.

I am looking at the contracts with the 2/17 expiration date.

The $220, $210 & $195 call options are all in-the-money, listed from highest to lowest level of open interest.

The $230, $240 & $260 puts are also all in-the-money, with the former strikes being more liquid than the latter.

Tying It All Together

CASY stock has many interesting characteristics that traders & investors will find appealing.

Investors will like their recent growth & dividend yield, but may want to look closer into the makeup of their balance sheet.

Traders will like their recent technical performance, but may wish their options were a bit more liquid.

Overall, it is worth taking a closer look into CASY stock to see how it fits into your portfolio strategy.

*** I DO NOT OWN SHARES OR OPTIONS POSITIONS AROUND CASY STOCK AT THE TIME OF PUBLISHING THIS ARTICLE ***

Microsoft Corp. MSFT Stock Analysis

Microsoft Corp. stock trades under the ticker MSFT & has shown recent bullish behavior that traders & investors should research deeper into.

MSFT stock closed at $239.23/share on 1/14/2023.

Microsoft Corp. MSFT Stock’s Technical Performance Broken Down

Microsoft Corp. MSFT Stock's Technical Performance Over The Last Year
Microsoft Corp. MSFT Stock’s Technical Performance Over The Last Year

MSFT Stock Price: $239.23

10 Day Moving Average: $232.52

50 Day Moving Average: $239.84

200 Day Moving Average: $256.79

RSI: 51.68

MACD: -2.601

On Friday, MSFT stock completed a bullish MACD crossover, closing +0.3% on the day.

Despite having decent volume compared to the year prior & 6 straight days of gains, Friday’s hanging man candle implies a bearish movement on the horizon for them, which may offer new entries into positions.

MSFT stock has support at the $233.87 & $232.52/share price level, as they try to break out above the $239.84 & $240.32/share resistance levels.

Microsoft Corp. MSFT Stock As A Long-Term Investment

Long-term oriented investors will like MSFT stock’s 25.75 P/E (ttm), but will find their 10.27 P/B (mrq) to be higher than they’d normally like.

They recently reported 10.6% Quarterly Revenue Growth Y-o-Y, with -14.4% Quarterly Earnings Growth Y-o-Y.

Their balance sheet looks strong, with $107.24B of Total Cash (mrq) & $77.14B of Total Debt (mrq).

MSFT stock pays a 1.06% dividend, which appears to be sustainable in the long-run, with a 26.7% payout ratio.

73.35% of MSFT stock’s outstanding share float is owned by institutional investors.

Microsoft Corp. MSFT Stock As A Short-Term Trade Using Options

Traders who are interested in shorter time frames can use options to profit from MSFT stock’s price movements, while hedging their portfolio against broader market volatility.

I am looking at the contracts with the 2/17 expiration date.

The $235, $230 & $225 calls are all in-the-money, listed in order of highest to lowest level of open interest.

The $240, $245 & $250 puts are also all in-the-money, with the former being more liquid than the latter strikes.

Tying It All Together

MSFT stock has many interesting characteristics that traders & investors should find appealing.

Investors will like their healthy balance sheet & dividend yield.

Traders will like their recent technical performance & their liquid options market.

All-in-all, it is worth taking a closer look into how MSFT stock fits into your portfolio strategy.

*** I DO NOT OWN SHARES OF NOR OPTIONS POSITIONS AROUND MSFT STOCK AT THE TIME OF PUBLISHING THIS ARTICLE ***

Covenant Logistics Corp. CVLG Stock Analysis

Covenant Logistics Corp. stock trades under the ticker CVLG & has shown recent bullish behavior that traders & investors should take a closer look at.

CVLG stock closed at $35.93/share on 1/11/2023.

Covenant Logistics Corp. CVLG Stock’s Technical Performance Broken Down

Covenant Logistics Group, Inc. Stock's Technical Performance Over The Last Year

CVLG Stock Price: $35.93

10 Day Moving Average: $34.68

50 Day Moving Average: $37.03

200 Day Moving Average: $29.06

RSI: 51.24

MACD: -0.619

Yesterday, CVLG stock completed a bullish MACD crossover, rising 0.81% on the day.

Recent trading volumes have been about average compared to the year prior & their RSI is neutral at 51, however their near-term may be volatile with yesterday’s hanging man candlestick (bearish signal).

CVLG stock has support at the $35.70 & $34.69/share price levels, as they try to break out & above the $36.75-8 zone & $37.03 resistance levels.

Covenant Logistics Corp. CVLG Stock As A Long-Term Investment

Long-term investors will like CVLG stock’s valuation metrics, with a 4.73 P/E (ttm) & a 1.20 P/B (mrq).

They recently reported 13.6% Quarterly Revenue Growth Y-o-Y, with 207.1% Quarterly Earnings Growth Y-o-Y.

Their balance sheet will require a more thorough analysis, with $59.26M of Total Cash (mrq) & $134.96M of Total Debt (mrq).

CVLG pays a modest 0.58% dividend, which appears to be very sustainable in the long-run, as their payout ratio is 2.87%.

69.32% of CVLG stock’s outstanding share float is owned by institutional investors.

Covenant Logistics Corp. CVLG Stock As A Short-Term Trade Using Options

Traders who are focused on short-term time frames can trade options to profit from price movements in CVLG stock, while protecting their portfolio from volatility.

I am looking at the contracts with the 3/17 expiration date.

The $30, $35 & $25 calls are all in-the-money, listed from highest to lowest level of open interest.

Currently there is only open interest in the $40 puts, however, other in-the-money strikes may become more liquid after the 1/20 & 2/17 expiration dates pass.

Tying It All Together

CVLG stock has many interesting traits that investors & traders are sure to find appealing.

Investors will like their valuation metrics & the security of their dividend, although its yield is awfully low.

Traders will like their recent technical performance, but may need to wait for more contracts to be written for the 3/17 expiration that are in-the-money after other monthly expiration dates pass.

Overall, it is worth taking a closer look into CVLG stock to see how it fits into your portfolio strategy.

*** I DO NOT OWN SHARES OR OPTIONS POSITIONS OF CVLG STOCK AT THE TIME OF PUBLISHING THIS ARTICLE ***

Ryder Systems, Inc. R Stock Analysis

Ryder Systems, Inc. stock trades under the ticker R & has shown recent bullish behavior that traders & investors should take a closer look into.

R stock closed at $55.53/share on 1/10/2023.

Ryder Systems, Inc. R Stock’s Technical Performance Broken Down

Ryder Systems, Inc. R Stock's Technical Performance Over The Last Year

R Stock Price: $55.53

10 Day Moving Average: $83.63

50 Day Moving Average: $85.92

200 Day Moving Average: $77.25

RSI: 55.53

MACD: -0.534

Yesterday, R stock completed a bullish MACD crossover, rising 2.36% on the day.

Recent trading volumes have been lighter than usual, and their RSI is neutral, signaling that they may face a hard test at the $88/share price level.

R stock has support at the $85.92 & $84.64/share price levels, while they look to break above the $88.09 & $89.34/share resistance levels.

Ryder Systems, Inc. R Stock As A Long-Term Investment

Long-term oriented investors will like R stock’s valuation metrics, with a 5.14 P/E (ttm) & a 1.39 P/B (mrq).

They recently reported 23.4% Quarterly Revenue Growth Y-o-Y, with 78.2% Quarterly Earnings Growth (Y-o-Y).

Their balance sheet will require a more thorough examination, with $456.29M of Total Cash (mrq) & $6.89B of Total Debt (mrq).

R stock pays a 2.8% dividend, which appears to be sustainable in the long-run, as their payout ratio is 14.54%.

86.3% of R stock’s outstanding share float is owned by institutional investors.

Ryder Systems, Inc. R Stock As A Short-Term Trade Using Options

Traders who are focused on shorter time horizons can trade options to profit from price movements in R stock, while protecting their portfolio from volatility.

I am looking at the contracts with the 1/20 expiration date.

The $85, $70 & $75 call options are all in-the-money, listed from most to least liquid strike price.

The $90 & $100 puts are also in-the-money, with the former having more open interest than the latter strike.

Tying It All Together

R stock has many interest characteristics that traders & investors are sure to like.

Investors will like their valuation metrics & dividend yield, but may want to review their balance sheet further before investing.

Traders will like their recent technical performance & the liquidity of their options.

Overall, it is worth taking a closer look into R stock to see how it fits into your portfolio strategy.

*** I DO NOT OWN SHARES OR OPTIONS POSITIONS IN R STOCK AT THE TIME OF PUBLISHING THIS ARTICLE ***

Wabash National Corp. WNC Stock Analysis

Wabash National Corp. stock trades under the ticker WNC & has shown recent bullish behavior that traders & investors should look deeper into.

WNC stock closed at $24.03/share on 1/9/2021.

Wabash National Corp. WNC Stock’s Technical Performance Broken Down

Wabash National Corp. WNC Stock's Technical Performance Over The Past Year

WNC Stock Price: $24.03

10 Day Moving Average: $23.11

50 Day Moving Average: $23.68

200 Day Moving Average: $17.44

RSI: 55.91

MACD: -0.061

Yesterday, WNC stock completed a bullish MACD crossover, gaining 1.14% on the day.

Their RSI is on the overbought side of neutral at 55.91 & their recent trading volumes have been above average compared to the year higher, signaling that if they break above their $24.04 resistance level there may be more short-term bullish momentum.

WNC stock has support at the $23.68 & $23.11/share price levels, as they try to break out above the $24.04 & $26.11/share resistance levels.

Wabash National Corp. WNC Stock As A Long-Term Investment

Long-term focused investors will like WNC stock’s 25.28 P/E (ttm), but may find their 3.16 P/B (mrq) to be a bit rich.

They recently reported 35.8% Quarterly Revenue Growth Y-o-Y, with 228.6% Quarterly Earnings Growth Y-o-Y.

Their balance sheet will require a more thorough examination, with $81.4M of Total Cash (mrq) & $468.09M of Total Debt (mrq).

WNC stock pays a 1.35% dividend, which appears to be sustainable in the long-run, as their payout ratio is 34.04%.

98.2% of WNC stock’s outstanding share float is owned by institutional investors.

Wabash National Corp. WNC Stock As A Short-Term Trade Using Options

Traders with shorter time horizons can trade options to profit from WNC stock’s price movements, while hedging against broader market volatility.

I am looking at the contracts with the 1/20 expiration.

The $20, $22.50 & $15 call options are all in-the-money, listed from highest to lowest level of open interest.

The $25 & $30 puts are also in-the-money, with the former being more liquid than the latter strike price.

Tying It All Together

WNC stock has many interesting attributes that traders & investors are sure to like.

Traders will like their recent technical performance, and their options are liquid enough for trading.

Long-term investors will like their dividend, as well as their valuation metrics, but may want to look deeper into the makeup of their balance sheet.

All-in-all, it is worth taking a closer look at WNC stock to see how it fits into your portfolio strategy.

*** I DO NOT OWN SHARES NOR OPTION POSITIONS IN WNC STOCK AT THE TIME OF PUBLISHING THIS ARTICLE ***

Walmart Inc. WMT Stock Analysis

Walmart Inc. stock trades under the ticker WMT & has shown recent bullishness that traders & investors should research further into.

WMT stock closed at $146.78 on 1/6/2023.

Walmart Inc. WMT Stock’s Technical Performance Broken Down

Walmart Inc. WMT Stock's Technical Performance Over The Last Year

WMT Stock Price: $146.78

10 Day Moving Average: $143.37

50 Day Moving Average: $145.42

200 Day Moving Average: $136.98

RSI: 56.14

MACD: -0.59

On Friday, WMT stock completed a bullish MACD crossover, gapping up 2.45% on the day.

Their RSI is slightly above neutral & recent trading volumes have been below average compared to the year prior, signaling that there is near-term uncertainty in the market about how to value the name.

WMT stock has support at the $145.57 & $145.42/share price levels, as they attempt to break out above the $154.06 & $158.89/share resistance levels.

Walmart Inc. WMT Stock As A Long-Term Investment

Long-term oriented investors may find WMT stock’s valuation metrics to be a bit rich, with a 45.16 P/E (ttm) & a 5.48 P/B (mrq).

They recently reported 8.7% Quarterly Revenue Growth Y-o-Y.

WMT stock’s balance sheet will also require a more thorough review before investing, with $11.59B of Total Cash (mrq) & $68.01B of Total Debt (mrq).

WMT stock pays a 1.56% dividend, which may not be sustainable in the long-term, as their payout ratio is 68.62%.

32.9% of WMT stock’s outstanding share float is owned by institutional investors.

Walmart Inc. WMT Stock As A Short-Term Trade Using Options

Traders who are focused on the short-term can trade options to profit from movements in WMT stock, while hedging their portfolio against volatility.

I am looking at the contracts with the 1/20 expiration date.

The $145, $143 & $144 calls are all in-the-money, listed from highest to lowest level of open interest.

The $150, $147 & $148 puts are also all in-the-money, with the former being more liquid than the latter two strike prices.

Tying It All Together

WMT stock has many interesting characteristics that traders & investors will find appealing.

Investors will like their dividend yield & recent growth, but may want to dig deeper into the makeup of their balance sheet before investing.

Traders will like their recent technical performance & how liquid their options are.

All-in-all, it is worth taking a closer look at WMT stock to see how it fits into your portfolio strategy.

*** I DO NOT OWN SHARES NOR OPTIONS POSITIONS OF WMT STOCK AT THE TIME OF PUBLISHING THIS ARTICLE ***

Movado Group, Inc. MOV Stock Analysis

Movado Group, Inc. stock trades under the ticker MOV & has shown recent bullishness that traders & investors should research further into.

MOV stock closed at $32.31/share on 12/14/2022.

Movado Group, Inc. MOV Stock’s Technical Performance Broken Down

Movado Group, Inc. MOV Stock's Technical Performance Over The Last Year

MOV Stock Price: $32.31

10 Day Moving Average: $31.57

50 Day Moving Average: $31.92

200 Day Moving Average: $32.99

RSI: 53.44

MACD: -0.158

Yesterday, MOV stock completed a bullish MACD crossover, closing +2.02%.

Recent trading volume has been about average compared to the year prior & their RSI is neutral, signaling that they may have more momentum in the near-term.

MOV stock has support at the $32.27 & $32.24/share price levels, as they try to break above the $32.40 & $32.70/share resistance levels.

Movado Group, Inc. MOV Stock As A Long-Term Investment

Long-term oriented investors will like MOV stock’s valuation metrics, with a 7.26 P/E (ttm), along with their 1.5 P/B (mrq).

They recently reported -2.9% Quarterly Revenue Growth Y-o-Y, with -6.7% Quarterly Earnings Growth Y-o-Y.

Their balance sheet also looks appealing, with a reported $187.08M of Total Cash (mrq) & $81.94M of Total Debt (mrq).

MOV stock pays a 4.1% dividend, which appears to be sustainable in the long run, as their payout ratio is 29.21%.

97.8% of MOV stock’s outstanding share float is owned by institutional investors.

Movado Group, Inc. MOV Stock As A Short-Term Trade Using Options

Short-term focused traders can trade options to profit from MOV stock’s price movements, while protecting their portfolios from broader market volatility.

I am looking at the contracts with the 12/16 expiration date, as the 1/20/23 date does not have as much open interest yet, which will change after this week’s expiration.

The $30, $25 & $22.50 call options are all in-the-money, listed from most to least liquid strike.

The $35, $40 & $50 puts are also all in-the-money, with the former having more open interest than the latter.

Tying It All Together

MOV stock has many interesting characteristics that traders & investors are sure to find appealing.

Investors will like their dividend, valuation metrics & balance sheet, but may want to look closer at their recent growth metrics before investing.

Traders will like their recent technical performance, but may be disappointed by how illiquid their options are.

All-in-all, it is worth taking a closer look into MOV stock to see how it fits into your portfolio strategy.

*** I DO NOT OWN SHARES OF MOV STOCK AT THE TIME OF PUBLISHING THIS ARTICLE ***

Clarus Corp. CLAR Stock Analysis

Clarus Corp. stock trades under the ticker CLAR & has shown recent bullish signals that traders & investors should research further into.

CLAR stock closed at $7.77/share on 11/28/2022.

Clarus Corp. CLAR Stock’s Technical Performance Broken Down

Clarus Corp. CLAR Stock's Technical Performance Over The Last Year

CLAR Stock Price: $7.77

10 Day Moving Average: $7.84

50 Day Moving Average: $11.21

200 Day Moving Average: $18.66

RSI: 30.99

MACD: -1.279

Yesterday, CLAR stock completed a bullish MACD crossover, gaining 1.3% on the day.

Recent volumes have been about average compared to the year prior, and their RSI is oversold, signaling that there may be more momentum to come, barring a larger selloff.

CLAR stock has support at the $7.16/share price level, as they look to break out above the $8.06 & $9.55/share resistance levels.

Clarus Corp. CLAR Stock As A Long-Term Investment

Long-term oriented investors will like CLAR stock’s valuation metrics, with a 11.28 P/E (ttm) & a 0.78 P/B (mrq).

They recently reported 6.2% Quarterly Revenue Growth Y-o-Y, with -39.3% Quarterly Earnings Growth Y-o-Y, which prospective investors will want to review before buying.

Their balance sheet will also require a more thorough examination, with $10.37M of Total Cash (mrq) & $182.92M of Total Debt (mrq).

CLAR stock pays a 1.3% dividend, which appears stable in the long-run as their payout ratio is 14.71%.

89% of CLAR stock’s outstanding share float is owned by institutional investors.

Clarus Corp. CLAR Stock As A Short-Term Trade Using Options

Short-term focused traders can trade options to profit from price movements in CLAR stock, while hedging their portfolio against broader market volatility.

I am looking at the contracts with the 12/16 expiration date.

The $7.50 call options are in-the-money, with the $8 & $8.50 out of the money calls also being liquid.

The $10, $8, $9 & $9.50 puts are also all in-the-money, listed from highest to lowest level of open interest.

Tying It All Together

CLAR stock has many interesting characteristics that traders & investors should research further into.

Investors will like their dividend yield, as well as their valuation metrics, but may want to look closer into the markup of their balance sheet.

Traders will like their recent technical performance, but may be disappointed by how illiquid their options are.

Overall, it is worth taking a closer look into CLAR stock to see how it fits into your portfolio strategy.

*** I DO NOT OWN SHARES OF CLAR STOCK AT THE TIME OF PUBLISHING THIS ARTICLE ***

Global Industrial Suppliers GIC Stock Analysis

Global Industrial Suppliers stock trades under the ticker GIC & has shown recent bullishness that traders & investors should research further into.

GIC stock closed at $25.18/share on 11/22/2022.

Global Industrial Suppliers GIC Stock’s Technical Performance Broken Down

Global Industrial Suppliers GIC Stock's Technical Performance Over The Last Year

GIC Stock Price: $25.18

10 Day Moving Average: $24.93

50 Day Moving Average: $27.06

200 Day Moving Average: $30.80

RSI: 45.53

MACD: -0.856

Yesterday, GIC stock completed a bullish MACD crossover, rising 1.49%.

Recent trading volumes have been below average compared to the year prior, and their RSI is on the oversold side of neutral, signaling that there is still uncertainty of how the market values them in the near-term.

GIC stock has support at the $24.93 & $24.05/share price levels, while they try to break above the $25.52 & $26 resistance levels.

Global Industrial Suppliers GIC Stock As A Long-Term Investment

Long-term oriented investors will like GIC stock’s 11.18 P/E (ttm), but may find their 4.66 P/B (mrq) to be a bit rich.

They recently reported 7.6% Quarterly Revenue Growth Y-o-Y, with -12.6% Quarterly Earnings Growth Y-o-Y.

Their balance sheet will require a more detailed review, with $20M of Total Cash (mrq) & $111.5M of Total Debt (mrq).

GIC stock pays a 2.82% dividend, which appears to be sustainable in the long-run, as their payout ratio is 31.53%.

31.43% of GIC stock’s outstanding share float is owned by institutional investors.

Global Industrial Suppliers GIC Stock As A Short-Term Trade Using Options

Short-term focused traders can use options to profit from price movements in GIC stock, while hedging their portfolio against volatility.

I am looking at the contracts with the 12/16 expiration.

The $25 & $22.50 calls are in-the-money.

Their $30 puts are also in-the-money.

Tying It All Together

GIC stock has many unique attributes that traders & investors are sure to find appealing.

Investors will like their dividend & their low P/E (ttm).

Traders will like their recent technical performance, but may be disappointed by how illiquid their options are.

All-in-all, it is worth taking a closer look into GIC stock to see how it fits into your portfolio strategy.

*** I DO NOT OWN SHARES OF GIC STOCK AT THE TIME OF PUBLISHING THIS ARTICLE ***

Southwest Gas Corp. SWX Stock Analysis

Southwest Gas Corp. stock trades under the ticker SWX & has shown recent bullishness that traders & investors should research further into.

SWX stock closed at $68.46/share on 11/21/2022.

Southwest Gas Corp. SWX Stock’s Technical Performance Broken Down

Southwest Gas Corp. SWX Stock's Technical Performance Over The Last Year

SWX Stock Price: $68.46

10 Day Moving Average: $65.46

50 Day Moving Average: $70.79

200 Day Moving Average: $78.09

RSI: 50.81

MACD: -1.414

Yesterday, SWX stock completed a bullish MACD crossover, gaining 2.49% for the day.

Recent trading volumes have been about average compared to the year prior & their RSI is neutral, signaling that there may be more upwards momentum to come in the near-term.

SWX stock has support at the $66.67 & $65.95/share price levels, as they try to break out above the $68.67 & $70.56/share resistance levels.

Southwest Gas Corp. SWX Stock As A Long-Term Investment

Long-term oriented investors will like SWX stock’s valuation metrics, with a 28.43 P/E (ttm) & a 1.31 P/B (mrq).

They recently reported 26.7% Quarterly Revenue Growth Y-o-Y.

Their balance sheet will require a more thorough review, with $175.27M of Total Cash (mrq) & $6.29B of Total Debt (mrq).

SWX pays a 3.64% dividend, which may not be sustainable in the long-run, as their payout ratio is 103.4%.

90.04% of SWX stock’s outstanding share float is owned by institutional investors.

Southwest Gas Corp. SWX Stock As A Short-Term Trade Using Options

Traders focused on the short-term can use options to protect their portfolio from market volatility, while also profiting from price movements in SWX stock.

I am looking at the contracts with the 12/16 expiration date.

The $65 & $60 calls are in-the-money, with the former being more liquid than the latter strike.

The $70, $85, $80 & $75 puts are also in-the-money, listed from highest to lowest level of open interest.

Tying It All Together

SWX stock has many interesting characteristics that traders & investors should take note of.

Investors will like their valuation metrics & dividend yield, but may want to review their balance sheet structure to see how sustainable their dividend is in the long-run.

Traders will like their recent technical performance, but may wish their options were more liquid.

Overall, it is worth taking a closer look into SWX stock to see how it fits into your portfolio structure.

*** I DO NOT OWN SHARES OF SWX STOCK AT THE TIME OF PUBLISHING THIS ARTICLE ***