PJT Partners Inc. PJT Stock Analysis

PJT Partners Inc. stock trades under the ticker PJT & has shown recent bullish behavior that traders & investors should research further into.

PJT stock closed at $68.77/share on 10/3/2022.

PJT Partners Inc. PJT Stock’s Technical Performance Broken Down
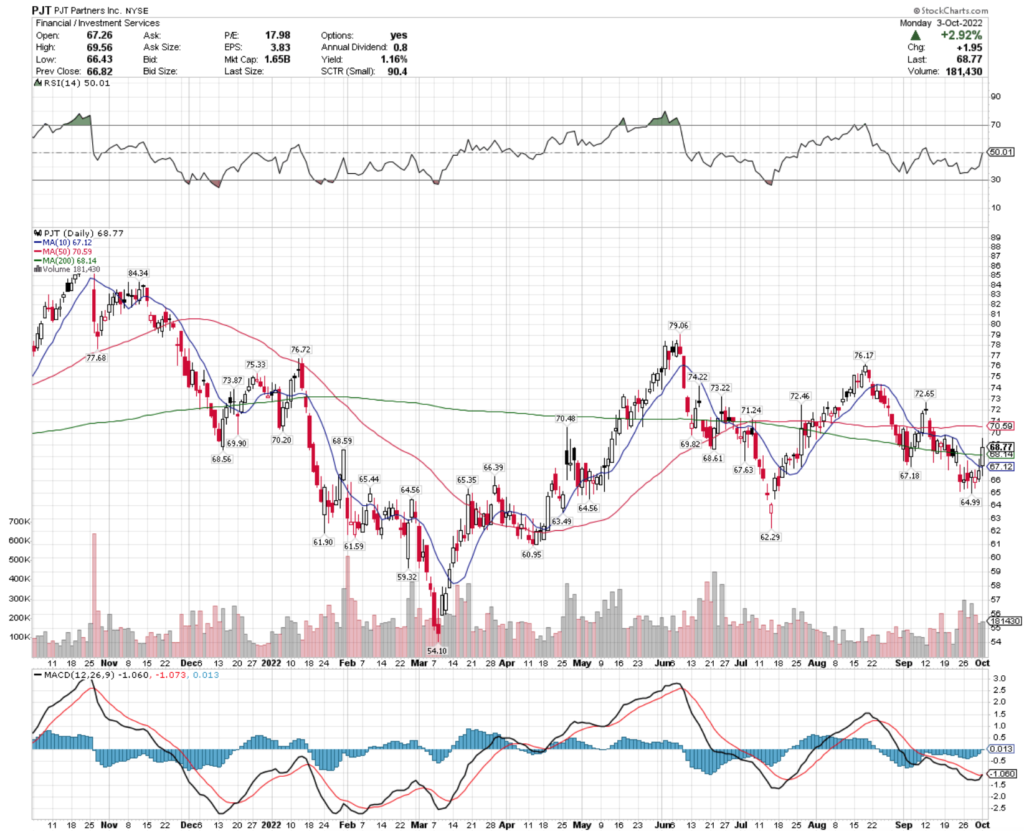
PJT Partners Inc. PJT Stock's Technical Performance Over The Last Year

PJT Stock Price: $68.77

10 Day Moving Average: $67.12

50 Day Moving Average: $70.59

200 Day Moving Average: $68.14

RSI: 50.01

MACD: -1.060

Yesterday, PJT stock completed a bullish MACD crossover, gaining 2.92% by the close of trading.

Recent volumes have been about average compare to the year prior, and their RSI is neutral, signaling that there may be more momentum to come in the near-term.

They have support at the $68.61 & $68.59 price levels, as they try to break out above the $69.82 & $69.90 resistance range.

PJT Partners Inc. PJT Stock As A Long-Term Investment

Long-term oriented investors may find PJT stock’s valuation metrics to be a bit higher than they’d like to see, with a 42.09 P/E (ttm) & a 13.41 P/B (mrq).

Their recently reported growth metrics will also require a more thorough review, with -3.10% Quarterly Revenue Growth Y-o-Y, and -17.2% Quarterly Earnings Growth Y-o-Y.

Their balance sheet looks appealing though, with $147.32M of Total Cash (mrq) & $143.84M of Total Debt (mrq).

PJT stock pays a 0.9% dividend, which appears stable in the long-run, with a 37.8% payout ratio.

71.29% of PJT stock’s outstanding share float is owned by institutional investors.

PJT Partners Inc. PJT Stock As A Short-Term Trade Using Options

Short-term oriented traders can use options to hedge against market volatility, while profiting from moves in PJT stock.

I am looking at the contracts with the 12/16 expiration date.

There are no in-the-money calls at this expiration date, but there is liquidity at the $70, $75 & $80 strike prices.

The $70 puts are in-the-money.

Tying It All Together

PJT stock has many interesting characteristics that traders & investors will like.

Investors will like their dividend yield & balance sheet, but may want to look deeper into their recent growth metrics.

Traders will like their recent technical performance, but will be disappointed at the liquidity of their options.

All-in-all, it is worth taking a closer look into PJT stock to see how it fits into your portfolio strategy.

*** I DO NOT OWN SHARES OF PJT STOCK AT THE TIME OF PUBLISHING THIS ARTICLE ***
Richardson Electronics, LTD. RELL Stock Analysis

Richardson Electronics, Ltd. stock trades under the ticker RELL & has shown recent bullishness that traders & investors should research further into.

RELL stock closed at $15.10/share on 9/30/2022.

Richardson Electronics, LTD. RELL Stock’s Technical Performance Broken Down

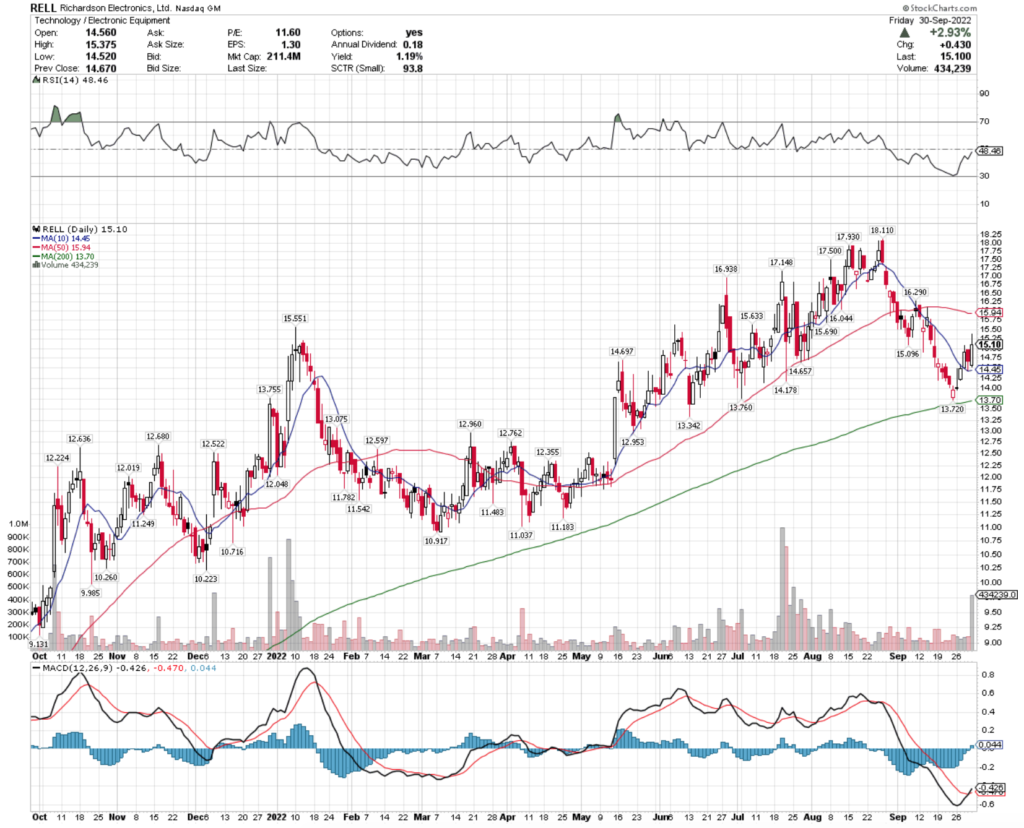
Richardson Electronics, LTD. RELL Stock's Technical Performance Over The Last Year

RELL Stock Price: $15.10

10 Day Moving Average: $14.45

50 Day Moving Average: $15.94

200 Day Moving Average: $13.70

RSI: 48.46

MACD: -0.426

On Friday, RELL stock completed a bullish MACD crossover, gaining 2.93% for the day.

Recent trading volumes have been about average for the last year, and their RSI is neutral, signaling that there may be more near-term strength.

They have support at the $15.096 & $14.697/share price level, while they try to break out above the $15.55 & $15.69/share resistance levels.

Richardson Electronics, LTD. RELL Stock As A Long-Term Investment

Long-term oriented investors will like RELL stock’s valuation metrics, with a 11.53 P/E (ttm) & a 1.54 P/B (mrq).

They recently reported 22.1% Quarterly Revenue Growth Y-o-Y, with 339.4% Quarterly Earnings Growth Y-o-Y.

Their balance sheet looks appealing, with $40.49M of Total Cash (mrq) & Total Debt (mrq) of $3.02M.

RELL stock pays a 1.64% dividend, which appears stable in the long-run, as their payout ratio is 18.32%.

64.52% of RELL stock’s outstanding share float is owned by institutional investors.

Richardson Electronics, LTD. RELL Stock As A Short-Term Trade Using Options

Short-term focused traders can use options to hedge against market volatility, while profiting from price movements in RELL stock.

I am looking at the contracts with the 10/21 expiration date.

The $15, $10 & $12.50 call options are all in-the-money, listed from highest to lowest level of open interest.

The $17.50 puts are also in-the-money, with liquidity at the $15 & $12.50 strikes as well in the event of the downturn.

Tying It All Together

RELL stock has many interesting attributes that traders & investors are sure to like.

Investors will like their dividend yield, balance sheet & valuation metrics.

Traders will like their recent technical performance, but may be disappointed by the liquidity of their options.

All-in-all, it is worth taking a closer look into RELL stock to see how it fits into your portfolio strategy.

*** I DO NOT OWN SHARES OF RELL STOCK AT THE TIME OF PUBLISHING THIS ARTICLE ***
Standard Motor Products Inc. SMP Stock Analysis

Standard Motor Products Inc. stock trades under the ticker SMP & has shown recent bullishness that traders & investors should research further into.

SMP stock closed at $32.49/share on 9/29/2022.

Standard Motor Products Inc. SMP Stock’s Technical Performance Broken Down

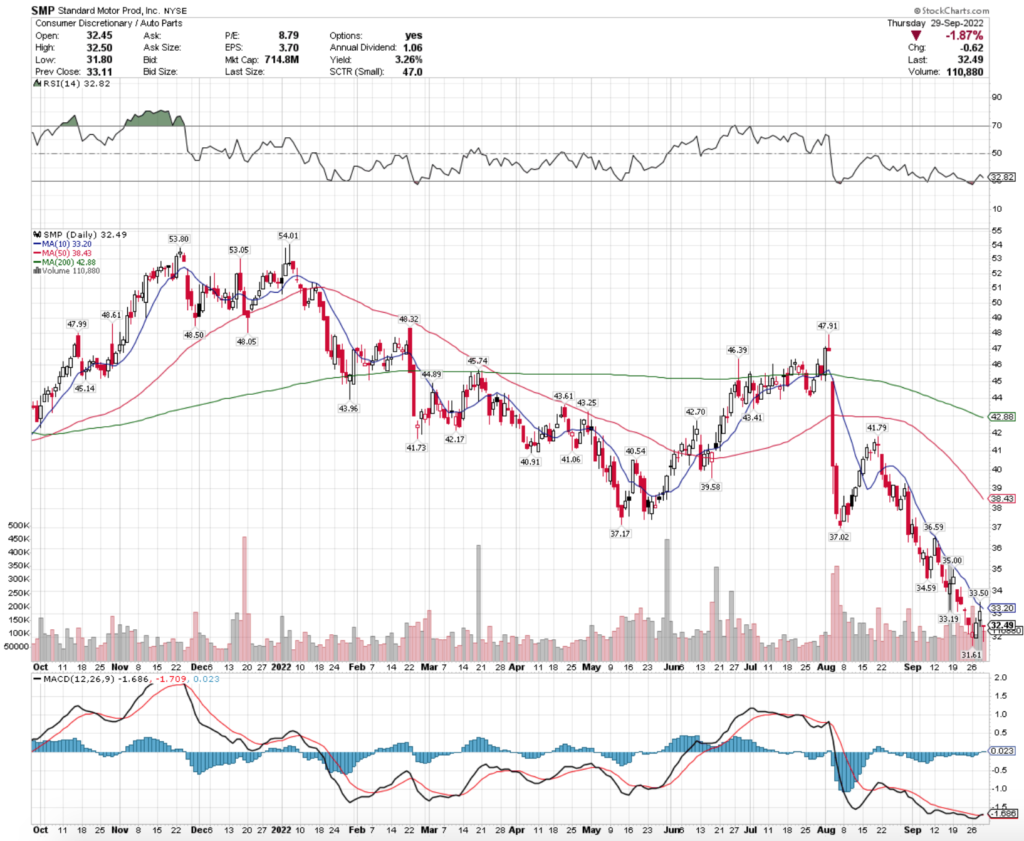
Standard Motor Products Inc. SMP Stock's Technical Performance Over The Last Year

SMP Stock Price: $32.49

10 Day Moving Average: $33.20

50 Day Moving Average: $38.43

200 Day Moving Average: $42.88

RSI: 32.82

MACD: -1.686

Yesterday, SMP stock completed a bullish MACD crossover, despite dropping 1.87% for the day.

Recent trading volumes have been above average compared to the year prior, and their RSI is oversold, signaling that there may be some near-term strength to come, pending how the broader market indexes move.

They have support at the $31.61/share price level, as they try to break out above the $33.19 & $33.50/share resistance levels.

Standard Motor Products Inc. SMP Stock As A Long-Term Investment

Long-term focused investors will like SMP stock’s valuation metrics, with a 8.07 P/E (ttm) & a 1.16 P/B (mrq).

However, they may want to look deeper into their recently reported 5.1% Quarterly Revenue Growth Y-o-Y, but -29.5% Quarterly Earnings Growth Y-o-Y.

Their balance sheet will also require some further review, with $14.19M of Total Cash (mrq) & $308.62M of Total Debt (mrq).

SMP stock pays a 3.2% dividend, which appears stable in the long-run, as their payout ratio is 25.81%.

79.93% of SMP stock’s outstanding share float is owned by institutional investors.

Standard Motor Products Inc. SMP Stock As A Short-Term Trade Using Options

Short-term oriented traders can use options to hedge against market volatility, while profiting from price movements in SMP stock’s price.

I am looking at the contracts with the 10/21 expiration date.

There are currently no calls in-the-money, but the $35 strike does have open interest (although limited).

The $35 puts are in-the-money, signaling that the overall sentiment towards SMP at the moment is bearish, which is confirmed by there only being one support level for the stock over the last year.

Tying It All Together

SMP stock has many interesting characteristics that traders & investors should find appealing.

Investors will like their valuation metrics & dividend yield, but may want to look deeper into the structure of their balance sheet.

Traders will be disappointed by how illiquid their options are currently, but will like the way that they perform in volatile markets as a small cap value name.

Overall, it is worth taking a closer look into SMP stock to see how it fits into your portfolio strategy.

*** I DO NOT OWN SHARES OF SMP STOCK AT THE TIME OF PUBLISHING THIS ARTICLE ***
Sapiens Intl Corp. N.V. SPNS Stock Analysis

Sapiens Intl Corp. N.V. stock trades under the ticker SPNS & has shown recent bullishness that traders & investors should take a closer look into.

SPNS stock closed at $20.07/share on 9/27/2022.

Sapiens Intl Corp. N.V. SPNS Stock’s Technical Performance Broken Down

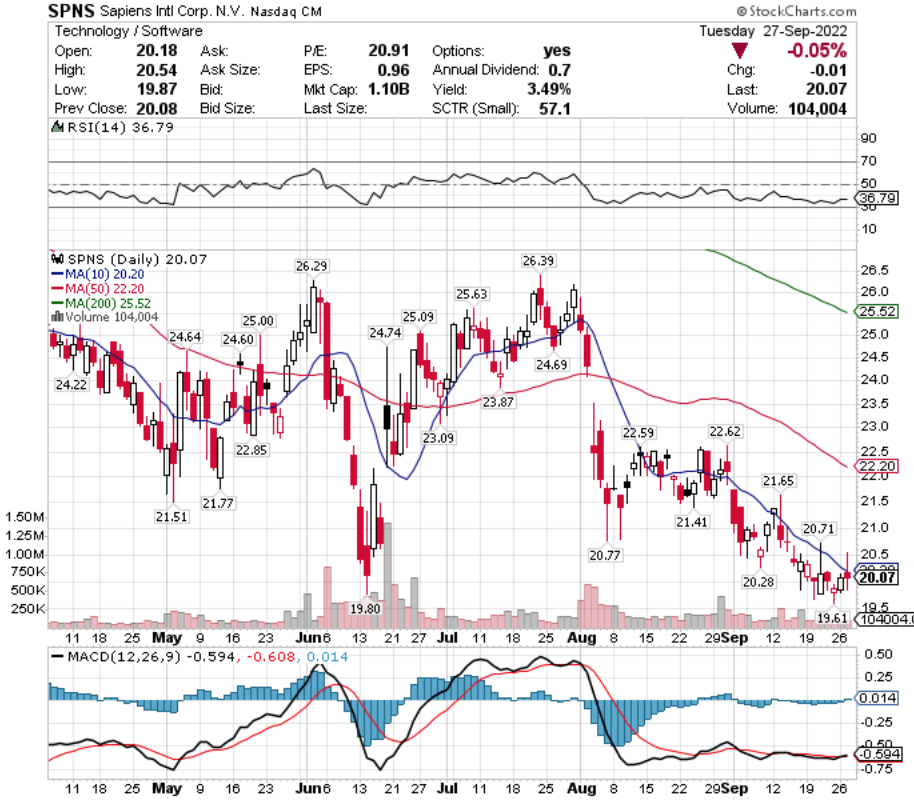
Sapiens Intl Corp. N.V. SPNS Stock's Technical Performance Over The Last Year

SPSN Stock Price: $20.07

10 Day Moving Average: $20.20

50 Day Moving Average: $22.20

200 Day Moving Average: $25.52

RSI: 36.79

MACD: -0.594

Yesterday, SPSN stock completed a bullish MACD crossover, despite settling -0.5% for the day.

Recent trading volumes have been about average compared to the year prior, and their RSI is oversold, signaling that there may be near-term strength to come.

They have support at the $19.80 & $19.61/share price levels, as they try to break above the $20.28 & $20.71/share resistance levels.

Sapiens Intl Corp. N.V. SPNS Stock As A Long-Term Investment

Long-term oriented investors will like SPNS stock’s 20.94 P/E (ttm), but may find their 2.88 P/B (mrq) to be a bit too rich.

They recently reported 3.7% Quarterly Revenue Growth Y-o-Y, with 14.5% Quarterly Earnings Growth Y-o-Y.

Their balance sheet looks appealing, with $176.13M of Total Cash (mrq) & $120.53M of Total Debt (mrq).

SPNS stock pays a 1.15% dividend yield, which appears stable in the long-run, as their payout ratio is 49.47%.

23.9% of SPNS stock’s outstanding share float is owned by institutional investors.

Sapiens Intl Corp. N.V. SPNS Stock As A Short-Term Trade Using Options

Short-term focused traders can trade options to hedge against market volatility, while profiting from price movements in either direction by SPNS stock.

I am looking at the contracts with the 10/21 expiration date.

The $20, $17.50 & $15 calls are all in-the-money, listed from most to least open interest.

The $25, $22.50 & $35 puts are also all in-the-money, with the former being more liquid than the latter strikes.

Tying It All Together

SPNS stock has many interesting attributes that traders & investors are both sure to like.

Investors will like their dividend yield & balance sheet, as well as their recent growth.

Traders will like their recent technical performance, but may wish their options were more liquid.

All-in-all, it is worth taking a closer look into SPNS stock to see how it fits into your portfolio strategy.

*** I DO NOT OWN SHARES OF SPNS STOCK AT THE TIME OF PUBLISHING THIS ARTICLE ***
Lockheed Martin Corp. LMT Stock Analysis

Lockheed Martin Corp. stock trades under the ticker LMT & has shown recent bullishness that traders & investors should research further into.

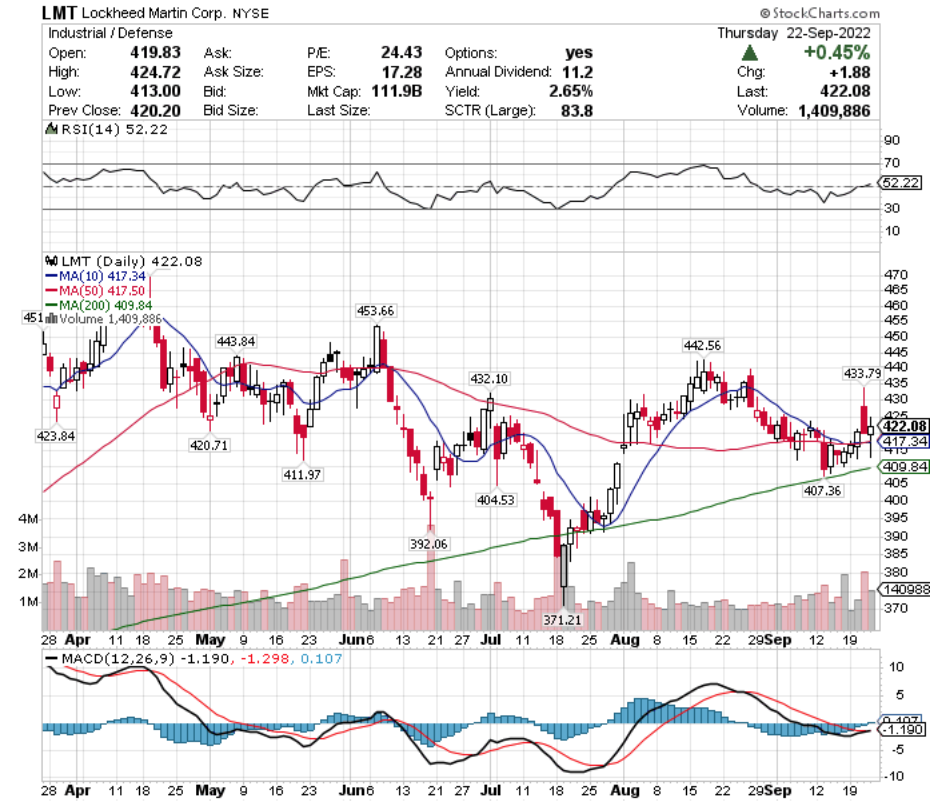
LMT stock closed at $422.08/share on 9/22/2022.

Lockheed Martin Corp. LMT Stock’s Technical Performance Broken Down

Lockheed Martin Corp. LMT Stock's Technical Performance Over The Last Year

LMT Stock Price: $422.08

10 Day Moving Average: $417.34

50 Day Moving Average: $417.50

200 Day Moving Average: $409.83

RSI: 52.22

MACD: -1.19

Yesterday, LMT stock completed a bullish MACD crossover, closing above its 10 & 50 day moving averages.

Recent trading volumes have been about average compared to the year prior, and their RSI is neutral, signaling that there may be more near-term momentum to come.

They have support at $420.71 & $411.97/share, as they try to break out above the $423.84 & $432.10/share resistance levels.

Lockheed Martin Corp. LMT Stock As A Long-Term Investment

Long-term investors will like LMT stock’s 24.08 P/E (ttm), but will find their 9.66 P/B (mrq) to be very high.

They recently reported -9.3% Quarterly Revenue Growth Y-o-Y, with -83% Quarterly Earnings Growth Y-o-Y, which investors should dig deeper into before investing.

Their balance sheet may also require a more thorough examination, with $1.78B of Total Cash (mrq) & $11.64B of Total Debt (mrq).

LMT stock pays a 2.62% dividend, which may not be sustainable in the long-run, as their payout ratio is 63.58%.

76.1% of LMT stock’s outstanding share float is owned by institutional investors.

Lockheed Martin Corp. LMT Stock As A Short-Term Trade Using Options

Short-term focused traders can use options for protection from market volatility, while also profiting from movements in LMT stock.

I am looking at the contracts with the 10/21 expiration date.

The $420, $415 & $417.50 calls are all in-the-money, listed from most to least open interest.

The $425, $430 & $432.50 puts are also all in-the-money, with the former being more liquid than the latter.

Tying It All Together

LMT stock has many interesting characteristics that traders & investors are sure to find appealing.

Investors will like their dividend yield, but may want to look deeper into how sustainable it is, as well as how their balance sheet is structured.

Traders will like their recent technical performance, as well as the liquidity of their options.

Overall, it is worth taking a closer look into LMT stock to see how it fits into your portfolio strategy.

*** I DO NOT OWN SHARES OF LMT STOCK AT THE TIME OF PUBLISHING THIS ARTICLE ***
Philip Morris Intl. Inc. PM Stock Analysis

Philip Morris Intl. Inc. stock trades under the ticker PM & has shown recent bullishness that traders & investors should research further into.

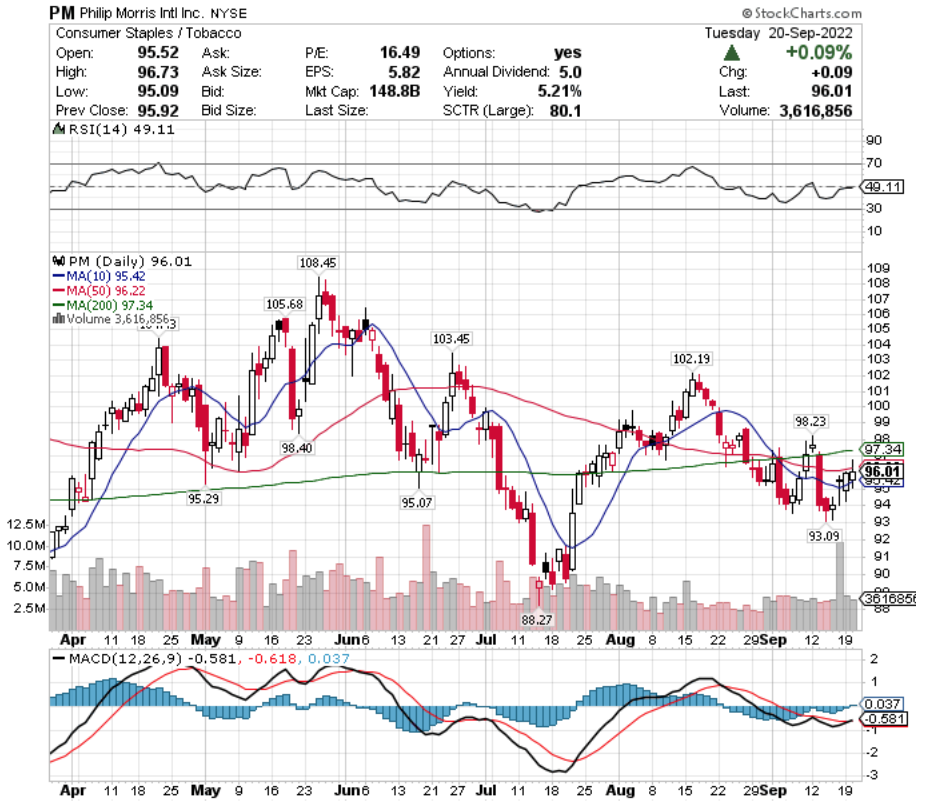
PM stock closed at $96.01/share on 9/20/2022.

Philip Morris Intl. Inc. PM Stock’s Technical Performance Broken Down

Philip Morris Intl Inc. PM Stock's Technical Performance Over The Last Year

PM Stock Price: $96.01

10 Day Moving Average: $95.42

50 Day Moving Average: $96.22

200 Day Moving Average: $97.34

RSI: 49.11

MACD: -0.581

Yesterday, PM stock completed a bullish MACD crossover, settling just below its 50 day moving average.

Recent trading volumes have been below average compared to the year prior, and their RSI is neutral, signaling that there is still uncertainty among market participants about PM stock’s proper valuation.

They have support at the $95.29 & $95.07/share price levels, as they try to break above the $98.23 & $102.19/share resistance levels.

Philip Morris Intl. Inc. PM Stock As A Long-Term Investment

Investors will like PM stock’s 16.39 P/E (ttm), but may be disappointed that they do not have a positive P/B (mrq).

They recently reported 3.1% Quarterly Revenue Growth Y-o-Y, with 2.8% Quarterly Earnings Growth Y-o-Y.

Their balance sheet may warrant a closer review before making an investment, with $5.04B of Total Cash (mrq) & $28.05B of Total Debt (mrq).

PM stock pays a 5.21% dividend, which may not be sustainable in the long-run, as their payout ratio is 85.76%.

76.66% of PM stock’s outstanding share float is owned by institutional investors.

Philip Morris Intl. Inc. PM Stock As A Short-Term Trade Using Options

Short-term focused traders can use options to hedge their exposure to volatility, while profiting from price movements in PM stock.

I am looking at the contracts with the 10/21 expiration date.

The $95, $92.50 & $96 call options are all in-the-money, listed from highest to lowest level of open interest.

The $97.50 & $100 puts are also in-the-money, with the former being more liquid than the latter.

Tying It All Together

PM stock has many interesting characteristics that traders & investors are sure to find appealing.

Investors will like their recent growth, and their dividend yield if it proves to be sustainable.

Traders will like their current technical performance, as well as their weekly options expirations.

All-in-all, it is worth taking a closer look into PM stock to see how it fits into your portfolio strategy.

*** I DO NOT OWN SHARES OF PM STOCK AT THE TIME OF PUBLISHING THIS ARTICLE ***
Marten Transport Ltd. MRTN Stock Analysis

Marten Transport Ltd. stock trades under the ticker MRTN & has shown recent bullishness that traders & investors should research further into.

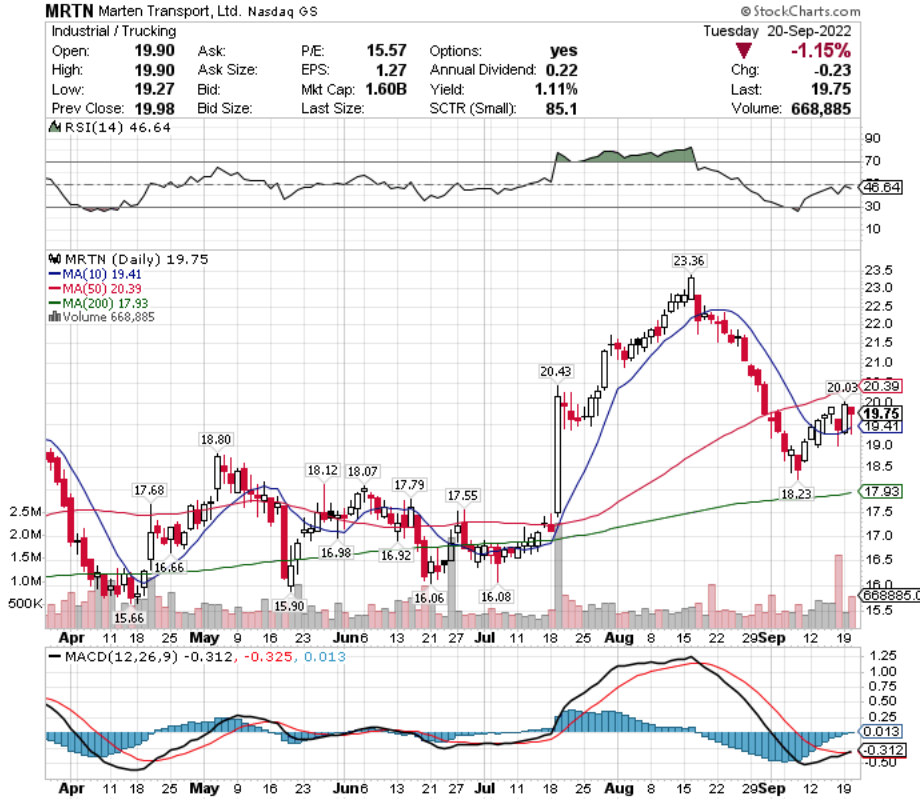
MRTN stock closed at $19.85/share on 9/20/2022.

Marten Transport Ltd. MRTN Stock’s Technical Performance Broken Down

Marten Transport Ltd. MRTN Stock's Technical Performance Over The Last Year

MRTN Stock Price: $19.75

10 Day Moving Average: $19.41

50 Day Moving Average: $20.39

200 Day Moving Average: $17.93

RSI: 46.64

MACD: -0.312

Yesterday, MRTN stock completed a bullish MACD crossover, despite closing down 1.15%.

Recent trading volumes have been above average & their RSI is neutral, signaling that there may be more near-term momentum for MRTN stock.

They have support at the $18.80 & $18.23/share price levels, as they try to break out & above the $20.03 & $20.43/share resistance levels.

Marten Transport Ltd. MRTN Stock As A Long-Term Investment

Long-term oriented investors will like MRTN stock’s valuation metrics, with a 15.24 P/E (ttm) & a 2.38 P/B (mrq).

They recently reported 41.8% Quarterly Revenue Growth Y-o-Y, with 47.8% Quarterly Earnings Growth Y-o-Y.

Their balance sheet looks greatly appealing, with $68.37M of Total Cash (mrq) & $521K of Total Debt (mrq).

MRTN stock pays a 1% dividend, which appears stable in the long-run, as their payout ratio is 15.75%.

71.57% of MRTN stock’s outstanding share float is owned by institutional investors.

Marten Transport Ltd. MRTN Stock As A Short-Term Trade Using Options

Short-term focused traders can use options to profit from movements in MRTN stock’s price, while protecting their portfolios from volatility.

I am looking at the contracts with the 10/21 expiration date.

The $17.50 call options are in-the-money, with the next 4 strike prices all having open interest but being out of the money.

The $20 & $22.50 puts are also in-the-money, listed from most to least liquid strike.

Tying It All Together

MRTN stock has many interesting characteristics that traders & investors are sure to find appealing.

Investors will like their dividend yield & balance sheet, as well as their recent growth.

Traders will like their recent technical performance, but may be disappointed at how liquid their options are.

All-in-all, it is worth taking a closer look into how MRTN stock fits into your portfolio strategy.

*** I DO NOT OWN SHARES OF MRTN STOCK AT THE TIME OF PUBLISHING THIS ARTICLE ***
Fox Corporation FOX Stock Analysis

Fox Corporation stock trades under the ticker FOX & has shown recent bullishness that traders & investors should take a closer look into.

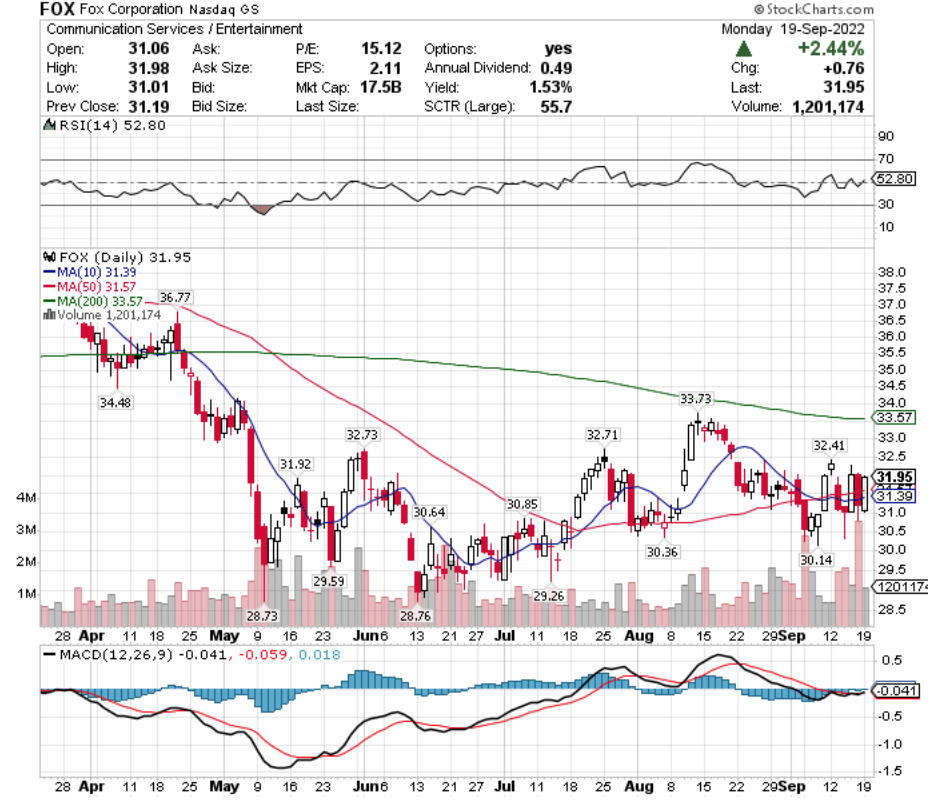
FOX stock closed at $31.95/share on 9/19/2022.

Fox Corporation FOX Stock’s Technical Performance Broken Down

Fox Corporation FOX Stock's Technical Performance Over The Last Year

FOX Stock Price: $31.95

10 Day Moving Average: $31.39

50 Day Moving Average: $31.57

200 Day Moving Average: $33.57

RSI: 52.8

MACD: -0.041

Yesterday, FOX stock completed a bullish MACD crossover, settling just above its 50 day moving average.

Recent trading volumes have been above average compared to the year prior & their MACD is neutral, signaling that there may be a short-term momentum pump in the near-term (depending on macro market conditions).

They have support at $31.92 & $30.85/share as they try to break out & above the $32.41 & $32.71/share resistance levels.

Fox Corporation FOX Stock As A Long-Term Investment

Long-term oriented investors will like FOX stock’s valuation metrics, with a 14.78 P/E (ttm) & a 1.51 P/B (mrq).

They recently reported 4.9% Quarterly Revenue Growth Y-o-Y, with 20.9% Quarterly Earnings Growth Y-o-Y.

Their balance sheet also looks appealing, with $5.2B of Total Cash (mrq) & $7.72B of Total Debt (mrq).

FOX stock pays a 1.54% dividend, which appears stable in the long-run, as their payout ratio is 22.75%.

56.65% of FOX stock’s outstanding share float is owned by institutional investors.

Fox Corporation FOX Stock As A Short-Term Trade Using Options

Short-term focused traders can use options to profit from FOX stock’s price movements, while hedging their portfolio against volatility.

I am looking at the contracts with the 10/21 expiration date.

The $30 call options are in-the-money.

The $35 puts are also in-the-money.

There are other liquid strikes for calls & puts, however none of them are currently in-the-money.

Tying It All Together

FOX stock has many interesting attributes that traders & investors should research further into.

Investors will like their dividend yield, as well as their valuation metrics, and will find their balance sheet to be healthier than many alternatives.

Traders will like their current technical resilience, but may be disappointed in the liquidity of their options.

All-in-all, it is worth taking a closer look into FOX stock to see how it fits into your portfolio strategy.

*** I DO NOT OWN SHARES OF FOX STOCK AT THE TIME OF PUBLISHING THIS ARTICLE ***
Chesapeake Utilities Corp. CPK Stock Analysis

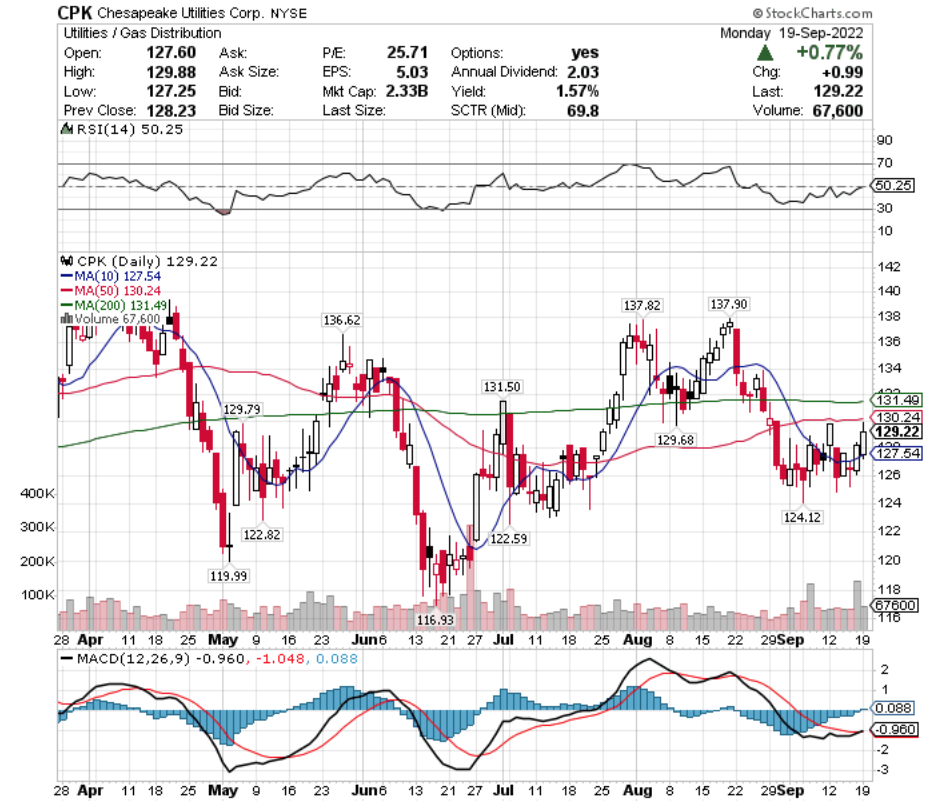
Chesapeake Utilities Corp. stock trades under the ticker CPK & has shown recent bullishness that traders & investors should research further into.

CPK stock closed at $129.22/share on 9/19/2022.

Chesapeake Utilities Corp. CPK Stock’s Technical Performance Broken Down

Chesapeake Utilities Corp. CPK Stock's Technical Performance Over The Last Year

CPK Stock Price: $129.22

10 Day Moving Average: $127.54

50 Day Moving Average: $130.24

200 Day Moving Average: $131.49

RSI: 50.25

MACD: -0.96

Yesterday, CPK stock completed a bullish MACD crossover, settling ~1% below its 50 day moving average.

Recent trading volumes have been about average compared to the year prior, and their RSI is neutral, signaling that there may be more upwards momentum in the near-term.

They have support at the $124.12 & $122.82/share price level, as they try to break above the $129.68 & $131.50/share resistance levels.

Chesapeake Utilities Corp. CPK Stock As A Long-Term Investment

Long-term oriented investors will like CPK stock’s valuation metrics, with a 25.54 P/E (ttm) & a 2.79 P/B (mrq).

They recently reported 25.6% Quarterly Revenue Growth Y-o-Y, with 23.4% Quarterly Earnings Growth Y-o-Y.

Their balance sheet will require a closer review before investing, with $4.19M of Total Cash (mrq) & $760.61M of Total Debt (mrq).

CPK stock pays a 1.54% dividend, which appears stable in the long-run, as their payout ratio is 39.34%.

75.93% of CPK stock’s outstanding share float is owned by institutional investors.

Chesapeake Utilities Corp. CPK Stock As A Short-Term Trade Using Options

Short-term focused traders can use options to profit from CPK stock’s price movements, while protecting their portfolio from market volatility.

I am looking at the contracts with the 12/16 expiration date.

The $125 calls are in-the-money, with the $130 & $140 also having open interest, but being out-of-the-money.

The $130 puts are also in-the-money.

I expect to see more open interest levels as time passes, but the October & November expiration dates are also both very illiquid.

Tying It All Together

CPK stock has many interesting characteristics that traders & investors are sure to find appealing.

Investors will like their dividend yield & valuation metrics, but may want to research their balance sheet structure more thoroughly.

Traders will like their current technical resilience, but will be disappointed by the liquidity of their options.

All-in-all, it is worth taking a closer look into how CPK stock fits into your portfolio strategy.

*** I DO NOT OWN SHARES OF CPK STOCK AT THE TIME OF PUBLISHING THIS ARTICLE ***
Bank of Hawaii Corp. BOH Stock Analysis

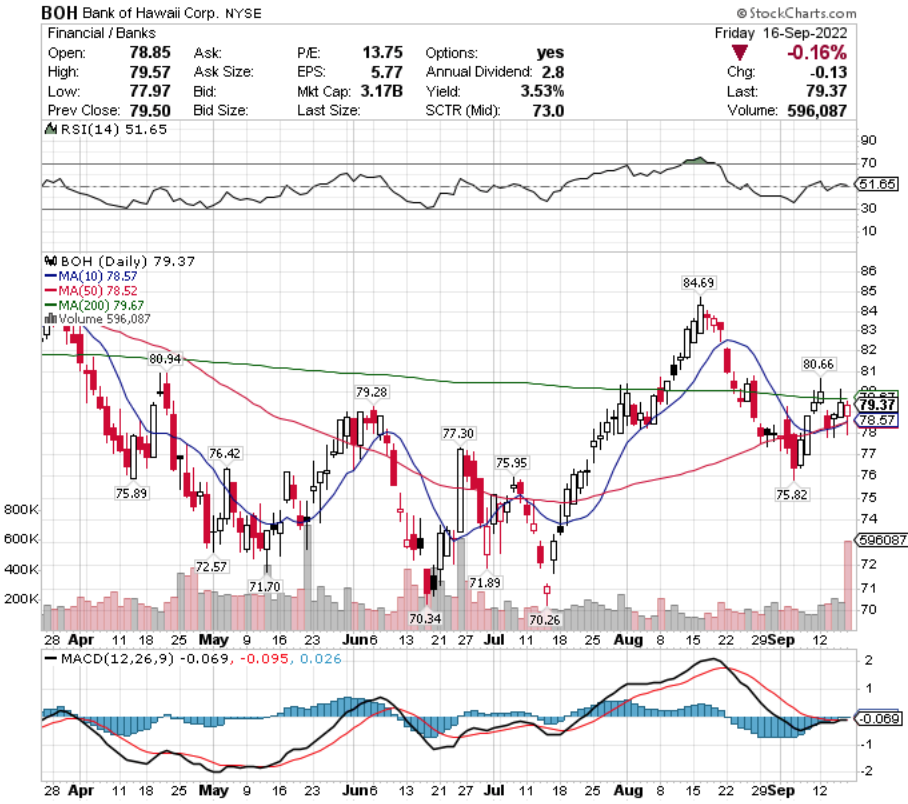
Bank of Hawaii Corp. stock trades under the ticker BOH & has shown recent bullish behavior that traders & investors should research further into.

BOH stock closed at $79.37/share on 9/16/2022.

Bank of Hawaii Corp. BOH Stock’s Technical Performance Broken Down

Bank of Hawaii Corp. BOH Stock's Technical Performance Over The Last Year

BOH Stock Price: $79.37

10 Day Moving Average: $78.57

50 Day Moving Average: $78.52

200 Day Moving Average: $79.67

RSI: 51.65

MACD: -0.069

On Friday, BOH stock completed a bullish MACD crossover, despite settling down -0.16%.

Recent trading volumes have been about average compared to the year prior, and their RSI is still neutral, signaling that there is still uncertainty about where the market values BOH’s shares.

They have support at the $79.28 & $77.30/share price levels, as they try to break above the $80.66 & $80.94/share resistance levels.

Bank of Hawaii Corp. BOH Stock As A Long-Term Investment

Long-term focused investors will like BOH stock’s 13.76 P/E (ttm) & 2.73 P/B (mrq).

They recently reported -3.5% Quarterly Revenue Growth Y-o-Y, with -15.8% Quarterly Earnings Growth Y-o-Y, which investors may want to look closer into before investing.

Their balance sheet looks appealing, with $861.86M of Total Cash (mrq) & $643.22M of Total Debt (mrq).

BOH pays a 3.52% dividend, which appears stable in the long-run, as their payout ratio is 48.53%.

77.1% of BOH stock’s outstanding share float is owned by institutional investors.

Bank of Hawaii Corp. BOH Stock As A Short-Term Trade Using Options

Short-term oriented traders can use options to profit from movements in BOH stock’s price, while providing protection for their portfolio against market volatilty.

I am looking at the contracts with the 10/21 expiration date.

The $75 & $70 call options are in-the-money, listed from most to least liquid.

Currently, only the $80 puts are in-the-money, with open interest also at the $75 & $70 strike prices should their price fall in the coming weeks

Tying It All Together

BOH stock has many interesting attributes that traders & investors alike are sure to find interesting.

Investors will like their balance sheet & dividend yield, but may want to look deeper into their recent growth metrics.

Traders will like their current technical performance, but may be disappointed in the liquidity of their options.

All-in-all, it is worth taking a closer look into BOH stock to see how it fits into your portfolio strategy.

*** I DO NOT OWN SHARES OF BOH STOCK AT THE TIME OF PUBLISHING THIS ARTICLE ***