Humana, Inc. HUM Stock Analysis

Humana, Inc. stock trades under the ticker HUM & has shown recent bullishness that traders & investors should research further into.

HUM stock closed at $499.79/share on 9/16/2022.

Humana, Inc. HUM Stock’s Technical Performance Broken Down

Humana, Inc. HUM Stock's Technical Performance Over The Last Year

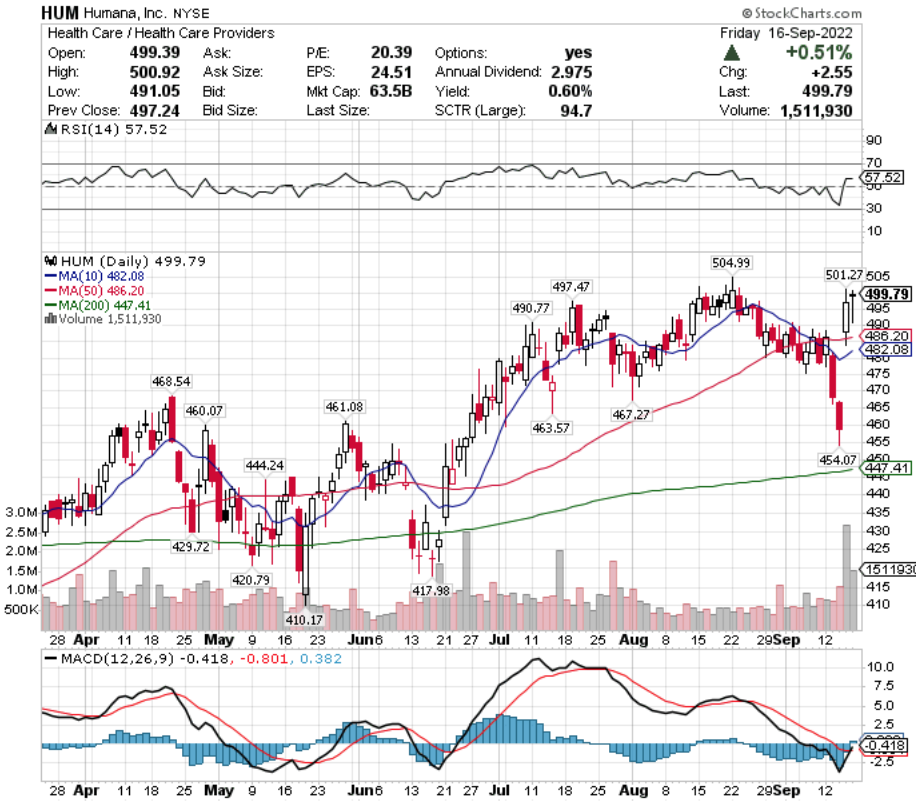
HUM Stock Price: $499.79

10 Day Moving Average: $482.08

50 Day Moving Average: $486.20

200 Day Moving Average: $447.41

RSI: 57.52

MACD: -0.418

On Friday, HUM stock completed a bullish MACD crossover, for a second consecutive day of gains.

Recent trading volumes have been above average, and their RSI is on the overbought end of neutral, signaling that there may be more short-term momentum to come for HUM.

They have support at the $497.47 & $490.77/share price levels, as they try to break above the $501.27 & $504.99/share resistance levels.

Humana, Inc. HUM Stock As A Long-Term Investment

Long-term oriented investors will find HUM stock’s 20.4 P/E (ttm) to be appealing, but may find their 4.08 P/B (mrq) to be a bit too rich.

They recently reported 14.6% Quarterly Revenue Growth Y-o-Y, with 18.4% Quarterly Earnings Growth Y-o-Y.

Their balance sheet looks appealing, with $18.19B of Total Cash (mrq) & $13.22B of Total Debt (mrq).

HUM stock pays a 0.6% dividend, which appears stable in the long-run, as their payout ratio is 12.14%.

96.56% of HUM stock’s outstanding share float is owned by institutional investors.

Humana, Inc. HUM Stock As A Short-Term Trade Using Options

Short-term focused traders can use options to profit from HUM stock’s price movements, while protecting their portfolio from volatility.

I am looking at the contracts with the 10/21 expiration date.

The $490 & $495 call options are all in-the-money, with the former being more liquid than the latter.

The $500 & $505 puts are also in-the-money, listed in order of most to least open interest.

As HUM stock has weekly expirations, I expect there to be more liquidity added as each week more contracts expire from now until 10/21.

Tying It All Together

HUM stock has many interesting characteristics that traders & investors are sure to find appealing.

Investors will like their balance sheet, as well as the safety of their modest dividend yield.

Traders will like the liquidity of their options, as well as their current technical performance.

Overall, it is worth taking a closer look into HUM stock to see how it fits into your portfolio strategy.

*** I DO NOT OWN SHARES OF HUM STOCK AT THE TIME OF PUBLISHING THIS ARTICLE ***

Ferrari NV RACE Stock Analysis

Ferrari NV stock trades under the ticker RACE & has shown recent bullishness that traders & investors should research further into.

RACE stock closed at $199.62/share on 9/14/2022.

Ferrari NV RACE Stock’s Technical Performance Broken Down

Ferrari NV RACE Stock's Technical Performance Over The Last Year

RACE Stock Price: $199.62

10 Day Moving Average: $195.19

50 Day Moving Average: $201.81

200 Day Moving Average: $213.45

RSI: 49.75

MACD: -2.127

Yesterday, RACE stock completed a bullish MACD crossover, gapping up 2.1%.

Their recent trading volumes have been below average, and their RSI is neutral, signaling uncertainty by market participants on their valuation.

They have support at the $196.22 & $192.06/share price levels, as they try to break above the $201.87 & $202.81/share resistance levels.

Ferrari NV RACE Stock As A Long-Term Investment

Long-term oriented investors may find RACE stock’s valuation metrics to be a bit high, with a 39.73 P/E (ttm) & a 15.85 P/B (mrq).

They recently reported 24.9% Quarterly Revenue Growth Y-o-Y, with 21% Quarterly Earnings Growth Y-o-Y.

Their balance sheet may require a more thorough review, with $1.24B of Total Cash (mrq) & $2.77B of Total Debt (mrq).

RACE stock pays a 0.7% dividend, which appears stable in the long-run, as their payout ratio is 27.63%.

44.38% of RACE stock’s outstanding share float is owned by institutional investors.

Ferrari NV RACE Stock As A Short-Term Trade Using Options

Short-term oriented traders can use options to profit from movements in RACE stock’s price, while hedging against volatility.

I am looking at the contracts with the 10/21 expiration date.

The $195 calls are in-the-money, with the out-of-the-money $200 & $210 also having open interest.

The $200 & $210 puts are also in-the-money, with the former being more liquid than the latter strike price.

As they have weekly expirations, I expect to see more contracts written in the coming weeks as other contracts expire.

Tying It All Together

RACE stock has many interesting attributes that traders & investors are sure to like.

Investors will like their dividend yield, as well as their recent growth metrics.

Traders will like their current technicals, as well as their liquid, weekly option expirations.

All-in-all, it is worth taking a closer look into how RACE stock fits into your portfolio strategy.

*** I DO NOT OWN SHARES OF RACE STOCK AT THE TIME OF PUBLISHING THIS ARTICLE ***

Brookfield Asset Management Inc. BAM Stock Analysis

Brookfield Asset Management Inc. stock trades under the ticker BAM & has shown recent bullishness that traders & investors should research further into.

BAM stock closed at $49.73/share on 9/14/2022.

Brookfield Asset Management Inc. BAM Stock’s Technical Performance Broken Down

Brookfield Asset Management Inc. BAM Stock's Technical Performance Over The Last Year

BAM Stock Price: $49.73

10 Day Moving Average: $48.88

50 Day Moving Average: $48.85

200 Day Moving Average: $51.97

RSI: 51.05

MACD: -0.022

Yesterday, BAM stock completed a bullish MACD crossover, settling ~2% above its 10 & 50 day moving averages.

Recent trading volumes have been about average compared to the year prior, and their RSI is neutral, signaling that they may have more near-term momentum, pending broader market volatility.

BAM stock has support at the $49.13 & $48.84/share price levels, as they try to break above the $51.33 & $51.45/share resistance levels.

Brookfield Asset Management Inc. BAM Stock As A Long-Term Investment

Long-term oriented investors will like BAM stock’s valuation metrics, with a 21.97 P/E (ttm) & a 1.89 P/B (mrq).

Investors may want to look into more details about their recently reported 26.9% Quarterly Revenue Growth Y-o-Y & -27.7% Quarterly Earnings Growth Y-o-Y.

Their balance sheet will also require an additional review, with $12.2B of Total Cash (mrq) & $199.64B of Total Debt (mrq).

BAM stock pays a 1.1% dividend, which appears stable in the long-run, as their payout ratio is 23.58%.

74.73% of BAM stock’s outstanding share float is owned by institutional investors.

Brookfield Asset Management Inc. BAM Stock As A Short-Term Trade Using Options

Short-term focused traders can use options to profit from BAM stock’s price movements, while protecting their portfolio from volatility.

I am looking at the contracts with the 10/21 expiration date.

The $45 & $35 calls are in-the-money, with the former being more liquid than the latter.

The $50 & $55 puts are also in-the-money, listed from highest to lowest level of open interest.

There should be more liquidity after tomorrow (9/16)’s expiration date passes & contracts expire.

Tying It All Together

BAM stock has many interesting attributes that traders & investors are sure to like.

Investors will like their dividend yield, as well as their valuation metrics, but may want to look into their balance sheet.

Traders will like their current technical strength, but may be disappointed in how liquid their options are.

Overall, it is worth taking a closer look into BAM stock to see how it fits into your portfolio strategy.

*** I DO NOT OWN SHARES OF BAM STOCK AT THE TIME OF PUBLISHING THIS ARTICLE ***

Whitestone REIT WSR Stock Analysis

Whitestone REIT stock trades under the ticker WSR & has shown recent bullishness that traders & investors should take a closer look into.

WTR stock closed at $9.98/share on 9/13/2022.

Whitestone REIT WSR Stock’s Technical Performance Broken Down

Whitestone REIT WSR Stock's Technical Performance Over The Last Year

WSR Stock Price: $9.98

10 Day Moving Average: $9.91

50 Day Moving Average: $10.48

200 Day Moving Average: $10.99

RSI: 42.4

MACD: -0.194

Yesterday, WSR stock completed a bullish MACD crossover, despite dropping 2.35% & settling just above their 10 day moving average.

Recent trading volumes have been low, and their RSI is on the oversold side of neutral, signaling that investors aren’t sure where to properly value WSR stock at the moment.

They have support at the $9.76 & $9.59/share price levels, while they try to break out & above the $10.07 & $10.24/share resistance levels.

Whitestone REIT WSR Stock As A Long-Term Investment

Long-term oriented investors will like WSR stock’s valuation metrics, with a 29.85 P/E (ttm) & a 1.25 P/B (mrq).

Investors may want to look into their recently reported 13.6% Quarterly Revenue Growth Y-o-Y, and -15.4% Quarterly Earnings Growth Y-o-Y before investing.

Their balance sheet is also going to require a more thorough examination, with $8.46M of Total Cash (mrq) & $638.2M of Total Debt (mrq).

WSR stock pays a 4.33% dividend, however, this may not be sustainable in the long-run, as their payout ratio is 135%.

70.32% of WSR stock’s outstanding share float is owned by institutional investors.

Whitestone REIT WSR Stock As A Short-Term Trade Using Options

Short-term focused traders can use options to profit from movements in WSR stock’s price, while protecting their portfolios from broader market volatility.

I am looking at the contracts with the 10/21 expiration date.

The $7.50 calls are in-the-money, with the $10 & $12.50 having open interest, but being out-of-the-money.

The $10 puts are in-the-money, and the only strike price with liquidity at the moment.

There will likely be more contracts written in the coming weeks, after Friday 9/16’s expiration passes.

Tying It All Together

WSR stock has many interesting characteristics that traders & investors will like.

Investors will like their valuation metrics, and will like their dividend yield, but should be mindful that it may have to be cut in the future.

Traders will like their recent technical strength, but may be disappointed by how liquid their options are.

Overall, it is worth taking a closer look into WSR stock to see how it fits into your portfolio strategy.

*** I DO NOT OWN SHARES OF WSR STOCK AT THE TIME OF PUBLISHING THIS ARTICLE ***

Eagle Bulk Shipping Inc. EGLE Stock Analysis

Eagle Bulk Shipping Inc. stock trades under the ticker EGLE & has shown recent bullishness that traders & investors should take a closer look into.

EGLE stock closed at $46.85/share on 9/13/2022.

Eagle Bulk Shipping Inc. EGLE Stock’s Technical Performance Broken Down

Eagle Bulk Shipping Inc. EGLE Stock's Technical Performance Over The Last Year

EGLE Stock Price: $46.85

10 Day Moving Average: $43.24

50 Day Moving Average: $47.12

200 Day Moving Average: $50.33

RSI: 52.33

MACD: -1.499

Yesterday, EGLE stock completed a bullish MACD crossover, gapping up 5.16% to settle just below its 50 day moving average.

Recent trading volumes have been about average compared to the year prior, and their RSI is still neutral, signaling that there may be more strength to come as they look to establish a new price range.

They have support at the $46.75 & $46.68 price levels, as they try to break above the $47.29 & $49.95/share resistance levels.

Eagle Bulk Shipping Inc. EGLE Stock As A Long-Term Investment

Long-term focused investors will like EGLE stock’s valuation metrics, with a 2.27 P/E (ttm) & a 0.78 P/B (mrq).

They recently reported 53% Quarterly Revenue Growth Y-o-Y, with 923.9% Quarterly Earnings Growth Y-o-Y.

Their balance sheet will require a deeper dive before investment, with $138.96M of Total Cash (mrq) & $403.64M of Total Debt (mrq).

EGLE stock pays an 18.52% dividend, which appears stable in the long-run, as their payout ratio is 31.48%.

88.42% of EGLE stock’s outstanding share float is owned by institutional investors.

Eagle Bulk Shipping Inc. EGLE Stock As A Short-Term Trade Using Options

Short-term oriented traders can use options to profit from EGLE stock’s price movements, while protecting their portfolio from market volatility.

I am looking at the contracts with the 10/21 expiration date.

The $45 & $40 calls are in-the-money, with the former being more liquid than the latter.

The $50, $55 & $60 puts are also in-the-money, listed from most to least level of open interest.

Tying It All Together

EGLE stock has many interesting attributes that traders & investors are sure to find appealing.

Investors will like their valuation metrics & dividend yield, but may want to review their balance sheet structure closer before investing.

Traders will like their current technical performance amid a volatile market.

All-in-all, it is worth taking a closer look into EGLE stock to see how it fits into your portfolio strategy.

*** I DO NOT OWN SHARES OF EGLE STOCK AT THE TIME OF PUBLISHING THIS ARTICLE ***

SpartanNash Company SPTN Stock Analysis

SpartanNash Company stock trades under the ticker SPTN & has shown recent bullishness that traders & investors should research further into.

SPTN stock closed at $31.34/share on 9/12/2022.

SpartanNash Company SPTN Stock’s Technical Performance Broken Down

SpartanNash Company SPTN Stock's Technical Performance Over The Last Year

SPTN Stock Price: $31.34

10 Day Moving Average: $30.80

50 Day Moving Average: $31.42

200 Day Moving Average: $29.90

RSI: 50.14

MACD: -0.195

Yesterday, SPTN stock completed a bullish MACD crossover, settling down 0.67%, just beneath its 50 day moving average.

Recent trading volumes have been below average compared to the year prior, and their RSI is still neutral, signaling that investors are not confident in their current valuation & there may be more volatility ahead in the near-term.

They have support at the $31.10 & $30.87/share price levels, as they try to break above the $31.69 & $31.92/share resistance levels.

SpartanNash Company SPTN Stock As A Long-Term Investment

Long-term oriented investors will like SPTN stock’s valuation metrics, with an 18.45 P/E (ttm) & 1.42 P/B (mrq).

Investors will want to review their recently reported growth before investing though, with 7.9% Quarterly Revenue Growth Y-o-Y, but -69.6% Quarterly Earnings Growth Y-o-Y.

Their balance sheet will also require a closer examination before investing, with $21.2M of Total Cash (mrq) & $773.71M of Total Debt (mrq).

SPTN stock pays a 2.6% dividend, which appears to be stable in the long-run, as their payout ratio is 47.95%.

90.34% of SPTN stock’s outstanding share float is owned by institutional investors.

SpartanNash Company SPTN Stock As A Short-Term Trade Using Options

Short-term oriented traders can use options to profit from price movements in SPTN stock, while hedging against broader market volatility.

I am looking at the contracts with the 10/21 expiration date.

The $30, $25 & $22.50 call options are all in-the-money, listed from most to least liquid strike price.

Currently, only the $35 puts are in-the-money, but there will likely be an increase in contracts written after Friday’s September expiration date passes (9/16).

Tying It All Together

SPTN stock has many attributes that traders & investors are sure to find interesting.

Investors will like their valuation metrics, as well as their safe dividend yield.

Traders will like their current technical strength compared to the rest of the market.

Overall, it is worth taking a closer look into SPTN stock to see how it fits into your portfolio strategy.

*** I DO NOT OWN SHARES OF SPTN STOCK AT THE TIME OF PUBLISHING THIS ARTICLE ***

New York Times Co. NYT Stock Analysis

New York Times Co. stock trades under the ticker NYT & has shown recent bullish behavior that traders & investors should take a closer look into.

NYT stock closed at $31.74/share on 9/12/2022.

New York Times Co. NYT Stock’s Technical Performance Broken Down

New York Times Co. NYT Stock's Technical Performance Over The Last Year

NYT Stock Price: $31.74

10 Day Moving Average: $30.74

50 Day Moving Average: $30.90

200 Day Moving Average: $38.26

RSI: 53.94

MACD: -0.109

Yesterday, NYT stock completed a bullish MACD crossover, as it fell 0.13%.

Their RSI is neutral & recent trading volumes are low, signaling near-term uncertainty in their value by market participants.

They have support at $31.58 & $31.25/share, as they attempt to break out & above the $31.91 & $32.06 resistance levels.

New York Times Co. NYT Stock As A Long-Term Investment

Long-term oriented investors will like NYT stock’s 27.88 P/E (ttm), but they may find their 3.43 P/B (mrq) to be a bit rich.

They recently reported 11.6% Quarterly Revenue Growth Y-o-Y, with 13.7% Quarterly Earnings Growth Y-o-Y.

Their balance sheet reflects $223.25M of Total Cash (mrq).

NYT stock pays a 1.01% dividend, which appears to be stable in the long-run, as their payout ratio is 26.32%.

92.9% of NYT stock’s outstanding share float is owned by institutional investors.

New York Times Co. NYT Stock As A Short-Term Trade Using Options

Short-term focused traders can use options to profit from price movements in NYT stock, while protecting their portfolio from broader market volatility.

I am looking at the contracts with the 10/21 expiration date.

The $31, $28 & $30 call options are all in-the-money, listed from highest to lowest level of open interest.

The $35, $34 & $32 puts are also in-the-money, with the former being more liquid than the latter.

Tying It All Together

NYT stock has many interesting characteristics that traders & investors are sure to like.

Investors will like their dividend yield, as well as their recent growth.

Traders will like their current technical resilience in a volatile market.

Overall, NYT stock is worth taking a closer look into to see how it fits into your portfolio strategy.

*** I DO NOT OWN SHARES OF NYT STOCK AT THE TIME OF PUBLISHING THIS ARTICLE ***

Zoetis Inc. ZTS Stock Analysis

Zoetis Inc. stock trades under the ticker ZTS & has shown recent bullishness that traders & investors should research further into.

ZTS stock closed at $164.31/share on 9/9/2022.

Zoetis Inc. ZTS Stock’s Technical Performance Broken Down

Zoetis Inc. ZTS Stock's Technical Performance Over The Last Year

ZTS Stock Price: $164.31

10 Day Moving Average: $158.78

50 Day Moving Average: $171.00

200 Day Moving Average: $187.57

RSI: 49.12

MACD: -3.552

On Friday, ZTS stock completed a bullish MACD crossover, settling above its 10 day moving average, after gapping up 3.67%.

Recent trading volumes have been about average for the year prior, and their RSI is neutral, signaling that there may be more upward momentum to come in the near-term.

They have support at the $156.38 & 154.49/share price levels, while they try to break above the $165.45 & $168.24/share resistance levels.

Zoetis Inc. ZTS Stock As A Long-Term Investment

Long-term oriented investors may find ZTS stock’s valuation metrics to be a bit rich, and would be wise to compare them to industry peers, with their 35.6 P/E (ttm) & 16.05 P/B (mrq).

They recently reported 5.3% Quarterly Revenue Growth Y-o-Y, with 3.3% Quarterly Earnings Growth Y-o-Y.

Their balance sheet may warrant a closer examination before investing as well, with $2.75B of Total Cash (mrq) & $6.76B of Total Debt (mrq).

ZTS stock pays a 0.73% dividend, which appears stable in the long-term, as their payout ratio is 26.08%.

94.03% of ZTS stock’s outstanding share float is owned by institutional investors.

Zoetis Inc. ZTS Stock As A Short-Term Trade Using Options

Short-term focused traders can use options to profit from ZTS stock’s price movements, while protecting their portfolio from volatility in the broader markets.

I am looking at the contracts with the 10/21 expiration date.

The $160, $155 & $150 call options are all in-the-money, listed from highest to lowest levels of open interest.

The $180, $165 & $175 puts are also all in-the-money, with the former being more liquid than the latter strikes.

Tying It All Together

ZTS stock has many interesting attributes that traders & investors should find appealing.

Investors will like their stable dividend yield, but may want to dig deeper into their balance sheet & valuation metrics before investing.

Traders will like their current technical performance, as well as the liquidity of their options.

Overall, it is worth taking a closer look into ZTS stock to see how it fits into your portfolio strategy.

*** I DO NOT OWN SHARES OF ZTS STOCK AT THE TIME OF PUBLISHING THIS ARTICLE ***

Bank of New York Mellon Corp. BK Stock Analysis

Bank of New York Mellon Corp. stock trades under the ticker BK & has shown recent bullishness that traders & investors should take a closer look into.

BK stock closed at $44.14/share on 9/9/2022.

Bank of New York Mellon Corp. BK Stock’s Technical Performance Broken Down

Bank of New York Mellon Corp. BK Stock's Technical Performance Over The Last Year

BK Stock Price: $44.14

10 Day Moving Average: $42.10

50 Day Moving Average: $42.76

200 Day Moving Average: $48.99

RSI: 59.9

MACD: -0.145

On Friday, BK stock completed a bullish MACD crossover, gapping up 0.73%.

Recent trading volumes have been below average for the year, and their RSI is on the overbought end of neutral, signaling that there is uncertainty in BK stock’s value for market participants.

They have support at $43.68 & $41.54/share, as they attempt to break out above the $44.38 & $44.46/share resistance levels.

Bank of New York Mellon Corp. BK Stock As A Long-Term Investment

Long-term oriented investors will like BK stock’s valuation metrics, with a 10.49 P/E (ttm) & a 0.92 P/B (mrq).

They recently reported 4% Quarterly Revenue Growth Y-o-Y, despite -15% Quarterly Earnings Growth Y-o-Y, which investors may want to look into before investing.

Investors are sure to find their balance sheet appealing, with $177.17B of Total Cash (mrq) & $67.76B of Total Debt (mrq).

BK stock pays a 3.1% dividend, which appears to be stable in the long-term, as they have a 34.69% payout ratio.

85.53% of BK stock’s outstanding share float is owned by institutional investors.

Bank of New York Mellon Corp. BK Stock As A Short-Term Trade Using Options

Short-term oriented traders can use options to protect themselves from market volatility, while profiting from price movements in BK stock.

I am looking at the options with the 10/21 expiration date.

The $35 & $40 calls are in-the-money, listed from highest to lowest level of open interest.

The $45 & $50 puts are also in-the-money, with the former being more liquid than the latter strike.

BK stock’s options have weekly expiration, so I expect these to become more liquid in the coming weeks as other expirations pass.

Tying It All Together

BK stock has many interesting characteristics that traders & investors are sure to like.

Investors will like their valuation, balance sheet & dividend yield.

Traders will like their current technical performance, as well as the liquidity of their options.

All-in-all, it is worth taking a closer look into BK stock to see how it fits into your portfolio strategy.

*** I DO NOT OWN SHARES OF BK STOCK AT THE TIME OF PUBLISHING THIS ARTICLE ***

Abbott Laboratories ABT Stock Analysis

Abbott Laboratories stock trades under the ticker ABT & has shown recent bullishness that traders & investors should take a closer look into.

ABT stock closed at $106.99/share on 9/8/2022.

Abbott Laboratories ABT Stock’s Technical Performance Broken Down

Abbott Laboratories ABT Stock's Technical Performance Over The Last Year

ABT stock Price: $106.99

10 Day Moving Average: $103.62

50 Day Moving Average: $107.90

200 Day Moving Average: $117.47

RSI: 52.09

MACD: -1.333

Yesterday, ABT stock completed a bullish MACD crossover, closing under its 50 day moving average.

Their recent trading volumes have been about average for the last year, and their RSI is neutral, signaling that there may be more momentum to come in the near-term.

They have support at the $104.17 & $103.76/share price levels, as they try to break out above the $109.79 & $109.98/share resistance levels.

Abbott Laboratories ABT Stock As A Long-Term Investment

Long-term oriented investors will like ABT stock’s 21.4 P/E (ttm), but may find their 4.92 P/B (mrq) to be a bit too rich.

They recently reported 10.1% Quarterly Revenue Growth Y-o-Y, with 69.7% Quarterly Earnings Growth Y-o-Y.

Their balance sheet will require a more thorough review, with $9.29B of Total Cash (mrq) & $16.84B of Total Debt (mrq).

ABT stock pays a 1.78% dividend, which appears stable in the long-term, as their payout ratio is 38.41%.

75.91% of ABT stock’s outstanding share float is owned by institutional investors.

Abbott Laboratories ABT Stock As A Short-Term Trade Using Options

Short-term focused traders can use options to profit from ABT stock’s price movements, while protecting their portfolio from volatility.

I am looking at the contracts with the 9/16 expiration date.

The $106, $105 & $103 call options are all in-the-money, listed from most to least liquid strike.

The $110, $107 & $108 puts are also all in-the-money, with the former having more interest than the latter.

Tying It All Together

ABT stock has many interesting characteristics that traders & investors are sure to find appealing.

Investors will like their dividend yield & recent growth metrics, but may want to look deeper into their balance sheet.

Traders will like their recent technical performance, as well as the liquidity of their options.

All-in-all, ABT stock is worth taking a closer look into to see how it fits into your portfolio strategy.

*** I DO NOT OWN SHARES OF ABT STOCK AT THE TIME OF PUBLISHING THIS ARTICLE ***